Download presentation
Presentation is loading. Please wait.

1
Comparing 2 populations

5
Placebo

7
go to see a doctor

8
Control group

9
Twin study

10
WSJ WSJ ad.

11
Twin study A D E A D E A D E A D E

12
Randomized principle B C F B C F A D E A D E A B C D E F

14
No control group study A D E A D E B C F B C F

15
matched sample/paired sample A D E A D E B C F B C F

16
A D E A D E B C F B C F Placebo - (single) blinded test
 blinded test")
17
Double blinded test V V

18
V V

19
405060708090100 405060708090100 405060708090100 405060708090100

21
4.85, 4.56, 4.76, 4.14, 4.94, 4.99, 4.62, 3.43, 4.21 5.35, 4.57, 5.13, 6.35, 4.22, 5.03, 5.09, 4.67 4.14, 4.89, 5.14, 4.93, 5.04, 5.25, 5.17, 5.09 (%) Protein of milk produced two farms (artificial data)
 Protein of milk produced two farms (artificial data)")
22
34567 34567

23
1) 95% CI of 2) Tests with ( )
 95% CI of 2) Tests with ( )")
24
I. are known III. are unknown II. (unknown)
")
25
I. are known 95% CI of

26
I. are known Do test with 1.96 ± 1.645

27
II. (unknown)
")
28
95% CI of II. (unknown)
")
29
Do test with II. (unknown)
")
30
III. are unknown Satterthwaite’s approximated df

31
integer

32
95% CI of III. are unknown

33
Do test with

34
95% CI of

37
> x<-c(4.85,4.56,4.76,4.14,4.94,4.99,4.62,3.43,4.21) > y<-c(5.35,4.57,5.13,6.35,4.22,5.03,5.09,4.67,4.14, 4.89,5.14,4.93,5.04,5.25,5.17,5.09) > > t.test(x,y) Welch Two Sample t-test data: x and y t = -2.4178, df = 16.71, p-value = 0.02735 alternative hypothesis: true difference in means is not equal to 0 95 percent confidence interval: -0.94390833 -0.06359167 sample estimates: mean of x mean of y 4.50000 5.00375
 > y<-c(5.35,4.57,5.13,6.35,4.22,5.03,5.09,4.67,4.14, 4.89,5.14,4.93,5.04,5.25,5.17,5.09) > > t.test(x,y) Welch Two Sample t-test data: x and y t = , df = 16.71, p-value = alternative hypothesis: true difference in means is not equal to 0 95 percent confidence interval: sample estimates: mean of x mean of y")
38
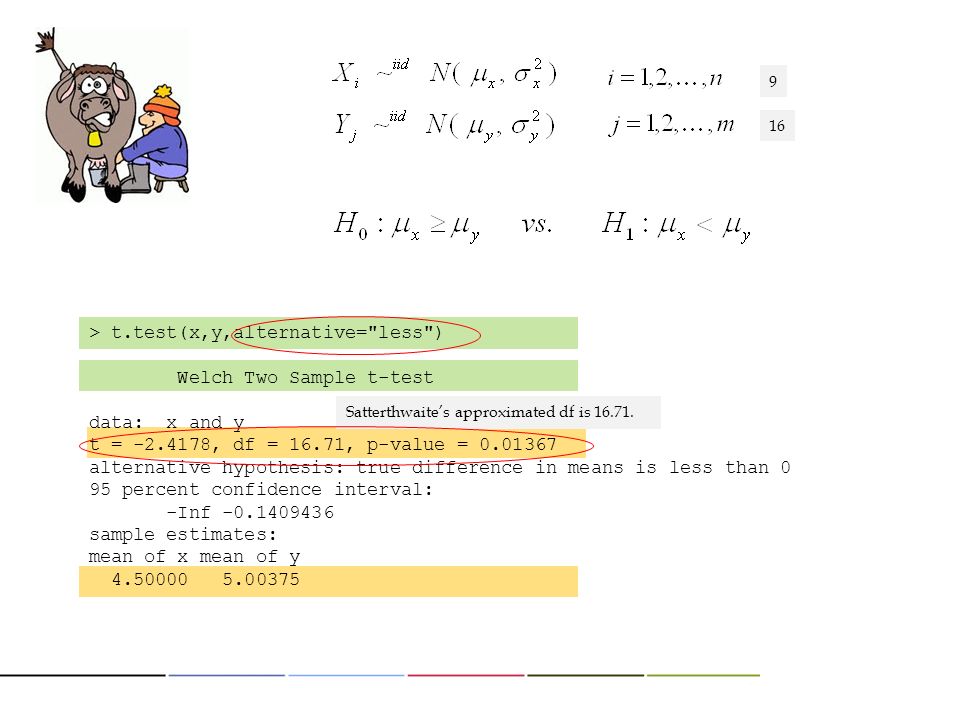
> t.test(x,y,alternative="less") Welch Two Sample t-test data: x and y t = -2.4178, df = 16.71, p-value = 0.01367 alternative hypothesis: true difference in means is less than 0 95 percent confidence interval: -Inf -0.1409436 sample estimates: mean of x mean of y 4.50000 5.00375 Satterthwaite’s approximated df is 16.71. 9 16
39
> t.test(x,y,var.equal=T) Two Sample t-test data: x and y t = -2.4179, df = 23, p-value = 0.02394 alternative hypothesis: true difference in means is not equal to 0 95 percent confidence interval: -0.93474188 -0.07275812 sample estimates: mean of x mean of y 4.50000 5.00375 Equal variance Compare df with the one obtained by Satterthwaite’s approximated df (16.71). 9 16

40
n, m are large

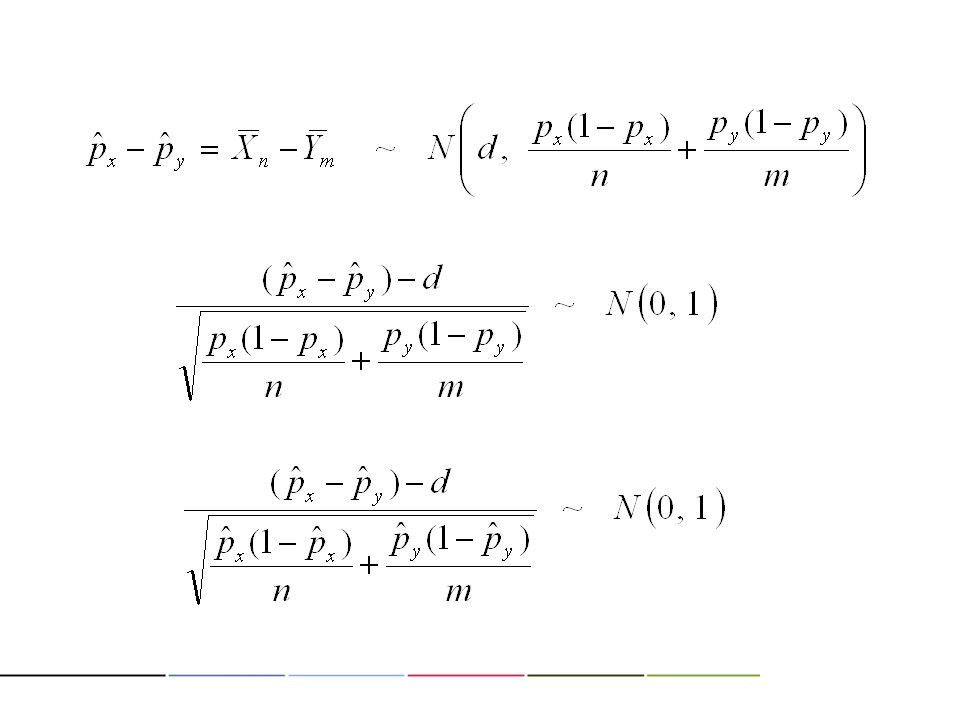
42
95% CI of

43
2) Tests with Assume, that is
 Tests with Assume, that is")
44
Do test with

45
> head2 <- c( 560, 640) > toss2 <- c( 1000, 1000) > prop.test(head2, toss2) 2-sample test for equality of proportions …. data: head2 out of toss2 X-squared = 13.0021, df = 1, p-value = 0.0003111 alternative hypothesis: two.sided 95 percent confidence interval: -0.12379728 -0.03620272 sample estimates: prop 1 prop 2 0.56 0.64 See Chi-square test for more general approach !! CaesarTolemy Head560640 Tail440360 || ? : : 560 440 640 360

46
> # > # H0 : all four coins have the same proportion showing head side > # H1 : at least one coin have different proportion to the others > # > > head4 <- c( 83, 90, 129, 70 ) > toss4 <- c( 86, 93, 136, 82 ) > prop.test(head4, toss4) 4-sample test for equality of proportions without continuity correction data: head4 out of toss4 X-squared = 12.6004, df = 3, p-value = 0.005585 alternative hypothesis: two.sided sample estimates: prop 1 prop 2 prop 3 prop 4 0.9651163 0.9677419 0.9485294 0.8536585 Coin 1Coin 2Coin 3Coin 4 Head839012970Alive Tail33712Dead Total869313682Total Hospital 1Hospital 2Hospital 3Hospital 4
 > toss4 <- c( 86, 93, 136, 82 ) > prop.test(head4, toss4) 4-sample test for equality of proportions without continuity correction data: head4 out of toss4 X-squared = , df = 3, p-value = alternative hypothesis: two.sided sample estimates: prop 1 prop 2 prop 3 prop Coin 1Coin 2Coin 3Coin 4 Head Alive Tail33712Dead Total Total Hospital 1Hospital 2Hospital 3Hospital 4")
47
Subject (case) variation + treatment effect
 variation + treatment effect")
48
Consider the following study in which standing and supine systolic blood pressures were compared. This study was performed on twelve subjects. Their blood pressures were measured in both positions. Suggested null and alternative hypotheses could be: H 0 : There is no difference between the mean blood pressures in the two populations H 1 : There is a difference between the mean blood pressures in the two populations or equivalently H 0 : On average there is no difference between the blood pressures in the two populations H 1 : On average there is a difference between the blood pressures in the two populations Paired sample t-test

49
SubjectStandingSupineDifference 1 1321364 2 1461451 3 1351405 4 1411476 5 1391423 6 162160-2 7 1281379 8 136 9 1451494 10 1511587 11 131120-11 12 1431507 Mean 140.83143.332.50 SD 9.4910.835.50 Blood pressures (mmHg) Subject (human) variation is much larger than the position variation
 Subject (human) variation is much larger than the position variation")
50
Paired sample t-test ( X ) ( O )
 ( O )")
51
> x<-c(132,146,135,141,139,162,128,137,145,151,131,143) > y<-c(136,145,140,147,142,160,137,136,149,158,120,150) > > t.test(x,y) Welch Two Sample t-test data: x and y t = -0.6012, df = 21.629, p-value = 0.5539 alternative hypothesis: true difference in means is not equal to 0 95 percent confidence interval: -11.132112 6.132112 sample estimates: mean of x mean of y 140.8333 143.3333 > t.test(x,y,paired=T) Paired t-test data: x and y t = -1.574, df = 11, p-value = 0.1438 alternative hypothesis: true difference in means is not equal to 0 95 percent confidence interval: -5.9958458 0.9958458 sample estimates: mean of the differences -2.5 ( X ) ( O )
 > y<-c(136,145,140,147,142,160,137,136,149,158,120,150) > > t.test(x,y) Welch Two Sample t-test data: x and y t = , df = , p-value = alternative hypothesis: true difference in means is not equal to 0 95 percent confidence interval: sample estimates: mean of x mean of y > t.test(x,y,paired=T) Paired t-test data: x and y t = , df = 11, p-value = alternative hypothesis: true difference in means is not equal to 0 95 percent confidence interval: sample estimates: mean of the differences -2.5 ( X ) ( O )")
52
Student’s sleep data Student (1908), The probable error of a mean. Biometrika, 6 -1, 1-25.
, The probable error of a mean. Biometrika, 6 -1, 1-25.")
53
IDControlTreatment 1 0.7 1.9 2-1.6 0.8 3-0.2 1.1 4-1.2 0.1 5-0.1 6 3.4 4.4 7 3.7 5.5 8 0.8 1.6 9 0.0 4.6 10 2.0 3.4 Student’s sleep data Data which show the effect of two soporific drugs (increase in hours of sleep compared to control) on 10 patients. R has this data.

54
Student’s sleep data > t.test(extra ~ group, paired=T, data = sleep) Paired t-test data: extra by group t = -4.0621, df = 9, p-value = 0.002833 alternative hypothesis: true difference in means is not equal to 0 95 percent confidence interval: -2.4598858 -0.7001142 sample estimates: mean of the differences -1.58 > t.test(extra ~ group, data = sleep) Welch Two Sample t-test data: extra by group t = -1.8608, df = 17.776, p-value = 0.07939 alternative hypothesis: true difference in means is not equal to 0 95 percent confidence interval: -3.3654832 0.2054832 sample estimates: mean in group 1 mean in group 2 0.75 2.33 ( X ) ( O ) In paired sample t-test, mean difference is more easily detected !
 Paired t-test data: extra by group t = , df = 9, p-value = alternative hypothesis: true difference in means is not equal to 0 95 percent confidence interval: sample estimates: mean of the differences > t.test(extra ~ group, data = sleep) Welch Two Sample t-test data: extra by group t = , df = , p-value = alternative hypothesis: true difference in means is not equal to 0 95 percent confidence interval: sample estimates: mean in group 1 mean in group ( X ) ( O ) In paired sample t-test, mean difference is more easily detected !")
55
Student’s sleep data > stripchart(extra~group,pch=16, cex=1.4,col=c("red","blue"), ylim=c(0.5,2.5),data=sleep) > xsleep<-data.frame(diff=sleep$extra[11:20]-sleep$extra[1:10],group=factor("2-1")) > stripchart(diff~group,pch=16, cex=1.4,col="brown", ylim=c(0.5,1.5),data=xsleep) Do the blue and red groups have the same distributions ? Is the (population) mean of the distribution 0 ? group 2 – group 1
![Student’s sleep data > stripchart(extra~group,pch=16, cex=1.4,col=c( red , blue ), ylim=c(0.5,2.5),data=sleep) > xsleep<-data.frame(diff=sleep$extra[11:20]-sleep$extra[1:10],group=factor( 2-1 )) > stripchart(diff~group,pch=16, cex=1.4,col= brown , ylim=c(0.5,1.5),data=xsleep) Do the blue and red groups have the same distributions .](http://images.slideplayer.com/32/9954878/slides/slide_55.jpg "Is the (population) mean of the distribution 0 . group 2 – group 1.")
56
Thank you !!

Similar presentations


 Inference about a Population Mean Conditions for inference The t distribution The one-sample t confidence interval >")


