Download presentation
Presentation is loading. Please wait.

1
Institute of Geodesy and Geophysics, Vienna University of Technology Vienna, February 2004 Harald Schuh Subgroup "Data Analysis" of Working Group 3 VLBI2010

2
–loading corrections (ocean, atmosphere, hydrosphere,...) 1. Geodetic/astrometric data analysis 1.1 Data analysis: Improved models

3
Maximum range and variance in vertical crustal displacement during 1994-1998 (mm) due to changes in atmospheric surface pressure. Atmospheric loading (van Dam et al., 2002)
.")
4
Maximum range and variance in vertical crustal displacement during 1994- 1998 (mm) due to changes in total continental water storage. Hydrological loading (van Dam et al., 2002)
.")
5
Vertical displacements due to snow cover at Algonquin Park. Snow loading (Estermann and Schuh, 2003)
.")
6
–loading corrections (ocean, atmosphere, hydrosphere,...) –antenna deformation and local displacements 1. Geodetic/astrometric data analysis 1.1 Data analysis: Improved models

7
Antenna deformation 1. Geodetic/astrometric data analysis Direct measurement –Invar wire or rod systems monitor height differences between antenna foundations and elevation axes –Currently installed at Onsala and Wettzell

8
Antenna deformation Direct measurement (Zernecke, 1999) 1. Geodetic/astrometric data analysis
 1. Geodetic/astrometric data analysis")
9
Antenna deformation 1. Geodetic/astrometric data analysis Direct measurement –Invar wire or rod systems monitor height differences between antenna foundations and elevation axes –Currently installed at Onsala and Wettzell Thermal model –Model using antenna dimensions, expansion coefficients, measured temperatures –Reasonable agreement with invar measurements at Onsala and Wettzell (using mean daily temperatures)
.")
10
Antenna deformation 1. Geodetic/astrometric data analysis Thermal model (Nothnagel, 1995; IERS Conventions 2003) with h f, h p, h v, h s...dimensions of the telescops f, a.............expansion coefficients T 0.................reference temperature t f, t a.........time delay
 with h f, h p, h v, h s...dimensions of the telescops f, a expansion coefficients T reference temperature t f, t a time delay.")
11
–loading corrections (ocean, atmosphere, hydrosphere,...) –antenna deformation and local displacements –implementation of IAU Resolutions 2000 and of IERS Conventions (2003) 1. Geodetic/astrometric data analysis 1.1 Data analysis: Improved models

12
Earth orientation parameters (precession, nutation, GST) in the FK5 (Capitaine, 2002) IAU Resolutions 2000
 in the FK5 (Capitaine, 2002) IAU Resolutions 2000")
13
Earth orientation parameters (E, d, ) referred to the ICRS (Capitaine, 2002) IAU Resolutions 2000
 referred to the ICRS (Capitaine, 2002) IAU Resolutions 2000")
14
–loading corrections (ocean, atmosphere, hydrosphere,...) –antenna deformation and local displacements –implementation of IAU Resolutions 2000 and of IERS Conventions (2003) –source structure effects (needs in fact a kind of Service) 1. Geodetic/astrometric data analysis 1.1 Data analysis: Improved models

15
VLBI images of 2200 + 420 at X band (top) and S band (bottom) for 10 successive epochs, spanning the period 1997.1-1998.6. The maps are aligned horizontally according to the northern structural component and are spaced linearly according to their observing epochs. The scale is in milliarcseconds. (Charlot, 2002)
.")
16
–loading corrections (ocean, atmosphere, hydrosphere,...) –antenna deformation and local displacements –implementation of IAU Resolutions 2000 and of IERS Conventions (2003) –source structure effects (needs in fact a kind of Service) –phase delay solutions for all baseline lengths 1. Geodetic/astrometric data analysis 1.1 Data analysis: Improved models

17
Phase delay solutions 1. Geodetic/astrometric data analysis Progress has been made on resolving phase delay ambiguities on all baselines (e.g. L. Petrov) –~70% of observations can be successfully resolved –Baseline length repeatabilities from phase delay solutions are not improved except for short baselines (< 5 km) More analysis of phase delays is required –to determine possible systematic instrumental effects –to understand significance of instrascan variations
 –~70% of observations can be successfully resolved –Baseline length repeatabilities from phase delay solutions are not improved except for short baselines (< 5 km) More analysis of phase delays is required –to determine possible systematic instrumental effects –to understand significance of instrascan variations.")
18
1.1 Data analysis: Improved models 1. Geodetic/astrometric data analysis –loading corrections (ocean, atmosphere, hydrosphere,...) –antenna deformation and local displacements –implementation of IAU Resolutions 2000 and of IERS Conventions (2003) –source structure effects (needs in fact a kind of Service) –phase delay solutions for all baseline lengths –improve stochastic model (a priori sigmas, correlations between observables,...)
 –antenna deformation and local displacements –implementation of IAU Resolutions 2000 and of IERS Conventions (2003) –source structure effects (needs in fact a kind of Service) –phase delay solutions for all baseline lengths –improve stochastic model (a priori sigmas, correlations between observables,...).")
20
(Tesmer, 2004) variances
 variances ")
21
1.2 Data analysis: new strategies 1. Geodetic/astrometric data analysis (2) –Robust and Reliable VLBI Solutions –Consistency of TRF, EOP and CRF –Intra-VLBI Combinations of Complete Solutions –Investigations of Differences in Analysis Software Packages –Robust and Reliable VLBI Solutions –Consistency of TRF, EOP and CRF –Intra-VLBI Combinations of Complete Solutions –Robust and Reliable VLBI Solutions –Consistency of TRF, EOP and CRF –Robust and Reliable VLBI Solutions
 –Robust and Reliable VLBI Solutions –Consistency of TRF, EOP and CRF –Intra-VLBI Combinations of Complete Solutions –Investigations of Differences in Analysis Software Packages –Robust and Reliable VLBI Solutions –Consistency of TRF, EOP and CRF –Intra-VLBI Combinations of Complete Solutions –Robust and Reliable VLBI Solutions –Consistency of TRF, EOP and CRF –Robust and Reliable VLBI Solutions.")
22
AustraliaGeoscience Australia IVS Analysis CenterOccam AustriaInstitute of Geodesy and Geophysics (IGG)Occam ChinaShanghai ObservatoryCALC/SOLVE FranceObservatoire de ParisGLORIA FranceObservatoire de BordeauxMODEST GermanyDGFIOccam GermanyGIUB-BKG Analysis CenterCALC/SOLVE ItalyItaly CNRCALC/SOLVE ItalyAgenzia Spaziale ItalianaCALC/SOLVE JapanCommunications Research LaboratoryCALC/SOLVE, vlbest JapanNational Astronomical Observatory of Japan NorwayForsvarets forskningsinstitutt (FFI)GEOSAT RussiaInstitute of Applied Astronomy Analysis CenterOccam RussiaAstronomical Institute of St.-Petersburg UniversityOccam SwedenOnsala Space ObservatoryCALC/SOLVE, GLOBK UkraineMain Astronomical ObservatorySteelBreeze USAGoddard Space Flight CenterCALC/SOLVE USAHaystack ObservatorySOLVK USAU. S. Naval Observatory Analysis CenterCALC/SOLVE USAU. S. Naval Observatory Analysis Center for Source StructureCALC/SOLVE USAJet Propulsion LaboratoryMODEST

23
1.3 Automation of the VLBI Data Analysis Procedure Goal: development of an automatic VLBI analysis tool to achieve VLBI results in near real-time. Step 1: Structured Model of the VLBI Data Analysis Procedure processing strategy of the VLBI data analysis for each step of the data analysis identify - tasks to be performed - parameterization to be selected - models to be used - approach to perform the tasks - evaluation criteria to evaluate the results - error sources causing unsatisfactory results - methods to correct for faults 1. Geodetic/astrometric data analysis

24
1.3 Automation of the VLBI Data Analysis Procedure Goal: development of an automatic VLBI analysis tool to achieve VLBI results in near real-time. Step 1: build a so-called Structured Model of the VLBI Data Analysis Procedure –describe the processing strategy of the VLBI data analysis –for each step of the data analysis - identify tasks to be performed - the parameterization to be selected - the models to be used - the approach to perform the tasks - the evaluation criteria to evaluate the results - the error sources causing unsatisfactory results - and the methods to correct for faults 1. Geodetic/astrometric data analysis

25
establish a Standardization Group on VLBI Data Analysis Step 1: Structured Model of the VLBI Data Analysis Procedure 1. Geodetic/astrometric data analysis 1.3 Automation of the VLBI Data Analysis Procedure (proposed by W. Schwegmann)
.")
26
Step 2: implement the structured model within the existing software establish a VLBI Data Analysis Software Automation Group 1. Geodetic/astrometric data analysis 1.3 Automation of the VLBI Data Analysis Procedure (proposed by W. Schwegmann)
.")
27
1.2 Data analysis: new strategies 1. Geodetic/astrometric data analysis (2) –robust and reliable TRF, CRF, EOP should be achieved by intra-VLBI combination –consistency of CRF and TRF via the EOP –use of different software by different Analysis Centers –phase solutions for all baseline lengths 1.3 Automation –8 comments by Wolfgang Schwegmann on the topic 'Automation in VLBI data analysis'
 –robust and reliable TRF, CRF, EOP should be achieved by intra-VLBI combination –consistency of CRF and TRF via the EOP –use of different software by different Analysis Centers –phase solutions for all baseline lengths 1.3 Automation –8 comments by Wolfgang Schwegmann on the topic Automation in VLBI data analysis .")
28
2.1 Use of numerical weather models for 2. Atmosphere, ancillary data & models –IMF … Isobaric Mapping Functions (Niell, 2001) –VMF … Vienna Mapping Funktions (Boehm and Schuh, 2003, 2004)
 –VMF … Vienna Mapping Funktions (Boehm and Schuh, 2003, 2004).")
29
Wettzell (Boehm and Schuh, 2003, 2004) Vienna Mapping Functions (VMF) from ECMWF data
 Vienna Mapping Functions (VMF) from ECMWF data")
30
2.1 Use of numerical weather models for 2. Atmosphere, ancillary data & models –IMF, VMF,.... –gradients

31
2.1 Use of numerical weather models for 2. Atmosphere, ancillary data & models –IMF … Isobaric Mapping Functions (Niell, 2001) –VMF … Vienna Mapping Funktions (Boehm and Schuh, 2003, 2004) –gradients 2.2 Use of other instruments –WVR –radiosondes –... –WVR
 –VMF … Vienna Mapping Funktions (Boehm and Schuh, 2003, 2004) –gradients 2.2 Use of other instruments –WVR –radiosondes –... –WVR.")
32
3. New goals to be aimed at by VLBI –contribution to climatology

33
(Boehm et al., 2003)
")
34
3. New goals to be aimed at by VLBI –contribution to climatology –galactic rotation –relativistic effects –subdiurnal variations and episodic effects in the EOP –contribution to climatology –galactic rotation –relativistic effects –contribution to climatology –galactic rotation

35
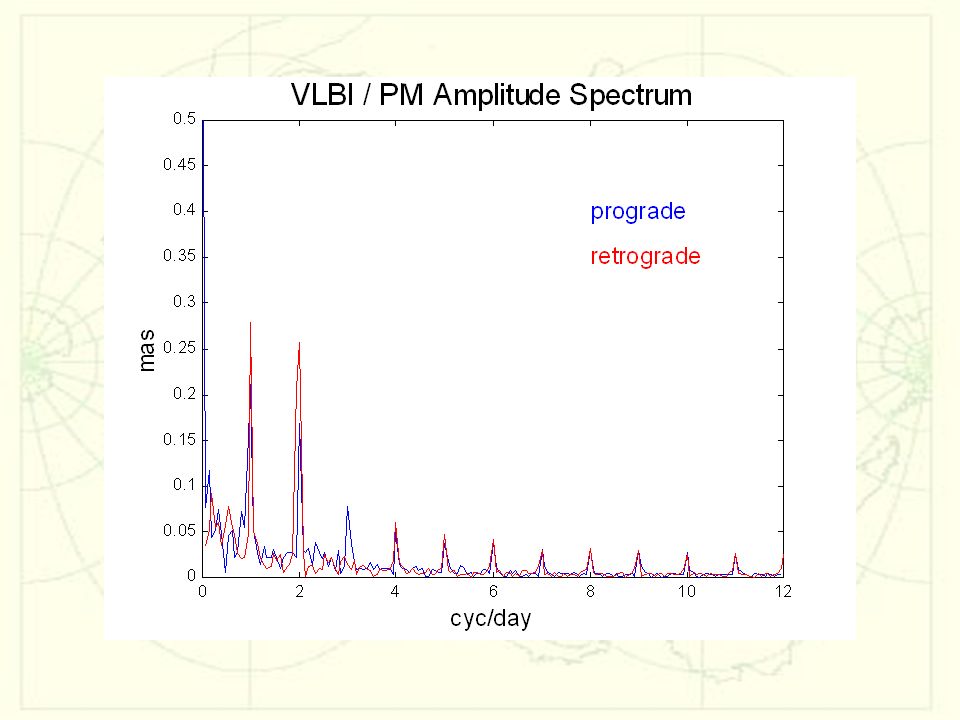
High resolution polar motion during CONT02

36
(Nastula et al., 2004) High resolution polar motion during CONT02
 High resolution polar motion during CONT02")
38
3. New goals to be aimed at by VLBI –contribution to climatology –galactic rotation –relativistic effects –subdiurnal variations and episodic effects in the EOP –contribution to Earthquake research –... –contribution to climatology –galactic rotation –relativistic effects –subdiurnal variations and episodic effects in the EOP –contribution to Earthquake research –...

39
4. New VLBI configurations and observing systems –Space VLBI (VSOP-2 and Radioastron) –observation of satellites transmitting S/X-band –...
 –observation of satellites transmitting S/X-band –....")
40
Members of WG 3 Subgroup “Data Analysis” Johannes Boehm Sergei Bolotin Roger Capallo Gunnar Elgered Gerald Engelhardt Ruediger Haas Thomas Hobiger Ryuichi Ichikawa Dan MacMillan Shigeru Matsuzaka Arthur Niell Axel Nothnagel Harald Schuh (Chair) Wolfgang Schwegmann Ojars Sovers Volker Tesmer Oleg Titov
 Wolfgang Schwegmann Ojars Sovers Volker Tesmer Oleg Titov")
41
THANK YOU FOR YOUR ATTENTION!

42
THANK YOU FOR YOUR ATTENTION!

Similar presentations


 has established a Working Group on Prediction to investigate what IERS prediction.>")


 Geodesy provides a foundation for all Earth observations Space geodesy is the use of precise measurements between space objects (e.g.,>")
, Kamil Teke (1, 2), Pascal Willis (3, 4),>")
