Download presentation
Presentation is loading. Please wait.

2
Who’s transmitting HIV? Is it really the undiagnosed? Dr David Pao Locum Consultant in GUM /HIV Brighton and Sussex University Hospitals, UK

3
Welcome to Brighton Sea, sun and relax…

4
Full of characters… 250,000 of them

5
Full of fun…

8
Things fall apart…

9
The best laid plans of mice and men…

10
Brighton HIV cohort growth Drug Resistance (TDR):
:")
11
Acute HCV infection - Brighton 2008 data projected from data to 11 th March

12
Local data - Brighton Diagnosis2007 Chlamydia904 Gonorrhoea309 HIV infection (inc. transfers in)214 Syphilis (all stages)125 Acute HCV23 LGV3 HIV vs. other STIs?
214 Syphilis (all stages)125 Acute HCV23 LGV3 HIV vs. other STIs .")
15
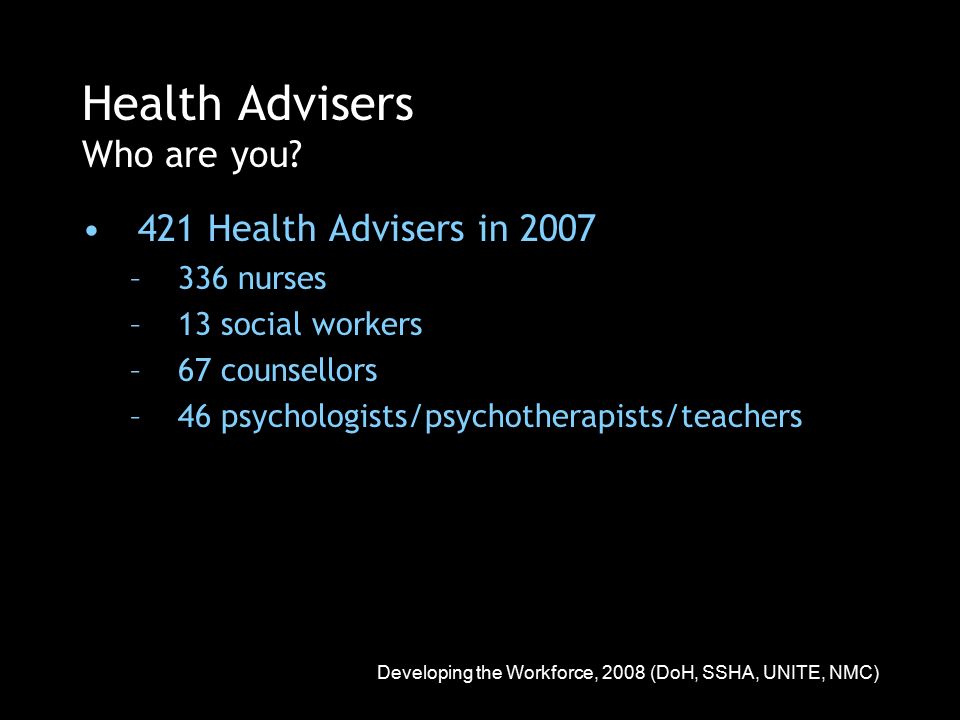
Developing the Workforce, 2008 (DoH, SSHA, UNITE, NMC) Health Advisers Who are you? 421 Health Advisers in 2007 –336 nurses –13 social workers –67 counsellors –46 psychologists/psychotherapists/teachers

16
Manual for Sexual Health Advisors 2004 (DoH, SSHA) Health Advisers Remit Partner notification / contact tracing Sexual health promotion Teaching / training Counselling Research and audit “Partner notification… has been demonstrated to be an effective aspect of managing sexually transmitted infection.” (Payne & O’Brien 2005; NICE 2007)
 Health Advisers Remit Partner notification / contact tracing Sexual health promotion Teaching / training Counselling Research and audit Partner notification… has been demonstrated to be an effective aspect of managing sexually transmitted infection. (Payne & O’Brien 2005; NICE 2007)")
17
SSHA Conference Glasgow 1998 Workshops “Will Health Advising Survive Triple Combination Therapy?” Par·a·digm n. A set of assumptions, concepts, values, and practices that constitutes a way of viewing reality for the community that shares them, especially in an intellectual discipline.

18
Quinn et al, NEJM 2000;342:921-9 Sexual transmission risk and HIV viral load

19
Garcia PM, NEJM 1999 Prevention of mother-to- child transmission No transmission if maternal viremia < 1000/ml

20
Pilcher CD, JID 2005 Amplified Transmission of HIV Acute HIV Infection & STD Co-infection STD Episode AIDS 1/30 or greater odds of transmission to a susceptible partner per coital act 10 8 6 4 2 0 Semen viral load (Log 10 copies/ml)
")
21
Vernazza P et al. Bulletin des Médecins Suisses 2008;89: No. 5 The Swiss Statement Individual level “HIV seropositive individuals on ART with a fully suppressed viral load and no additional sexually transmitted infections do not transmit HIV by sexual means.” Swiss Federal Commission for HIV / AIDS January 2008

22
Granich RM et al. Lancet 2009; 373: 48-57 WHO Model 2009 Population level Test and Treat Concept “Universal voluntary HIV testing with immediate antiretroviral therapy as a strategy for elimination of HIV transmission: a mathematical model.” WHO, Geneva Department of HIV/AIDS January 2009

23
WHO Model 2009 Conclusions Universal testing and treatment would reduce new HIV cases by 95% by 2020 Limitations: adherence, change of behaviour, resistance, toxicity, financing What about in the real world…?

24
Where can we focus? Partner notification Recent HIV infection The undiagnosed Future ideas

25
Moore ZS et al. JAIDS 2009 Partner notification North Carolina 2002-2007 Recent HIV n=120 50% partners tested 9% partners +ve 25% new +ve partners recent Chronic HIV n=9044 39% tested (p<.01) 5% partners +ve (p=.03) 1% new +ve partners recent (p<.01) What about those who refuse HA intervention?
 5% partners +ve (p=.03) 1% new +ve partners recent (p<.01) What about those who refuse HA intervention .")
26
Determinants of HIV transmission: a longitudinal phylogenetic study Brighton and Sussex University Hospitals University College London Health Protection Agency UK

27
Questions How much do the following factors contribute to actual HIV transmissions in Brighton MSM? recent infection (seroconversion) undiagnosed HIV infection HAART STIs
 undiagnosed HIV infection HAART STIs.")
28
Recent Infection Acute Infection Chronic Infection Unknown Infection Recent Infection So what? HAART No HAART

29
Recent Infection Acute Infection Chronic Infection Unknown Infection Chronic Infection HAART No HAART x Recent Infection So what?

30
Recent Infection Acute Infection Chronic Infection Recent Infection So what?

31
Recent Infection Acute Infection Chronic Infection Unknown Infection Recent Infection So what?

32
Phylogenetics Viral gene sequences Phylogenetic tree 1 AAAGTTCTC… 2 AATGTTCTC… 3 AATGTTGTC… 2 1 3 Viral population Infected population 123 1 2 3 Study of the origin, characteristics and spread of epidemics, based on viral diversity:

33
123 cgttttaac 1 cgtttagac 2 cgtctagag 3 0.5 subst Genetic Relatedness & Phylogenies

34
Pao D et al. AIDS AIDS 2005;19(1):85-90. 0.1 nucleotide substitutions per site 5 14 34 11 33 76 24 35 104 1 8 47 93 69 97 12 36 13 22 28 46 101 67 77 64 96 73 85 45 55 58 94 20 31 32 57 70 39 79 54 80 15 17 78 81 29 30 71 74 42 43 44 102 D D 48 65 96 18 37 68 53 84 72 49 83 41 98 103 86 100 C C 75 87 10 16 21 23 89 63 E E F F 2 3 38 25 26 95 4 6 40 90 88 92 50 9 19 7 61 60 B B 91 51 66 52 56 59 82 62 99 Outgroup K 100 87 100 85 100 97 100 62 96 100 53 61 98 68 80 100 Methods Phylogenetics

35
Results 2000-2006

36
Results Cohort Description 2000-2006

38
74% of transmitters are unknown or undiagnosed

39
Results Cohort Description 2000-2006

40
recent infection: 2% of follow-up time but 24% of transmissions

41
Results 3 major outcomes 1.74% of transmissions most likely come from undiagnosed HIV 2.Effect of recent infection –2% of follow-up time but 24% of transmissions 3.What else can we do?

43
BHIVA guidance Urge all healthcare workers to consider HIV testing in a wide range of situations and settiges of late and undiagnosed HIV For high HIV prevalent areas >2/1000 Clinical Indicator Diseases Antenatal testing

44
Results Factors associated with transmission (Univariate*) FactorRate Ratio95% CIp-value Viral Load (per log 10 increase) 2.381.82 - 3.110.0001 Recent Infection4.031.88 - 8.680.0004 STI during interval12.536.13 - 25.64 0.0001 Age (per 5 years older)0.510.41 - 0.650.0001 On HAART0.040.01 - 0.190.0001 *Poisson Regression Model No association with CD4 count, AIDS diagnoses or calendar year of diagnosis
 FactorRate Ratio95% CIp-value Viral Load (per log 10 increase) Recent Infection STI during interval Age (per 5 years older) On HAART *Poisson Regression Model No association with CD4 count, AIDS diagnoses or calendar year of diagnosis")
45
Results Factors associated with transmission (Multivariate*) FactorRate Ratio95% CIp-value Viral Load (per log 10 increase) 1.681.19 - 2.360.003 Recent Infection3.431.52 - 7.730.003 STI during interval5.642.65 - 12.02 0.0001 Age (per 5 years older)0.680.54 - 0.850.0009 On HAART0.280.05 - 1.440.13 *Poisson Regression Model - variables in model include calendar year as well as those above
 FactorRate Ratio95% CIp-value Viral Load (per log 10 increase) Recent Infection STI during interval Age (per 5 years older) On HAART *Poisson Regression Model - variables in model include calendar year as well as those above")
46
(based on math. Model by Wilson et al.) Garnett &Gazzard, The Lancet, 27.7.2008, editorialcomment In serodiscordant male couple after 100 anal contacts Swiss statement challenged confirmed
 Garnett &Gazzard, The Lancet, , editorialcomment In serodiscordant male couple after 100 anal contacts Swiss statement challenged confirmed.")
47
What else can we do? Partner notification - better targeting (multi-disciplinary) Motivational interviewing and beyond More sophisticated behavioural research Build the evidence base for HA intervention
 Motivational interviewing and beyond More sophisticated behavioural research Build the evidence base for HA intervention.")
48
“We don’t know what it is, but we do know it’s contagious” A shift from The Good Old Days…

49
To a (truly) new paradigm… "We can't solve problems by using the same kind of thinking we used when we created them.” Albert Einstein
 new paradigm… We can t solve problems by using the same kind of thinking we used when we created them. Albert Einstein")
50
HAPPE N Thank you for listening and Enjoy your conference!

51
Acknowledgements Brighton and Sussex University Hospitals Martin Fisher, Gill Dean, Kate Nambiar, Stuart Tilbury, Denis McElborough, Gary Homer, Darshan Sudarshi, staff and patients of the Lawson Unit University College and Royal Free Hospitals Medical School, London Deenan Pillay, Caroline Sabin, Noel Gill Health Protection Agency, Colindale, London, UK John Parry, Alison Brown, Gary Murphy, Andrew Buckton, Pat Cane

Similar presentations


 has transformed treatment of HIV infection The benefits of early diagnosis of HIV are well recognised - not offering.>")


 Public Health England London,>")

 for HIV and HCV: The evidence and modelling Peter Vickerman.>")


 Will it decrease undiagnosed infection? Jonathan Roberts Liaison Health Adviser Brighton & Sussex.>")


