Download presentation
Presentation is loading. Please wait.

2
2000 Figure 1 The Hallmarks of Cancer This illustration encompasses the six hallmark capabilities originally proposed in our 2000 perspective. The past decade has witnessed remarkable progress toward understanding the mechanistic underpinnings of each hallmark... Douglas Hanahan , Robert A. Weinberg Hallmarks of Cancer: The Next Generation Cell Volume 144, Issue

3
2011 Figure 3 Emerging Hallmarks and Enabling Characteristics An increasing body of research suggests that two additional hallmarks of cancer are involved in the pathogenesis of some and perhaps all cancers. One involves the capability to modify, or reprogram,... Douglas Hanahan , Robert A. Weinberg Hallmarks of Cancer: The Next Generation Cell Volume 144, Issue

4
Figure 6 Therapeutic Targeting of the Hallmarks of Cancer Drugs that interfere with each of the acquired capabilities necessary for tumor growth and progression have been developed and are in clinical trials or in some cases approved for clinical use in t...

5
La cellula tumorale acquisisce queste caratteristiche mediante
mutazioni alterazioni epigenetiche in un processo mutagenico multi-step

6
Mutazioni Mutazioni puntiformi Brevi inserzioni/delezioni CNA (copy number abnormalities): gain, loss, amplificazioni Aberrazioni cromosomiche bilanciate: traslocazioni, inversioni

7
Mutazioni di oncogeni:
gain-of-function, amplificazione, e/o iperespressione Mutazioni di oncosoppressori: loss-of-function, delezione, e/o silenziamento epigenetico

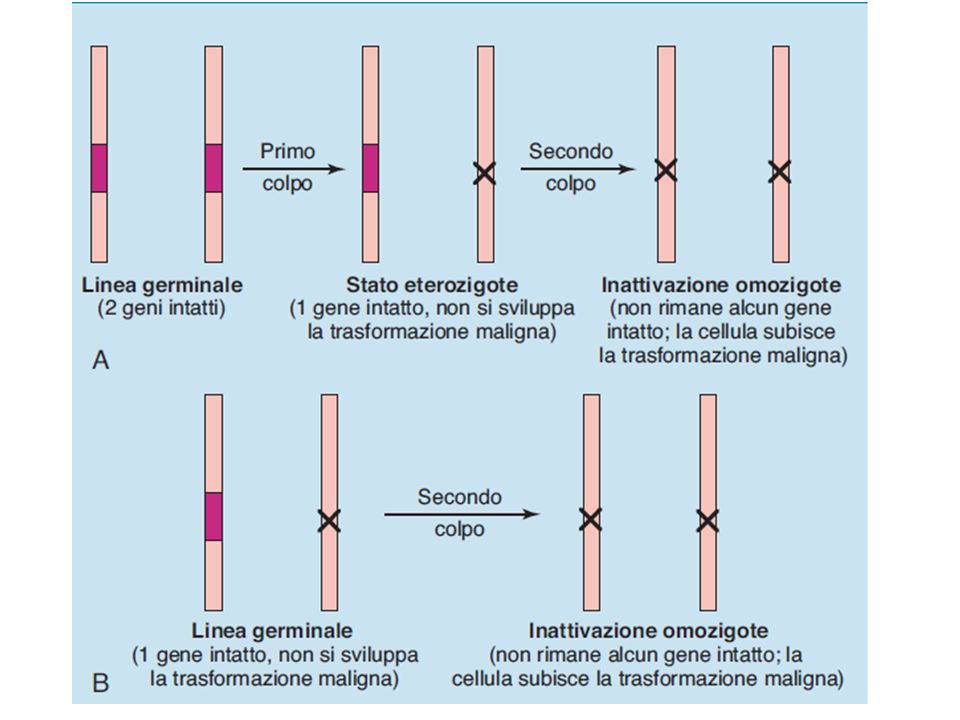
11
Teoria della selezione clonale

12
Eterogeneità clonale Più cloni (derivati da una unica cellula di origine del tumore, ma caratterizzati da eterogeneità genetica) possono coesistere contemporaneamente nella massa tumorale
 possono coesistere contemporaneamente nella massa tumorale.")
13
Colorectal Cancer TUMOR MUCOSA

14
Intratumor heterogeneity by double-sampling data
Mean of correlation coefficient in 18 double sampling pairs Within pairs 0.75 Between pairs 0.19 0.8

17
Computational Biology Program, Memorial Sloan-Kettering Cancer Center, New York, USA.
The Cancer Genome Atlas (TCGA) project was started in 2006 with the goal of collecting and profiling over 10,000 tumor samples from at least 20 tumor types. Half of these studies have been completed so far. The globally coordinated International Cancer Genome Consortium (ICGC), of which TCGA is a member, will add thousands more samples and additional tumor types
 project was started in 2006 with the goal of collecting and profiling over 10,000 tumor samples from at least 20 tumor types. Half of these studies have been completed so far. The globally coordinated International Cancer Genome Consortium (ICGC), of which TCGA is a member, will add thousands more samples and additional tumor types.")
18
Selected Functional Events (SFEs).
In total, we selected 479 candidate functional alterations, including 116 copy number gains, 151 copy number losses, 199 recurrently mutated genes and 13 epigenetically silenced genes.

19
The cancer genome hyperbola
The distribution of SFEs in tumors indicates that the number of copy number alterations in a sample (x axis) is approximately anticorrelated with the number of somatic mutations in a sample (y axis).
 is approximately anticorrelated with the number of somatic mutations in a sample (y axis).")
20
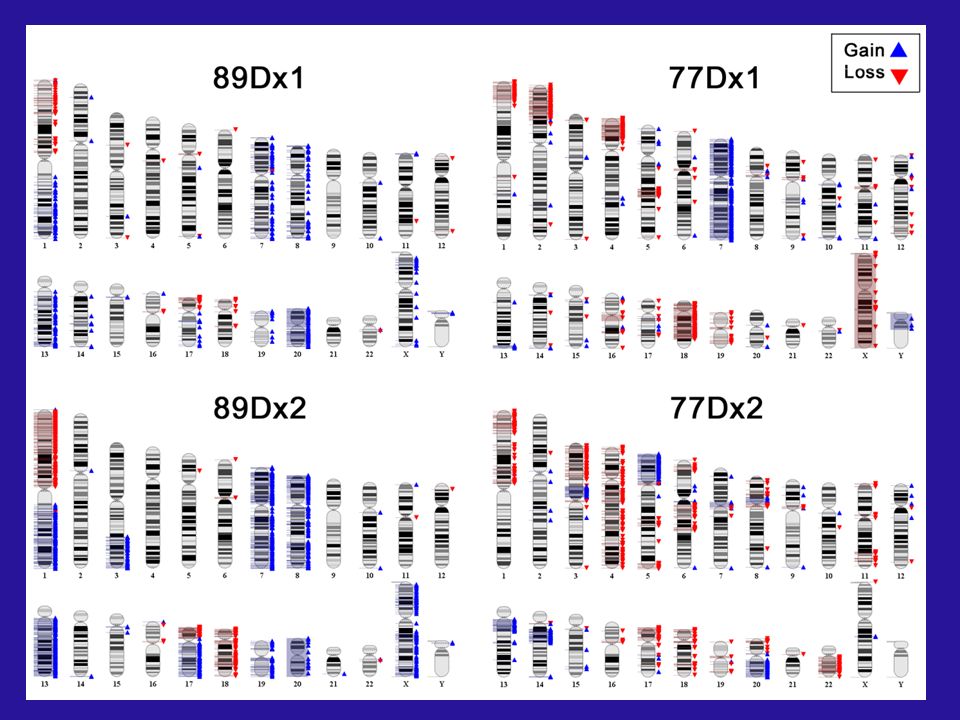
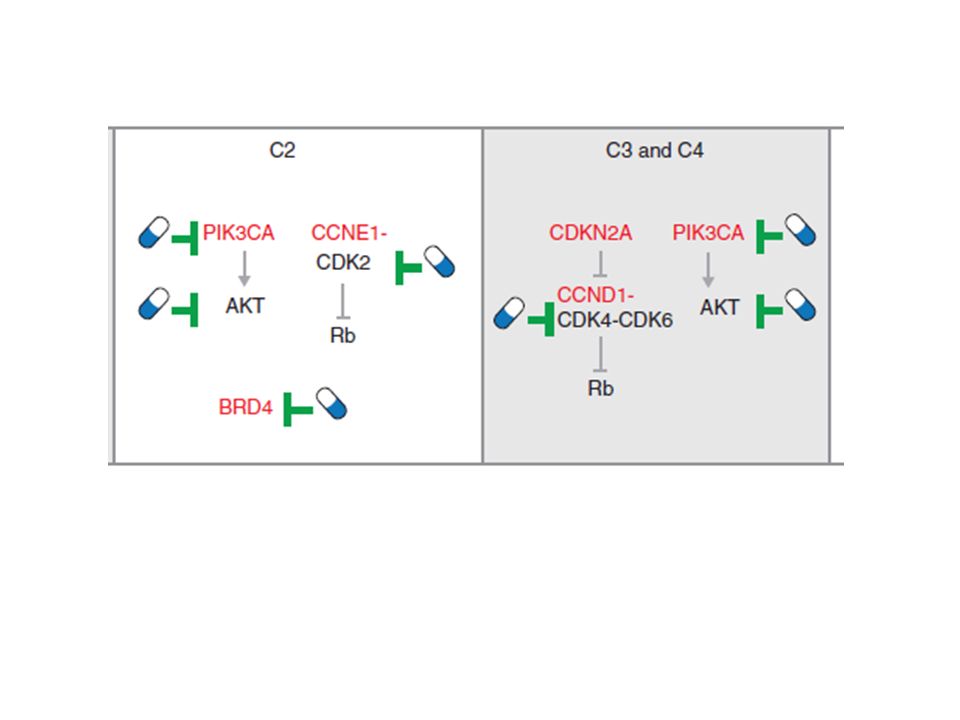
The M class We identified 17 subclasses (M1–M17). These subclasses had alterations in distinct oncogenic pathways, with alterations of phosphatidylinositol 3-kinase (PI3K)-AKT signaling characterizing the first main subclass (M1–M8) and with APC, TP53 and KRAS mutations most prominent in the second subclass (M9–M14). The C class Overall hierarchical subdivision of the C class led to a first major partition into two groups, primarily determined by the absence (subclasses C1–C6) or presence (subclasses C7–C14) of gains and losses on chromosome 8. Inactivation of TP53, MYC-driven proliferation and dysregulated cell cycle checkpoints as the hallmarks of the C class of tumors, which is dominated by recurrent copy number changes
-AKT signaling characterizing the first main subclass (M1–M8) and with APC, TP53 and KRAS mutations most prominent in the second subclass (M9–M14). The C class. Overall hierarchical subdivision of the C class led to a first major partition into two groups, primarily determined by the absence (subclasses C1–C6) or presence (subclasses C7–C14) of gains and losses on chromosome 8. Inactivation of TP53, MYC-driven proliferation and dysregulated cell cycle checkpoints as the hallmarks of the C class of tumors, which is dominated by recurrent copy number changes.")
23
We separated cases (84%) with a mutation rate of < 8
We separated cases (84%) with a mutation rate of < 8.24 per 106 and those with mutation rates of >12 per 106 (median number of total mutations 728), which we designated as hypermutated
 with a mutation rate of < 8.24 per 106 and those with mutation rates of >12 per 106 (median number of total mutations 728), which we designated as hypermutated.")
24
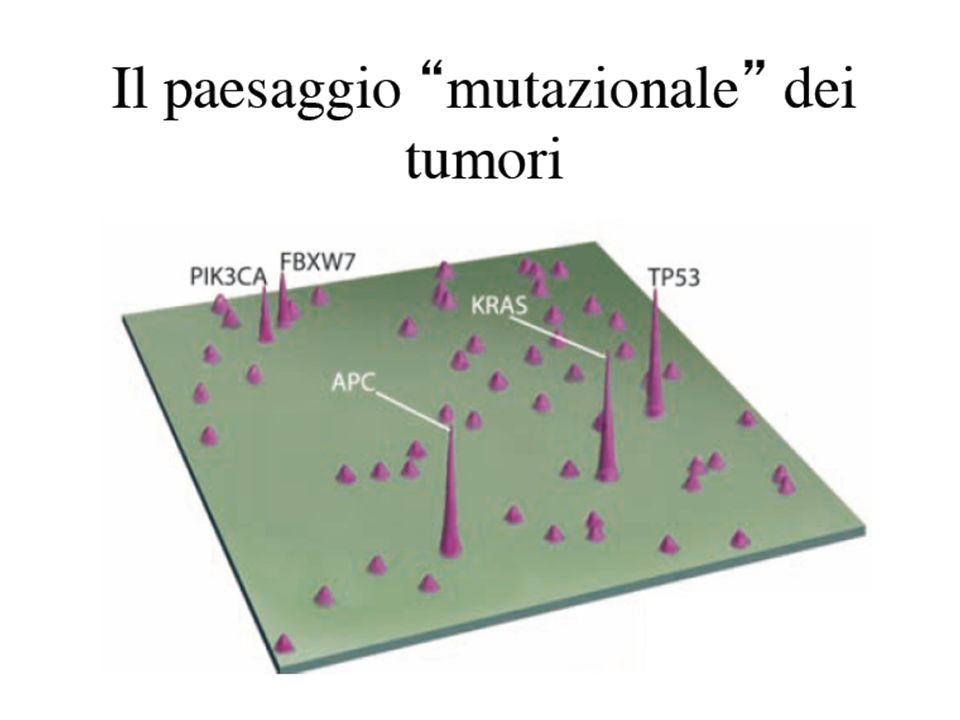
Mutazioni “driver” che portano a variazioni funzionali importanti per il fenotipo tumorale
Mutazioni “passenger” : neutrali, dovute all’instabilità del genoma delle cellule tumorali

27
Overall, we identified 32 somatic recurrently mutated genes in the hypermutated and nonhypermutated cancers. After removal of non-expressed genes, there were 15 and 17 in the hypermutated and non-hypermutated cancers, respectively

31
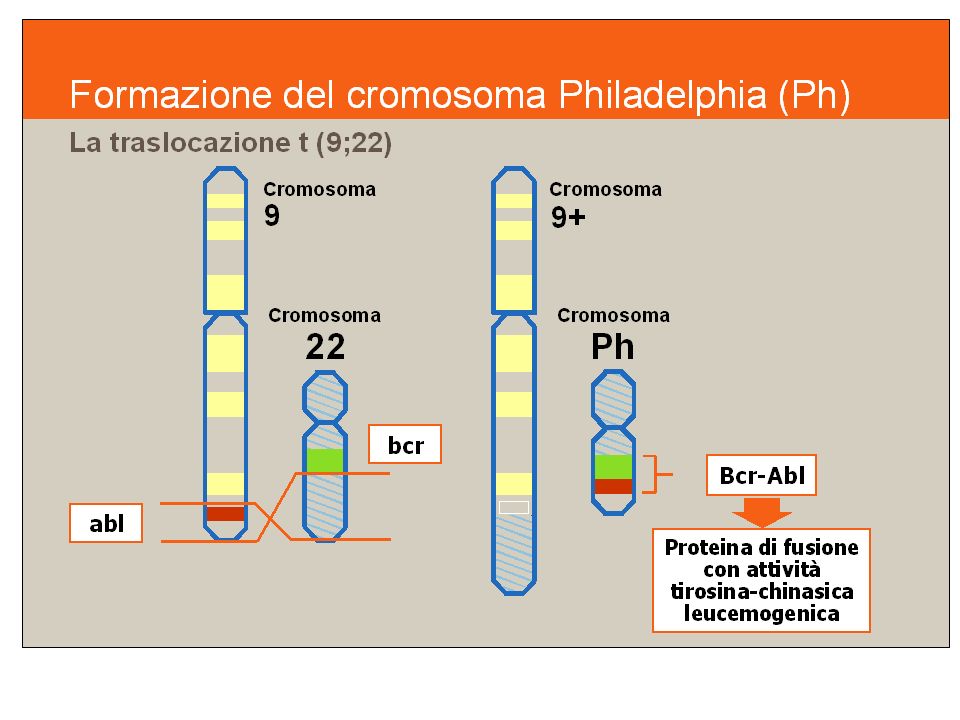
Janet Davison Rowley (born April 5, 1925) the first scientist to identify a chromosomal translocation as the cause of leukemia and other cancers.
 the first scientist to identify a chromosomal translocation as the cause of leukemia and other cancers.")
33
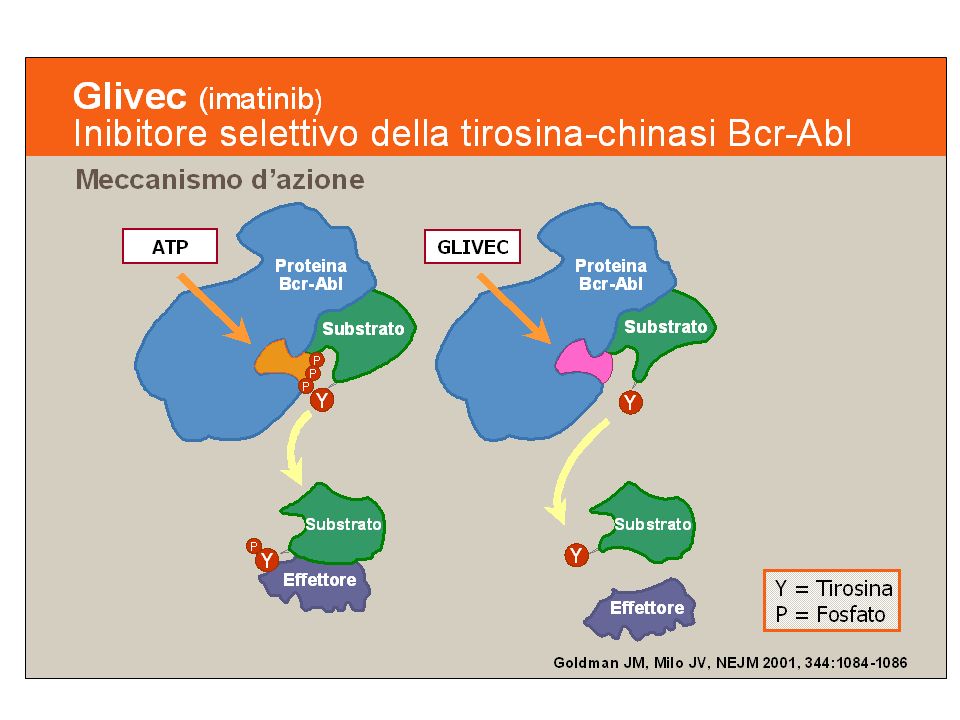
The constitutive TK activity of BCR-ABL is
the primary factor causing the expansion of the Ph-positive clone Autophosphorylation by dimerization ABL ABL Tyr Tyr BCR BCR Phosphorylation of substrates P

34
1. Activation of proliferation
General overview RAS JAK-STAT 1. Activation of proliferation MYC BCR/ABL Paxillin F-actin 2. Changes in adhesion to stromal layer NUCLEUS 3- Inhibition of apoptosis PIK3 -AKT Cell Cycle

37
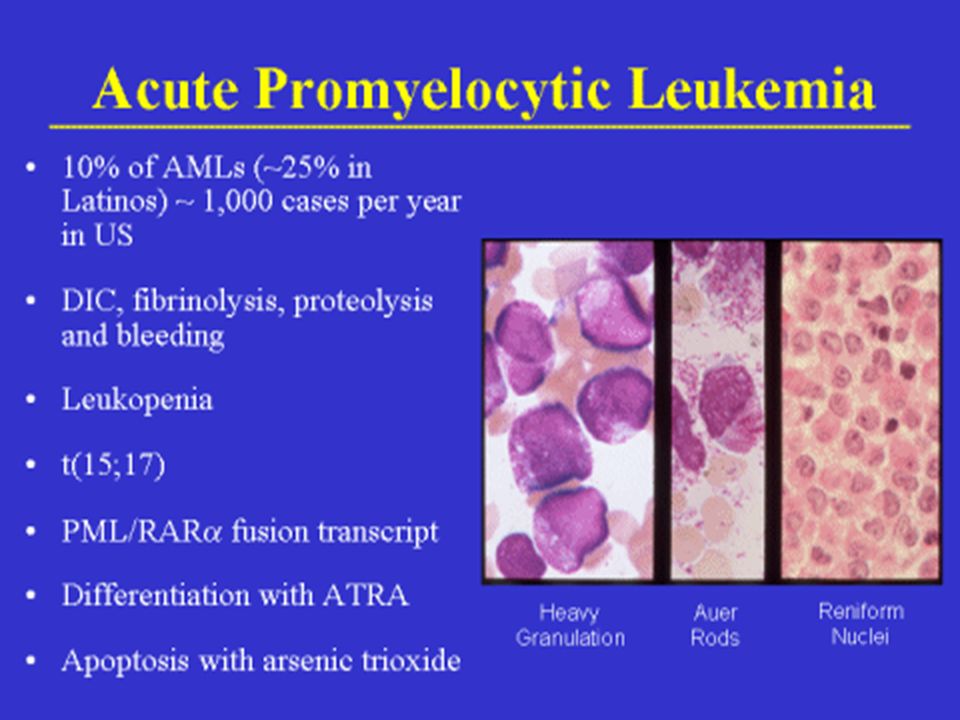
LEUCEMIA PROMIELOCITICA ACUTA

38
Role of transcription factors involved in promyelocytic acute leukemia
PML RAR a Apoptosis Terminal myeloid differentiation (via p53 and/or Rb) PML RAR a Oncogenesis
 PML. RAR. a. Oncogenesis.")
Similar presentations


 catalogue genetic mutations responsible for cancer, using genome sequencing and bioinformatics The TCGA is sequencing the.>")


 are a class of small RNA molecules, about ~21 nucleotide (nt) long. MicroRNA are small non coding RNAs (ncRNAs) that regulate.>")

