Download presentation
Presentation is loading. Please wait.

1
Why Grade Recommendations? strong recommendationsstrong recommendations –strong methods –large precise effect –few down sides of therapy weak recommendationsweak recommendations –weak methods – imprecise estimate – small effect – substantial down sides

2
Why Grade Recommendations? strong recommendationstrong recommendation –one size fits all –expect uniform clinician behavior weaker recommendationweaker recommendation –expect action to vary

3
An ideal grading system simplesimple clear separation of two issuesclear separation of two issues –evidence weak or strong? methodological quality of evidencemethodological quality of evidence likelihood of biaslikelihood of bias –recommendation weak or strong trade-off between benefits and riskstrade-off between benefits and risks

4
Which grading system to use? many availablemany available –Australian National and MRC –Oxford Center for Evidence-based Medicine –Scottish Intercollegiate Guidelines (SIGN) –US Preventative Services Task Force –American Heart Association conflict of interest (point of view)conflict of interest (point of view) –American College of Chest Physicians –international group led by Andy Oxman Australian NMRC, SIGN, USPSTF, WHO, NICE, Oxford CEBM, CDC, CCAustralian NMRC, SIGN, USPSTF, WHO, NICE, Oxford CEBM, CDC, CC
 –US Preventative Services Task Force –American Heart Association conflict of interest (point of view)conflict of interest (point of view) –American College of Chest Physicians –international group led by Andy Oxman Australian NMRC, SIGN, USPSTF, WHO, NICE, Oxford CEBM, CDC, CCAustralian NMRC, SIGN, USPSTF, WHO, NICE, Oxford CEBM, CDC, CC.")
5
Evidence weak or strong? study designstudy design –basic –detailed design and execution consistencyconsistency directnessdirectness reporting biasreporting bias

6
Methodological Quality study designstudy design –randomization –quasi-randomization –observational study detailed design and executiondetailed design and execution –concealment –balance in known prognostic factors –intention to treat principle observed –blinding –completeness of follow-up

7
Consistency evidence weaker if results differevidence weaker if results differ if inconsistency, look for explanationif inconsistency, look for explanation –patients –intervention – outcome –methods

8
Relative Risk of Conversion to Sinus Rhythm Amiodarone vs Placebo or Digoxin or CCB Favours Control Favours Amiodarone ' ' ' ' ' ' ' ' ' ' ' ' ' ' ' ' ' ' ' ' ' Cowan 1986 1.11 (0.78 to 1.58) Noc 1990 18.0 (1.17 to 276) Capucci 1992 0.77 (0.37 to 1.62) Cochrane 1994 1.15 (0.91 to 1.44) Donovan 1995 1.05 (0.69 to 1.60) Hou 1995 1.29 (0.97 to 1.72) Kondili 1995 1.33 (0.71 to 2.47) Galve 1996 1.13 (0.84 to 1.52) Kontoyannis 1998 1.42 (1.08 to 1.85) Bellandi 1999 1.41 (1.15 to 1.72) Cotter 1999 1.43 (1.15 to 1.80) Kochiadakis 1999 1.46 (1.19 to 1.78) Bianconi 2000 2.04 (0.19 to 22.00) Galperin 2000 33.70 (2.08 to 546) Hohnloser 2000 3.13 (1.50 to 6.70) Joseph 2000 1.32 (0.95 to 1.80) Natale 2000 5.12 (2.60 to 10.00) Peukurinen 2000 2.45 (1.49 to 4.02) Vardas 2000 2.01 (1.55 to 2.60) Villani 2000 4.75 (1.60 to 14.00) Cybulski 2001 1.87 (1.37 to 2.55) 0.1110100 n = 83 n = 95 n = 203 n = 85 n = 120 n = 34 n = 24 n = 40 n = 30 n = 64 n = 39 n = 42 n = 100 n = 42 n = 120 n = 100 n = 204 n = 75 n = 62 n = 208 n = 160
 Noc (1.17 to 276) Capucci (0.37 to 1.62) Cochrane (0.91 to 1.44) Donovan (0.69 to 1.60) Hou (0.97 to 1.72) Kondili (0.71 to 2.47) Galve (0.84 to 1.52) Kontoyannis (1.08 to 1.85) Bellandi (1.15 to 1.72) Cotter (1.15 to 1.80) Kochiadakis (1.19 to 1.78) Bianconi (0.19 to 22.00) Galperin (2.08 to 546) Hohnloser (1.50 to 6.70) Joseph (0.95 to 1.80) Natale (2.60 to 10.00) Peukurinen (1.49 to 4.02) Vardas (1.55 to 2.60) Villani (1.60 to 14.00) Cybulski (1.37 to 2.55) n = 83 n = 95 n = 203 n = 85 n = 120 n = 34 n = 24 n = 40 n = 30 n = 64 n = 39 n = 42 n = 100 n = 42 n = 120 n = 100 n = 204 n = 75 n = 62 n = 208 n = 160")
9
Relative Risk of Conversion to Sinus Rhythm Amiodarone vsPlacebo orDigoxinor CCB FavoursControlFavours Amiodarone ' ' ' ' ' ' ' ' ' ' ' ' ' ' ' ' ' ' ' ' ' ' Bianconi2000 2.04 (0.19 to 22.00) Galperin2000 33.70 (2.08 to 546) Hohnloser2000 3.13 (1.50 to 6.70) Natale2000 5.12 (2.60 to 10.00) Villani2000 4.75 (1.60 to 14.00) Pooled Estimate 4.33 (2.76 to 6.77) Cowan 1986 1.11 (0.78 to 1.58) Noc1990 18.0 (1.17 to 276) Capucci1992 0.77 (0.37 to 1.62) Cochrane1994 1.15 (0.91 to 1.44) Donovan 1995 1.05 (0.69 to 1.60) Hou1995 1.29 (0.97 to 1.72) Kondili1995 1.33 (0.71 to 2.47) Galve1996 1.13 (0.84 to 1.52) Kontoyannis1998 1.42 (1.08 to 1.85) Bellandi1999 1.41 (1.15 to 1.72) Cotter 1999 1.43 (1.15 to 1.80) Kochiadakis1999 1.46 (1.19 to 1.78) Joseph 2000 1.32 (0.95 to 1.80) Peukurinen2000 2.45 (1.49 to 4.02) Vardas2000 2.01 (1.55 to 2.60) Cybulski2001 1.87 (1.37 to 2.55) Pooled Estimate 1.40 (1.25 to 1.57) 0.1110100 AF Duration > 48 hrs AF Duration =/< 48 hrs n = 83 n = 95 n = 203 n = 85 n = 120 n = 34 n = 24 n = 40 n = 30 n = 64 n = 39 n = 42 n = 100 n = 42 n = 120 n = 100 n = 204 n = 75 n = 62 n = 208 n = 160 '
 Galperin (2.08 to 546) Hohnloser (1.50 to 6.70) Natale (2.60 to 10.00) Villani (1.60 to 14.00) Pooled Estimate 4.33 (2.76 to 6.77) Cowan (0.78 to 1.58) Noc (1.17 to 276) Capucci (0.37 to 1.62) Cochrane (0.91 to 1.44) Donovan (0.69 to 1.60) Hou (0.97 to 1.72) Kondili (0.71 to 2.47) Galve (0.84 to 1.52) Kontoyannis (1.08 to 1.85) Bellandi (1.15 to 1.72) Cotter (1.15 to 1.80) Kochiadakis (1.19 to 1.78) Joseph (0.95 to 1.80) Peukurinen (1.49 to 4.02) Vardas (1.55 to 2.60) Cybulski (1.37 to 2.55) Pooled Estimate 1.40 (1.25 to 1.57) AF Duration > 48 hrs AF Duration =/< 48 hrs n = 83 n = 95 n = 203 n = 85 n = 120 n = 34 n = 24 n = 40 n = 30 n = 64 n = 39 n = 42 n = 100 n = 42 n = 120 n = 100 n = 204 n = 75 n = 62 n = 208 n = 160")
10
Directness of Evidence indirect treatment comparisonsindirect treatment comparisons –interested in A versus B –have A versus C and B versus C alendronate vs risedronatealendronate vs risedronate –both versus placebo, no head-to-head

11
Who are the patients? If different, weaker evidence patients meet trials’ eligibility criteriapatients meet trials’ eligibility criteria minor question of directnessminor question of directness –slight age difference –comorbidity –race –closely related underlying condition valvular atrial fibrillationvalvular atrial fibrillation serious question about biologyserious question about biology –heart failure trials applicability to aortic stenosis

12
Interventions: if differ, weaker evidence identical interventionidentical intervention –captopril 100 mg minor question of directnessminor question of directness –captopril, lower dose –other ACE inhibitor serious question of biologyserious question of biology –angiotensin receptor blocker

13
Outcome differs, weaker evidence outcomes of direct interestoutcomes of direct interest –survival of long duration –valid measure of HRQL minor question of directnessminor question of directness –follow-up shorter than ideal –functional status measure serious question of biologyserious question of biology –short duration of follow-up –laboratory exercise capacity

14
Magnitude, Precision, Reporting Bias magnitude not generally part of qualitymagnitude not generally part of quality –but very large magnitude can upgrade precision not generally part of qualityprecision not generally part of quality –but sparse data can lower quality reporting biasreporting bias –high likelihood can lower quality

15
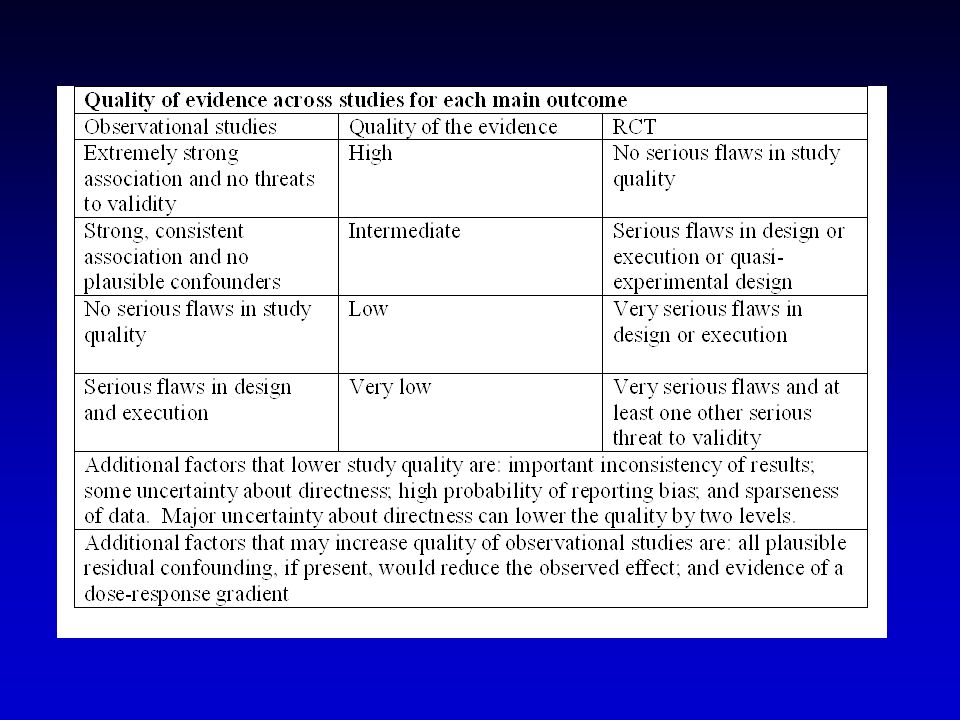
Grading System high qualitywell done RCThigh qualitywell done RCT intermediatequasi-RCTintermediatequasi-RCT lowwell done observationallowwell done observational insufficient anything elseinsufficient anything else

16
Moving Down study execution – –serious flaws can lower by one level – –fatal flaws can lower by two levels consistency – –important inconsistency can lower by one level directness of evidence – –some uncertainty re relevance lower by one level – –major uncertainty re relevance lower by two levels selection bias – –strong suspicion lower by 1 level

17
Moving Up extremely strong, consistent association; no plausible threats to validity, up 2 grades – –insulin in diabetic ketoacidosis strong, consistent association with no plausible confounders (or confounders would all reduce effect) up 1 grade – –investor-owned for-profit dialysis increases death rates in comparison to not-for-profit
 up 1 grade – –investor-owned for-profit dialysis increases death rates in comparison to not-for-profit")
19
Overall level of evidence most systems just use evidence about primary benefit outcomemost systems just use evidence about primary benefit outcome but what about others (risk)?but what about others (risk)? optionsoptions –ignore all but primary –weakest of any outcome –some blended approach –weakest of crucial outcomes

20
Risk/Benefit tradeoff aspirin after myocardial infarctionaspirin after myocardial infarction –25% reduction in relative risk –side effects minimal, cost minimal –benefit obviously much greater than risk/cost TPA vs streptokinase after MITPA vs streptokinase after MI –12% reduction in relative risk –increased rate of intracranial hemorrhage –large increase in cost –benefit vs risk/cost a judgment call

21
Strength of Recommendations Aspirin after MI – do it TPA rather than SK in MI -- probably do it -- probably don’t do it -- probably don’t do it

22
Grade of Recommendations do it or don’t do itdo it or don’t do it –strong recommendation probably do it, or probably don’tprobably do it, or probably don’t –weaker recommendation

23
Strong or Weak Recommendation? seriousness of outcomeseriousness of outcome magnitude of effectmagnitude of effect precision of treatment effectprecision of treatment effect risk of target eventrisk of target event risk of adverse eventsrisk of adverse events cost of therapycost of therapy values and preferencesvalues and preferences

24
Weak recommendation practice will varypractice will vary –according to what? interpretation of evidenceinterpretation of evidence –breast cancer patients’ values and preferencespatients’ values and preferences –atrial fibrillation inclination to gambleinclination to gamble –HRT

25
Grades Translations strong - 90% or more would make the same choicestrong - 90% or more would make the same choice weak - more than 10% would vary in choiceweak - more than 10% would vary in choice

26
How to represent grades? words onlywords only –recommendation strong or weakstrong or weak do it, probably do it, don’t do it, probably don’t do itdo it, probably do it, don’t do it, probably don’t do it –quality high, moderate, low, very low numbers and lettersnumbers and letters –recommendation 1 and 2 –quality A, B, C, D symbolssymbols – , ?, , ?

27
Conclusion challenges in gradingchallenges in grading –simple system –consider quality of evidence –consider benefit/risk tradeoff methodological quality of evidencemethodological quality of evidence –study design, execution, –consistency, directness –reporting bias balance of benefits and risks/costbalance of benefits and risks/cost –magnitude and precision of effects; –values and preferences

Similar presentations
 Training Modules for.>")


 Director of Evidence-Based Practice, Quality Management Assistant.>")
 Methodology.>")


 Working Group www.gradeworkinggroup.org.>")
 study To reviewers and moderators: These.>")


1 Lecture 17: Prevention of bias in RCTs Statistical/analytic issues in RCTs –Measures of effect –Precision/hypothesis testing.>")