Download presentation
Presentation is loading. Please wait.

1
Section 5 Control Charts

4
4 Control Chart Applications Establish state of statistical control Monitor a process and signal when it goes out of control Determine process capability

5
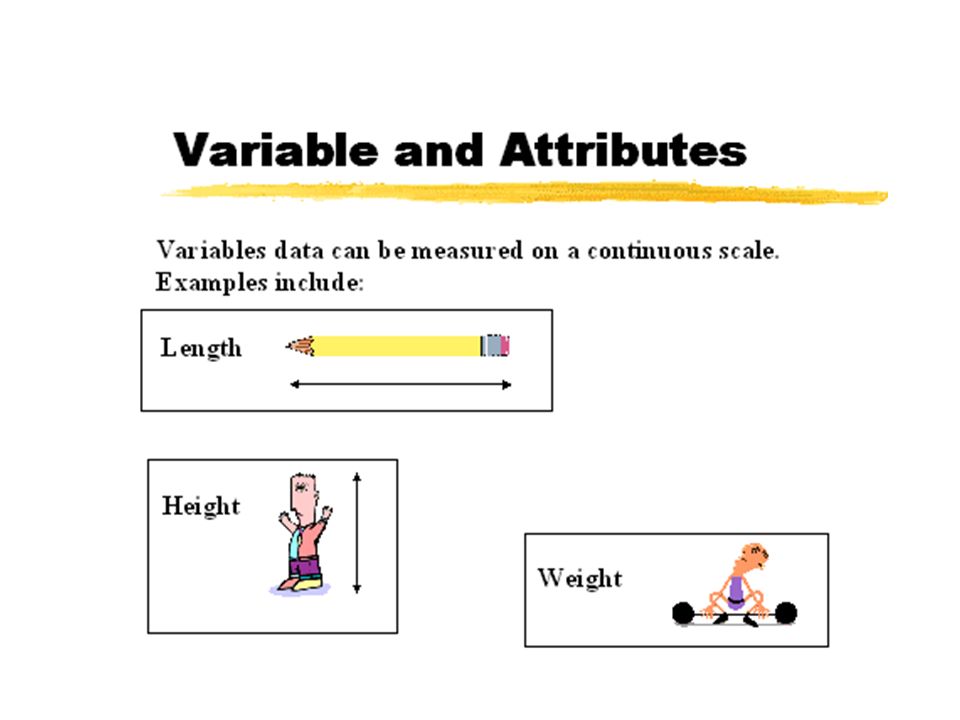
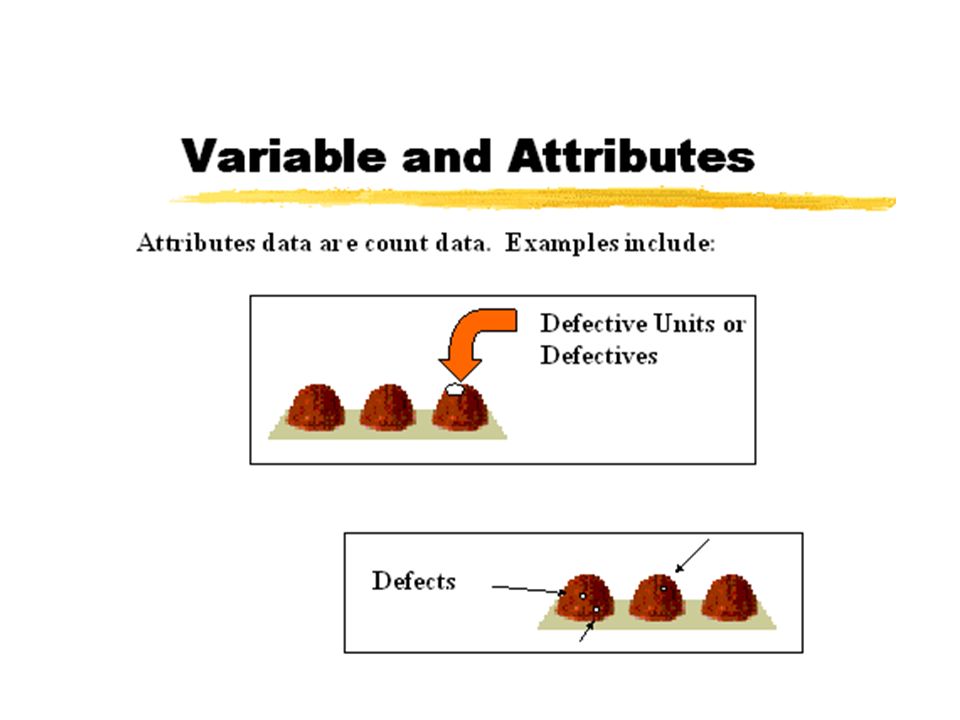
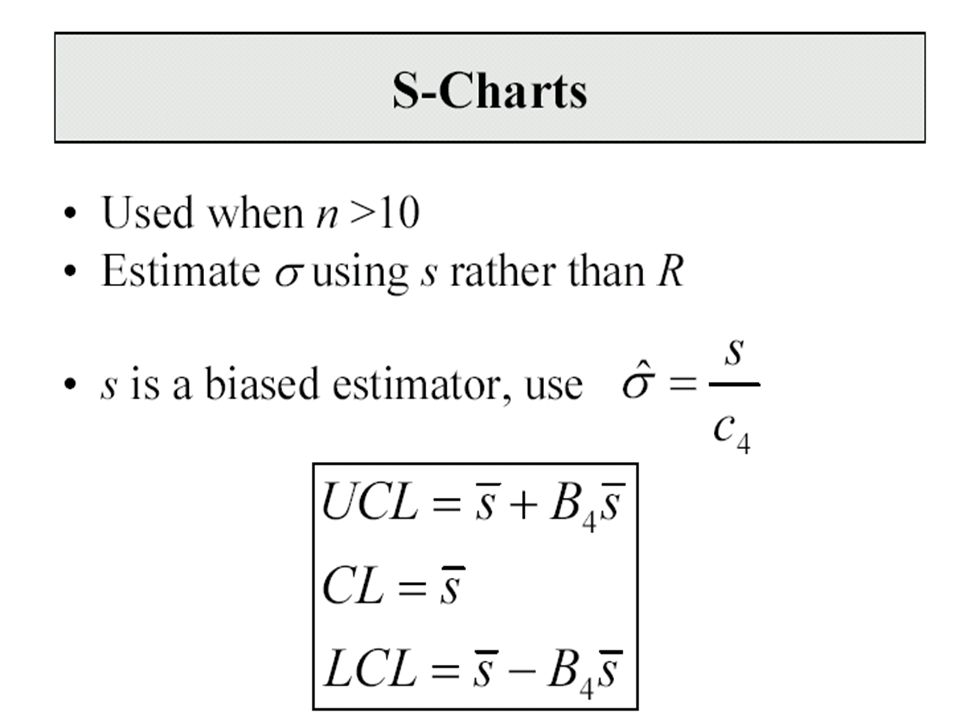
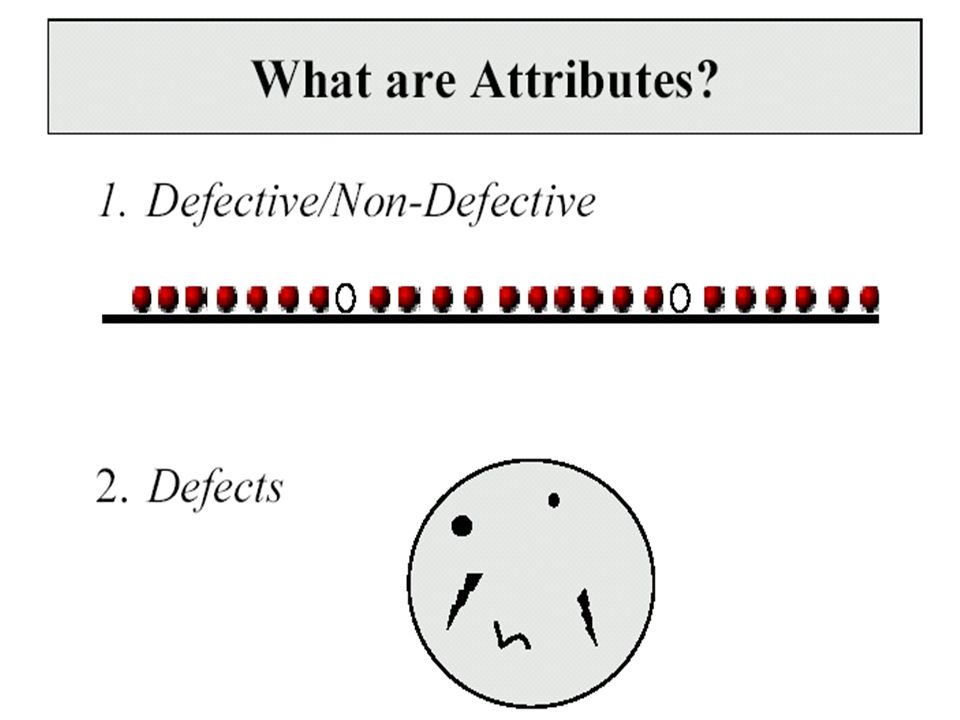
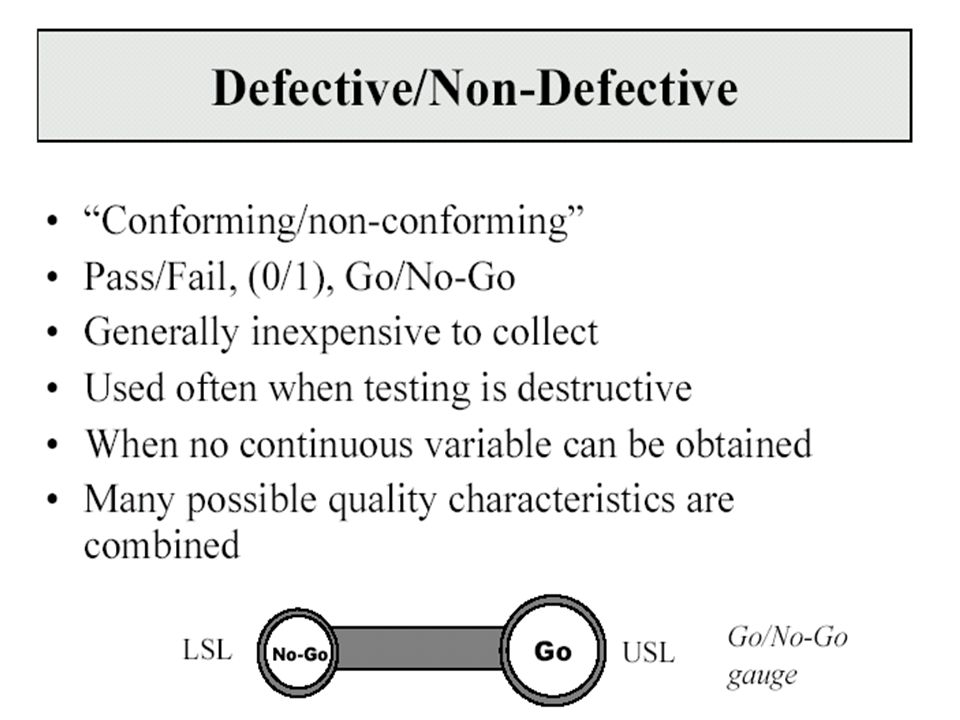
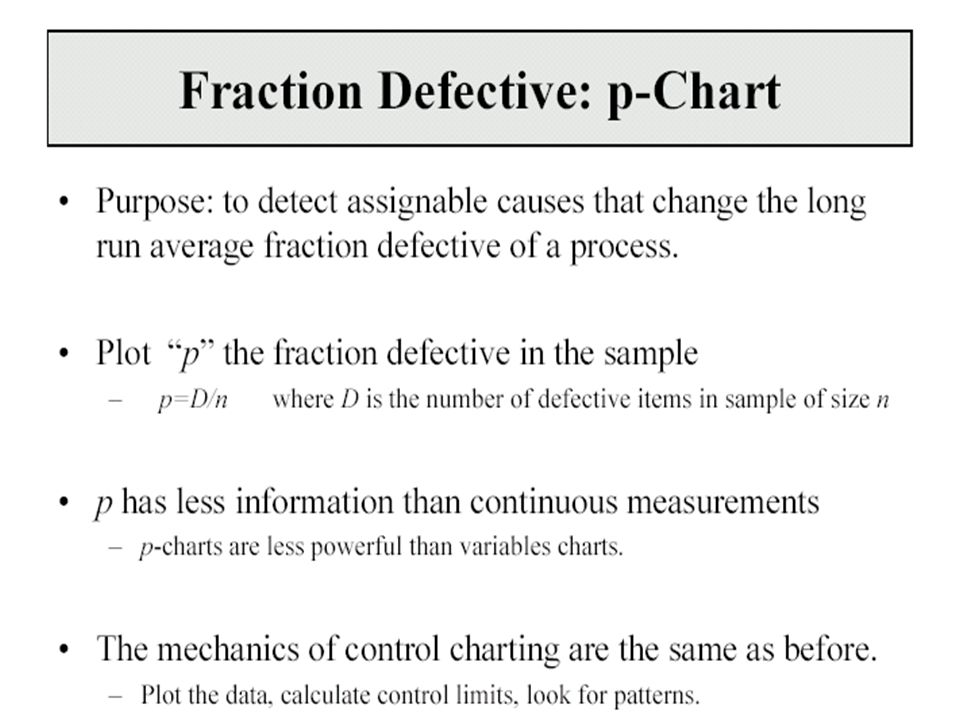
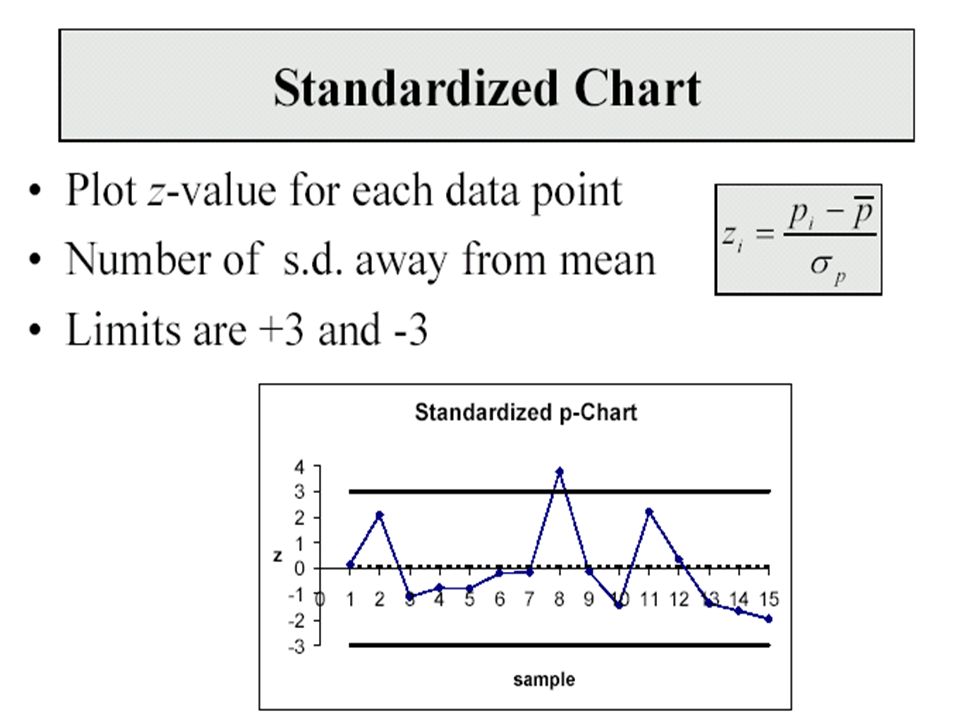
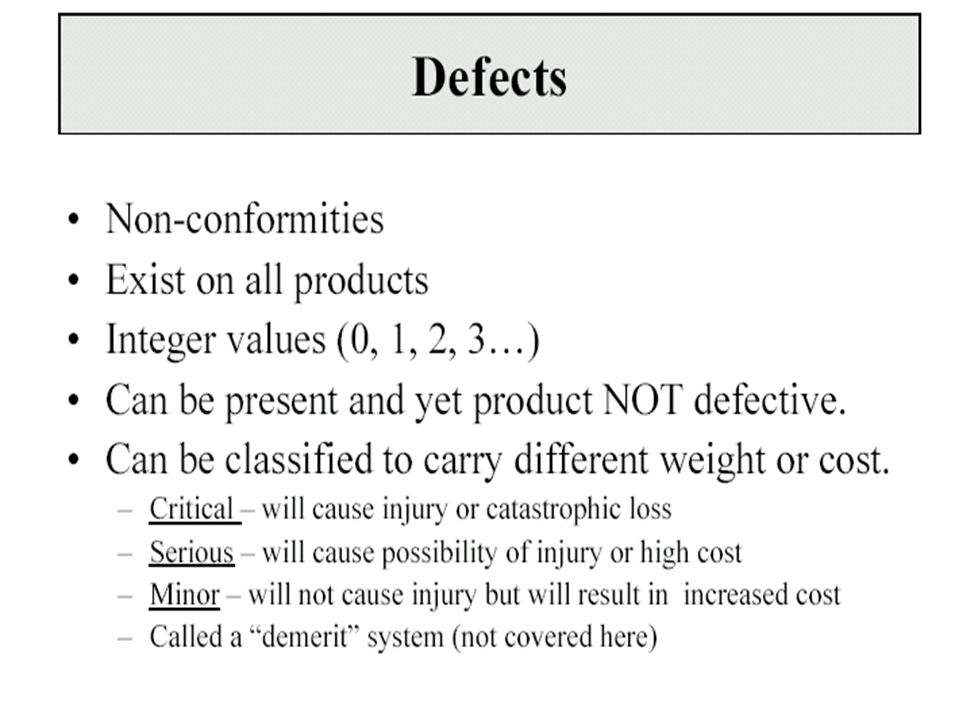
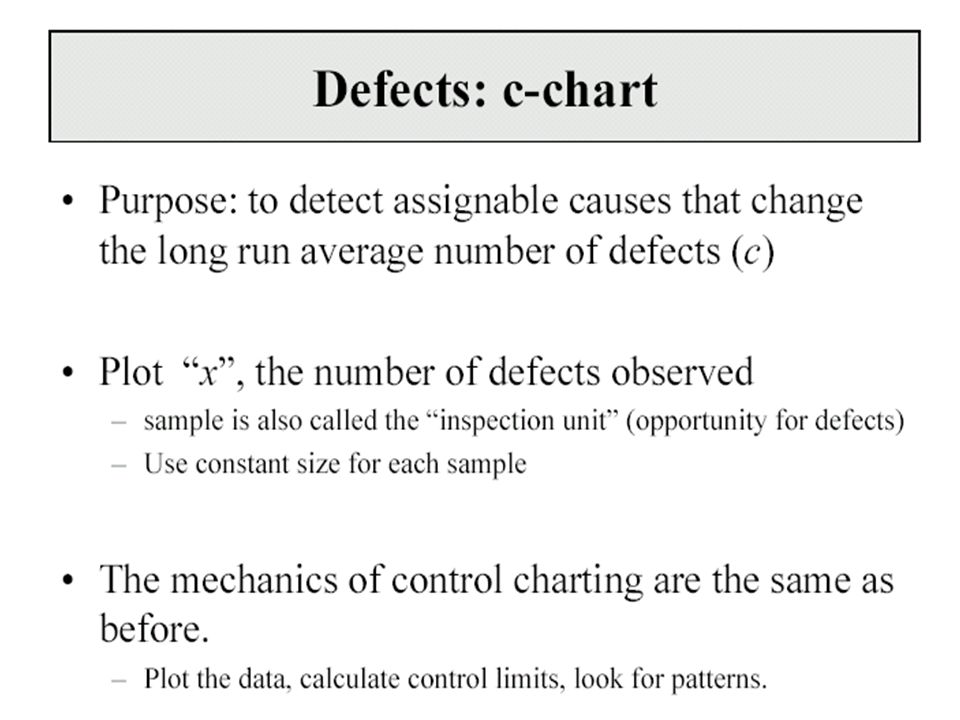
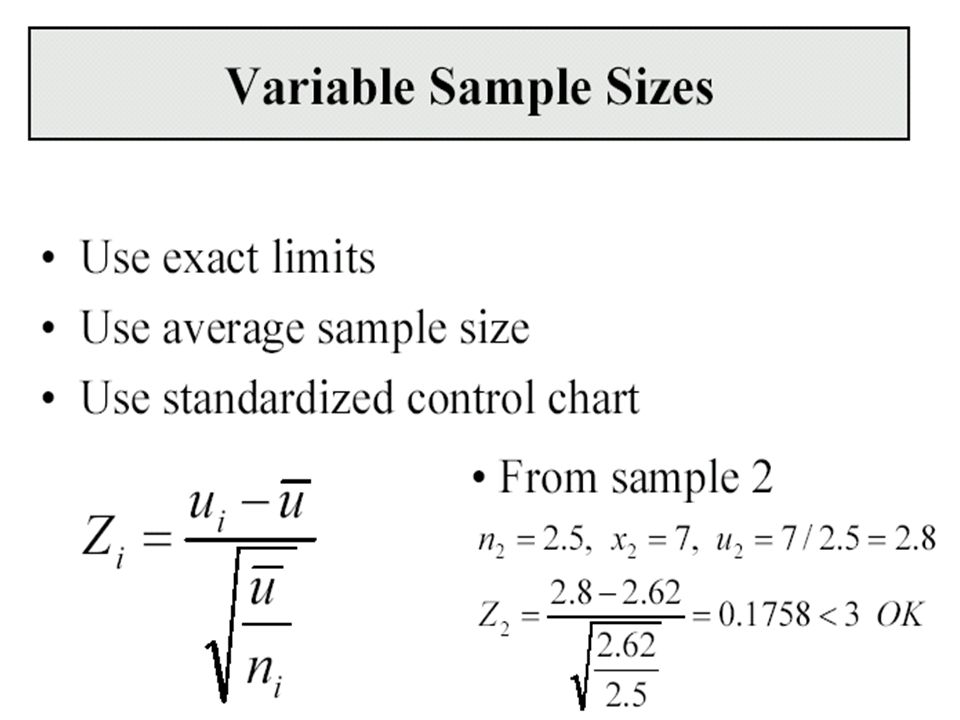
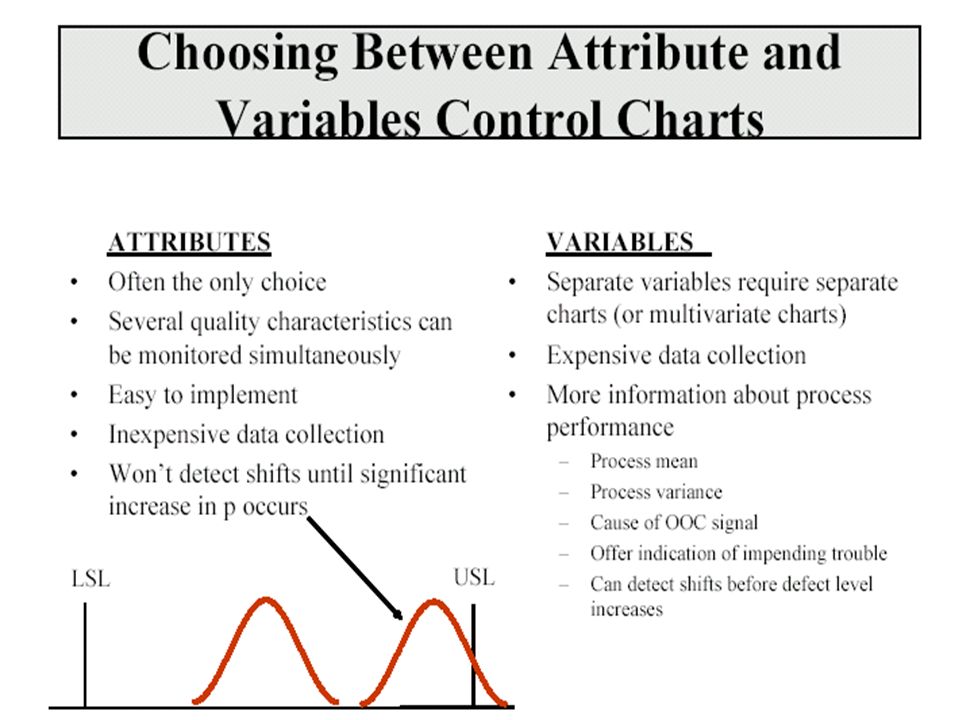
5 Commonly Used Control Charts Variables data –x-bar and R-charts –x-bar and s-charts –Charts for individuals (x-charts) Attribute data –For “defectives” (p-chart, np-chart) –For “defects” (c-chart, u-chart)
 Attribute data –For defectives (p-chart, np-chart) –For defects (c-chart, u-chart)")
6
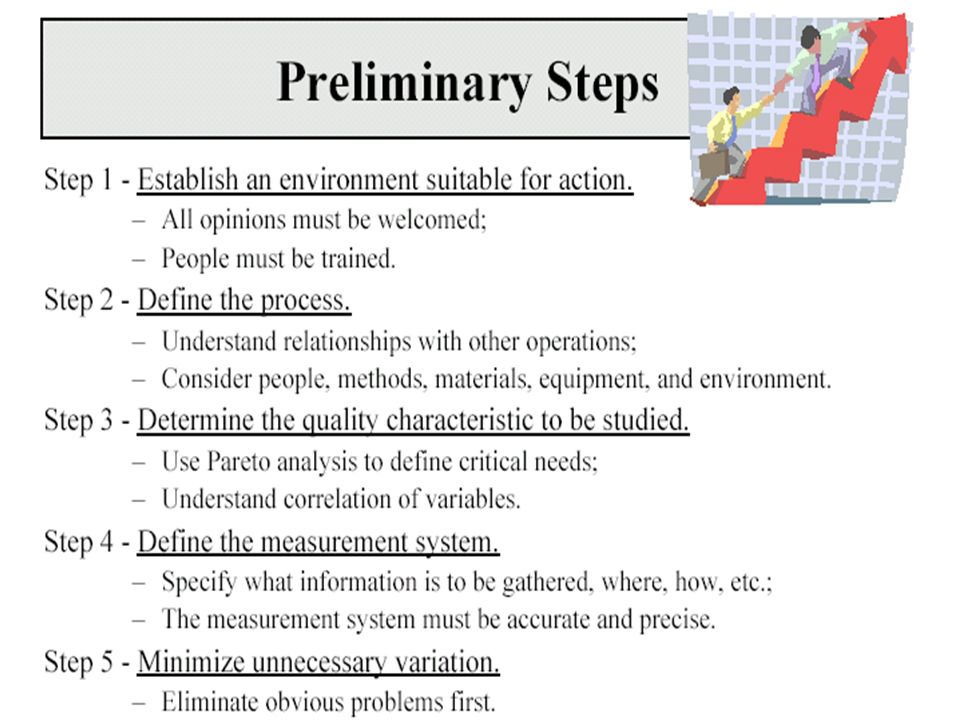
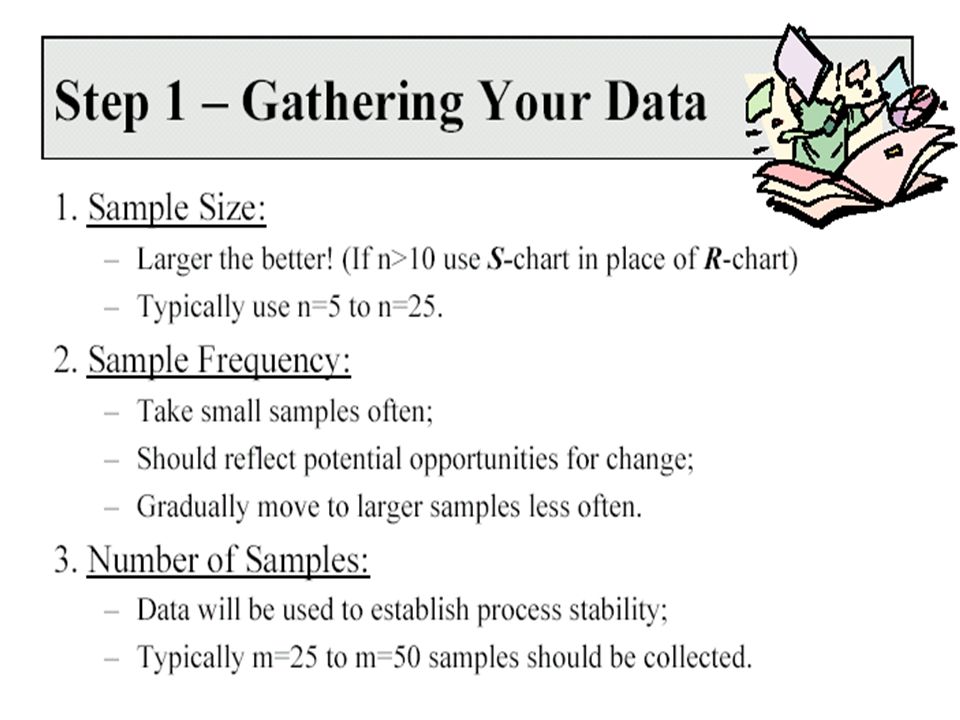
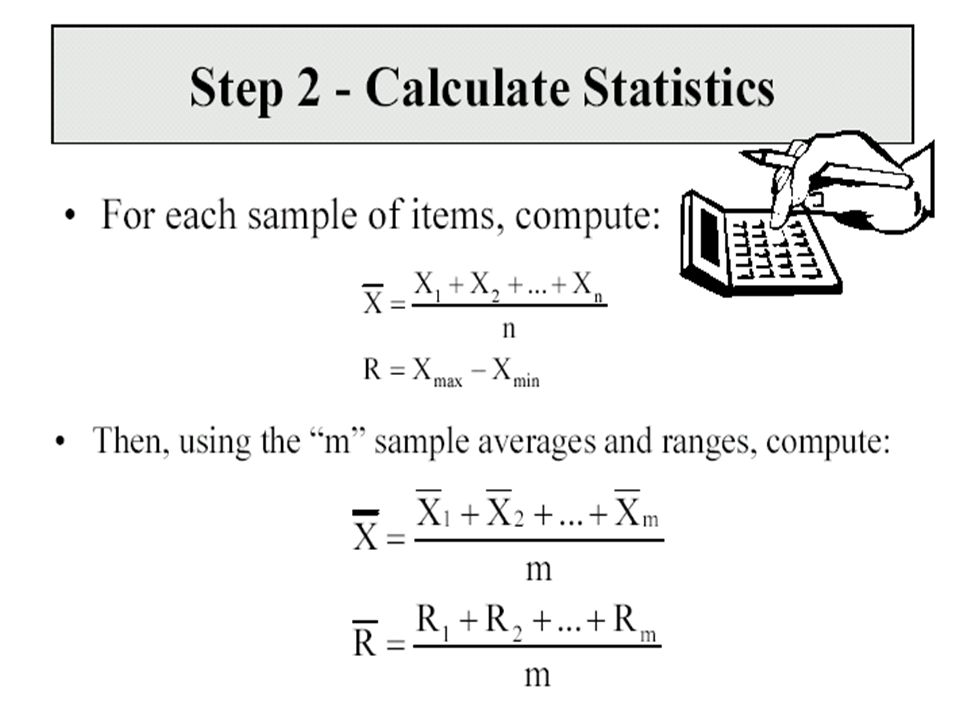
Developing Control Charts 1.Prepare –Choose measurement –Determine how to collect data, sample size, and frequency of sampling –Set up an initial control chart 2.Collect Data –Record data –Calculate appropriate statistics –Plot statistics on chart

8
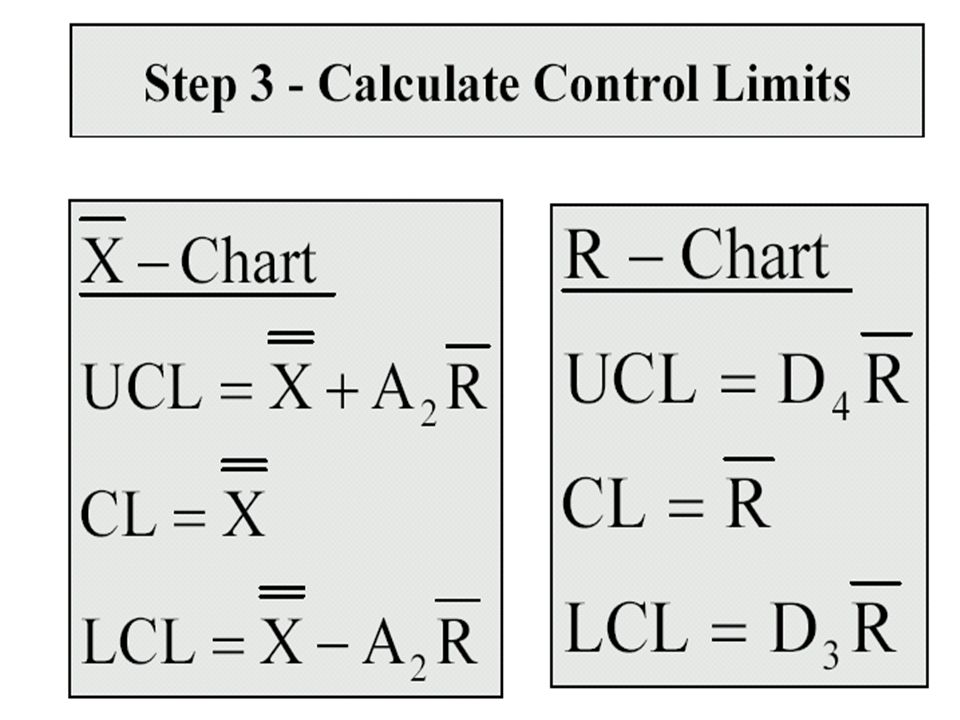
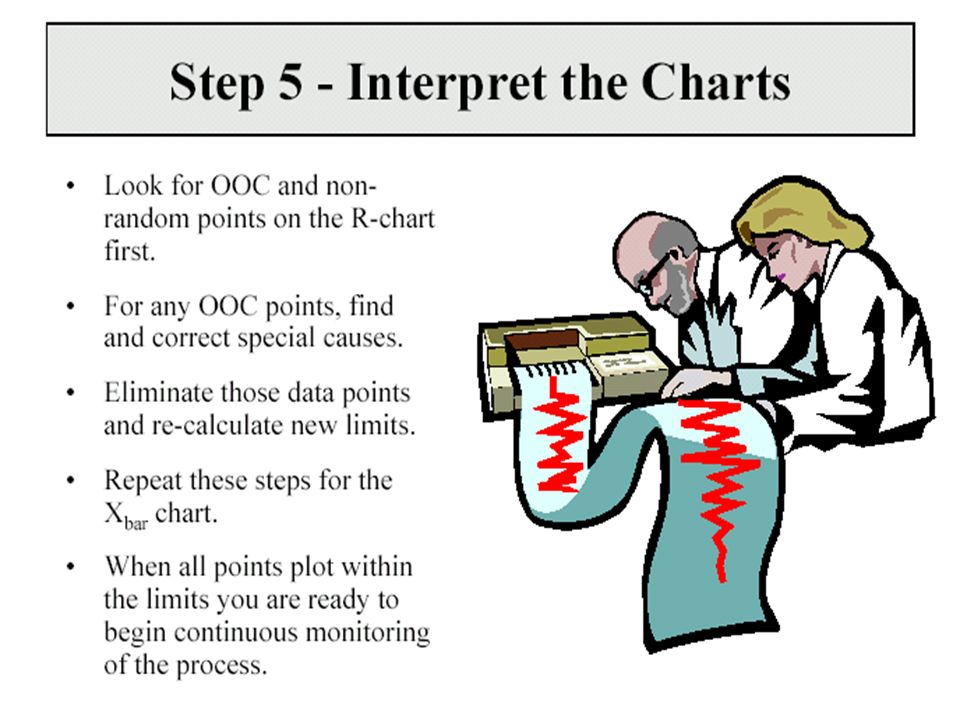
Next Steps 3.Determine trial control limits –Center line (process average) –Compute UCL, LCL 4.Analyze and interpret results –Determine if in control –Eliminate out-of-control points –Recompute control limits as necessary
 –Compute UCL, LCL 4.Analyze and interpret results –Determine if in control –Eliminate out-of-control points –Recompute control limits as necessary")
9
Final Steps 5.Use as a problem-solving tool –Continue to collect and plot data –Take corrective action when necessary 6.Compute process capability

10
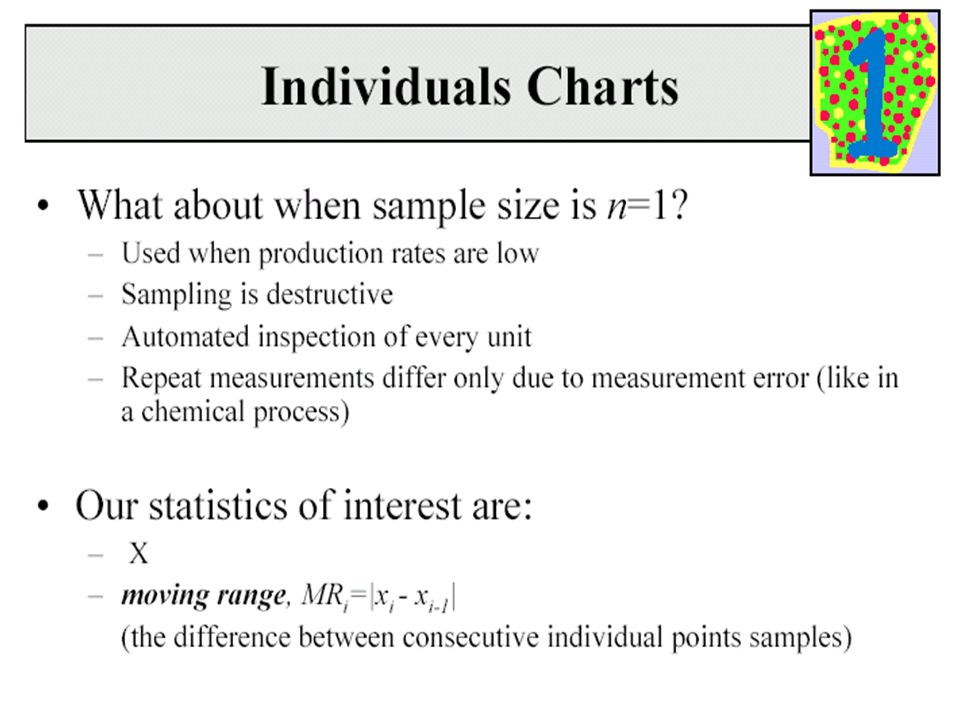
10 Control Chart Selection Quality Characteristic variableattribute n>1? n>=10 or computer? x and MR no yes x and s x and R no yes defectivedefect constant sample size? p-chart with variable sample size no p or np yes constant sampling unit? c u yesno

27
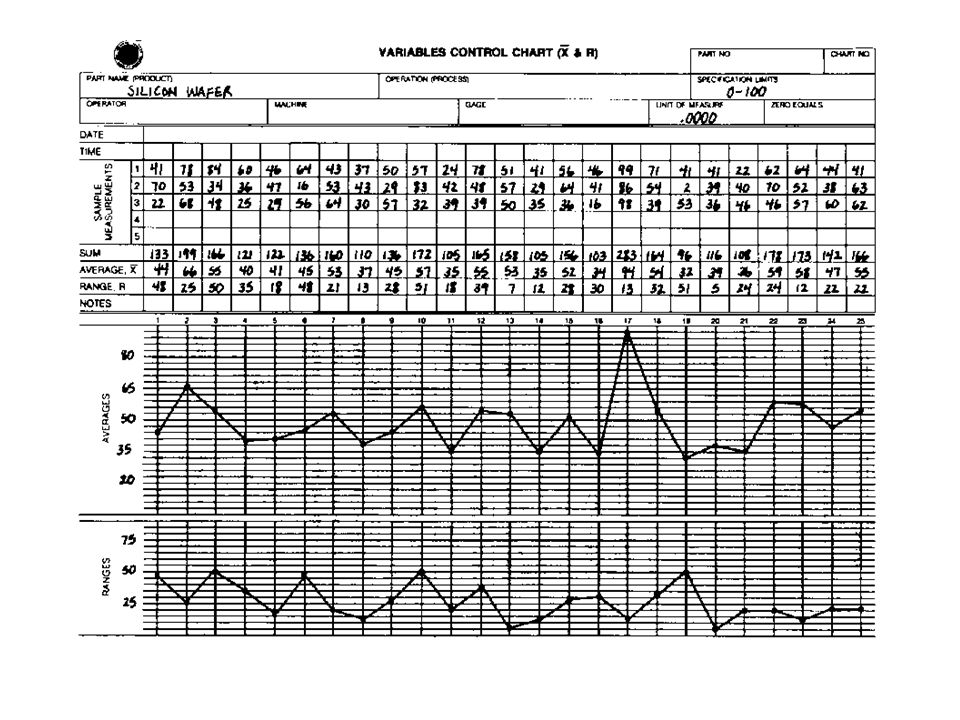
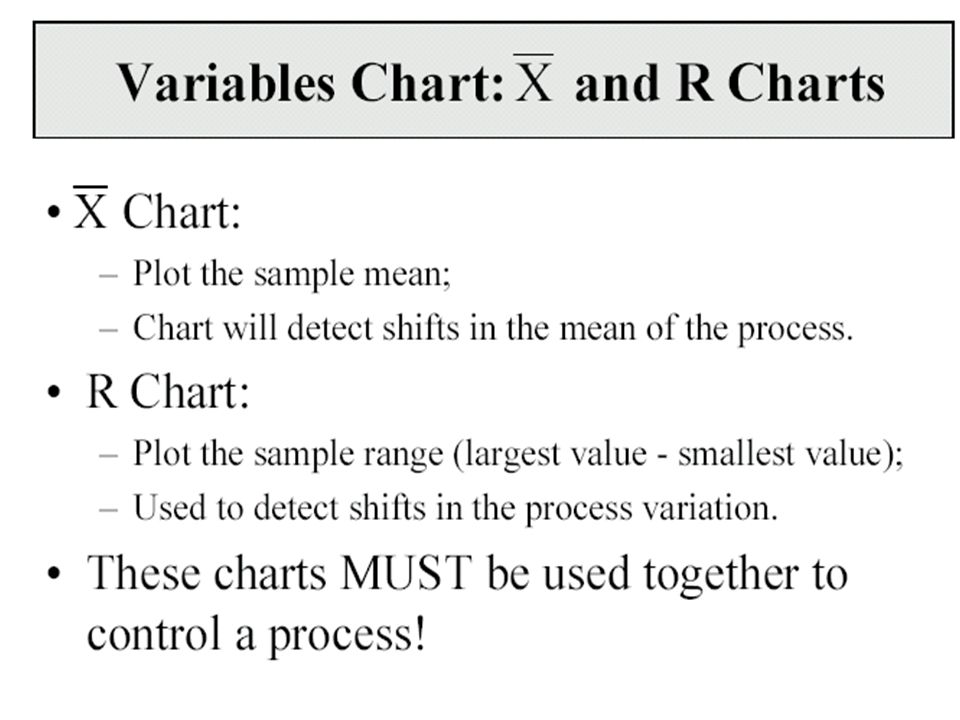
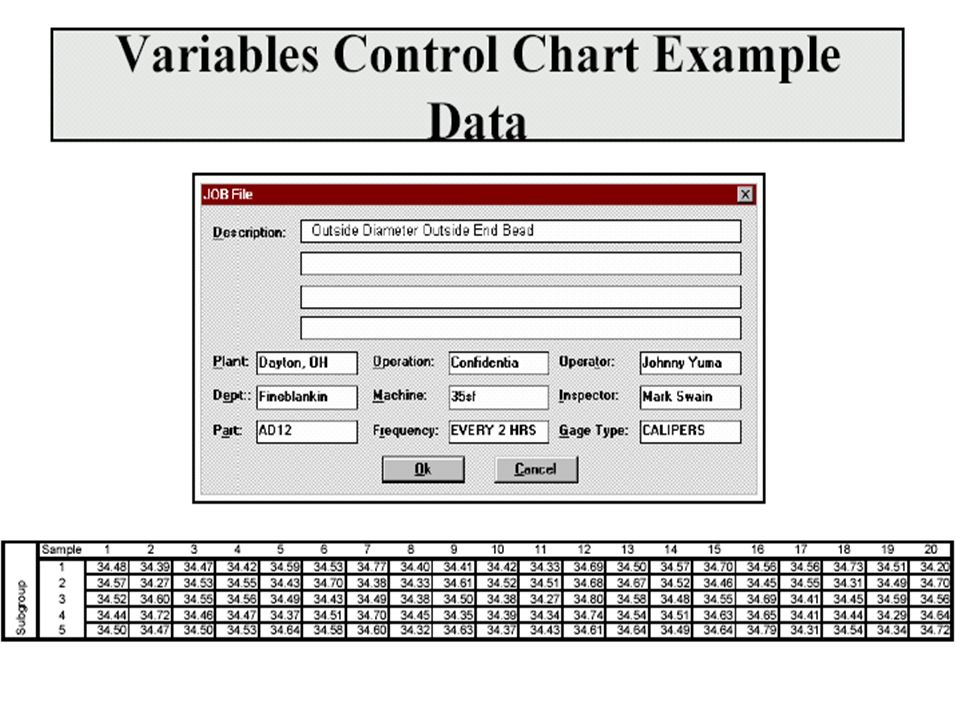
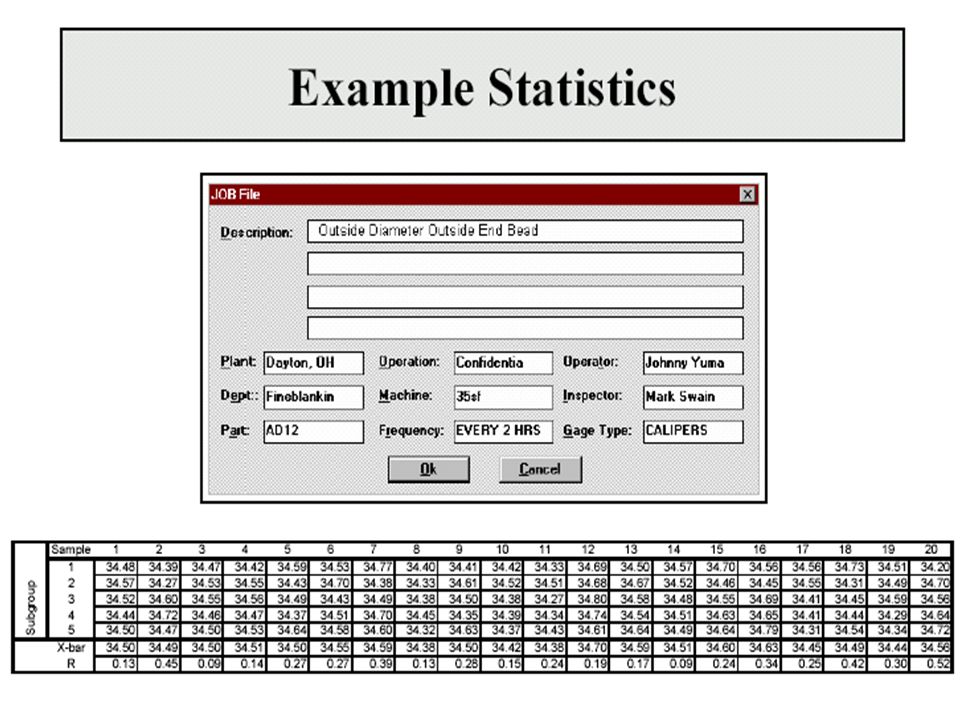
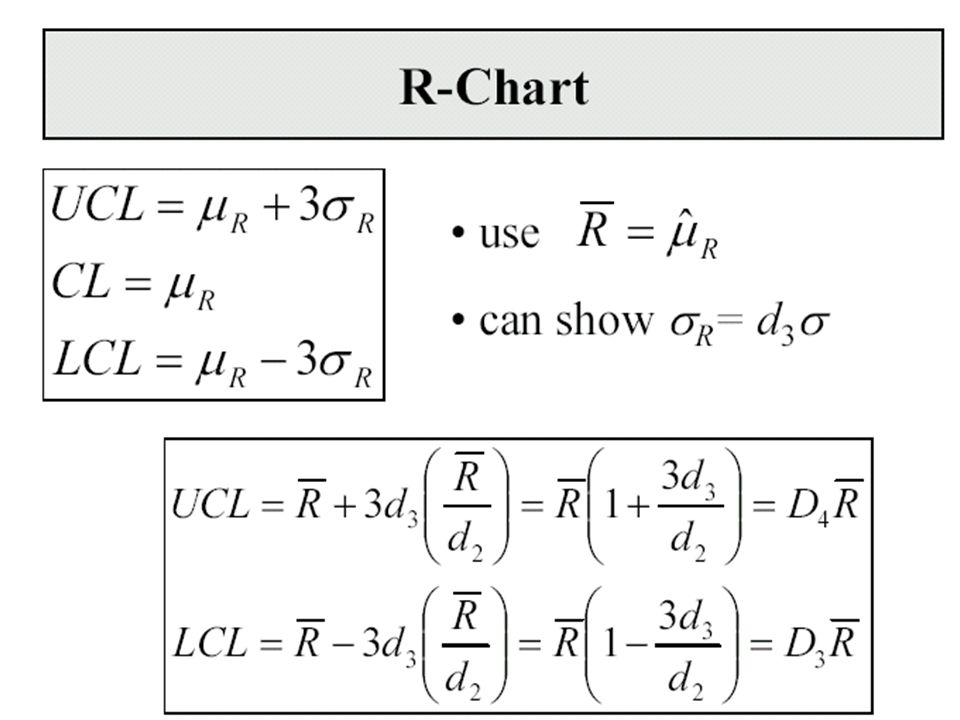
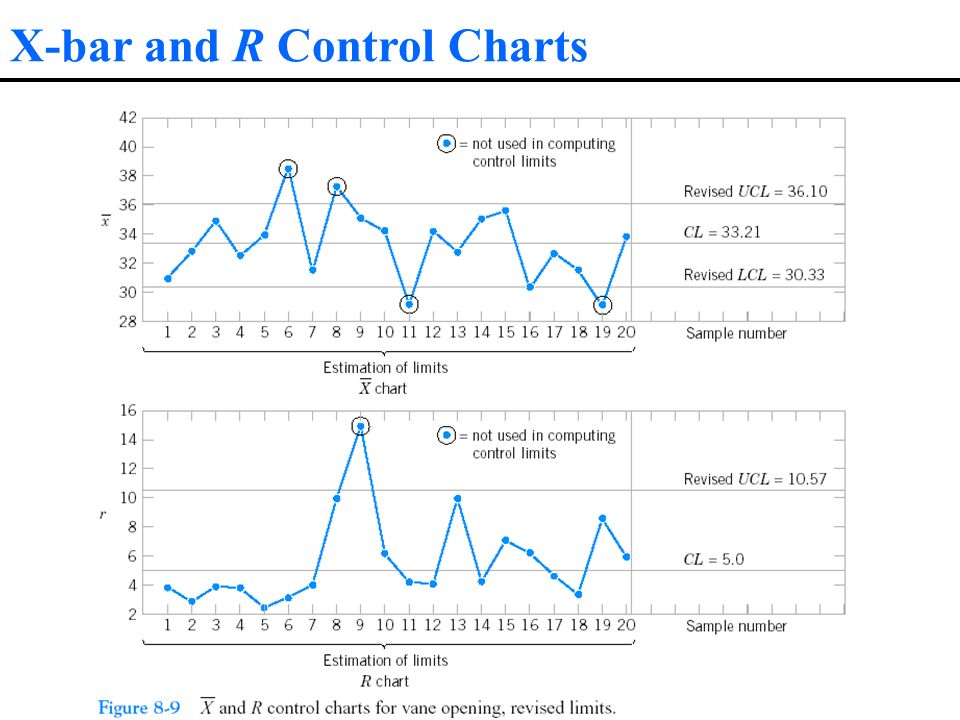
X-bar and R Control Charts

29
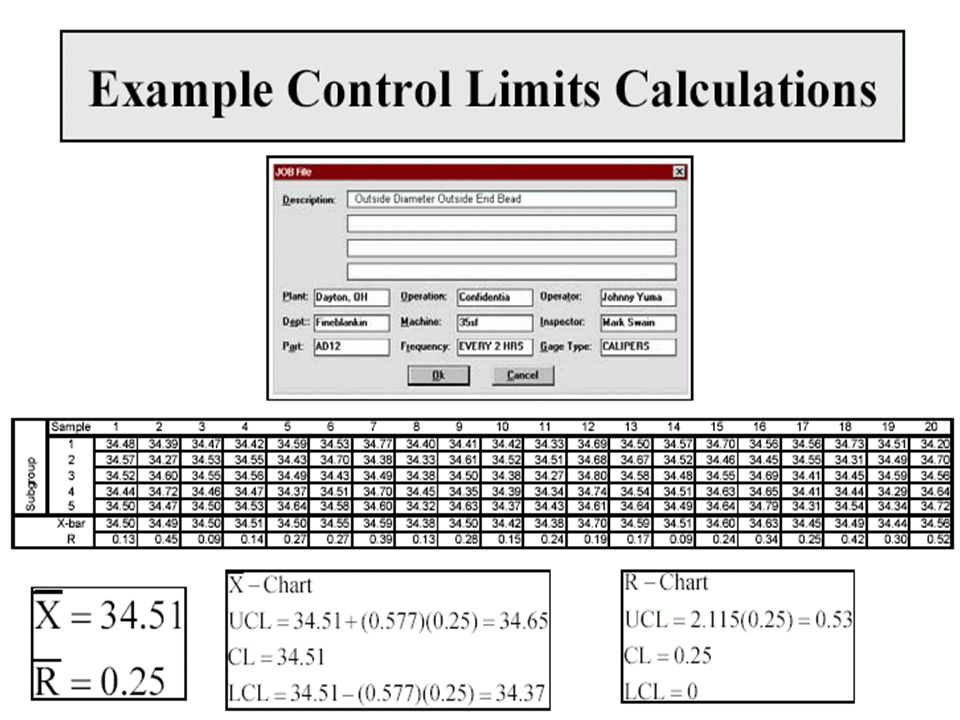
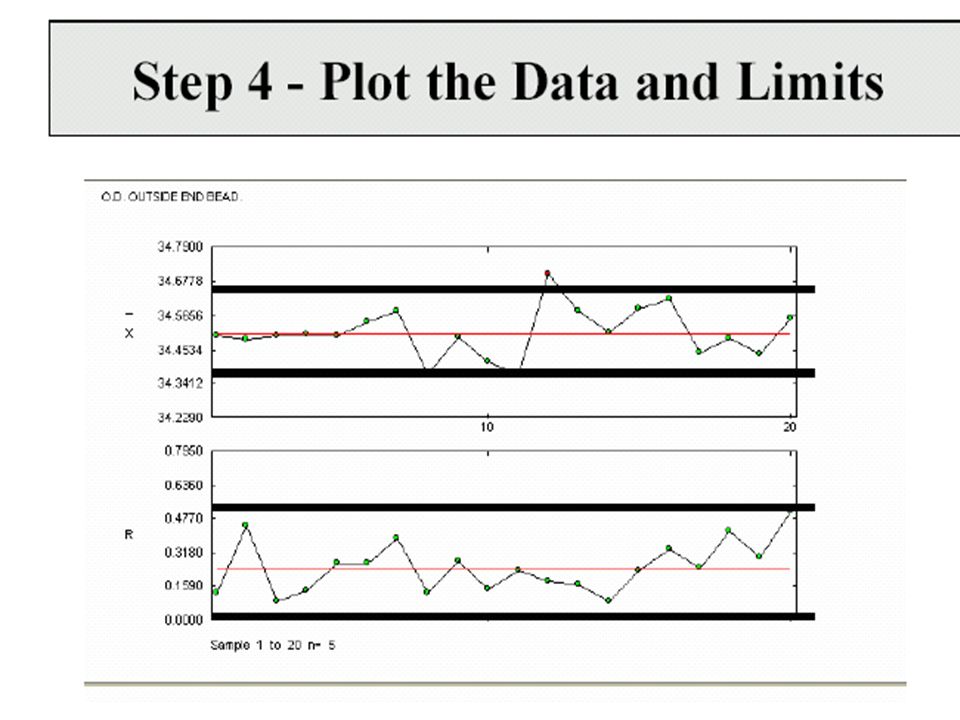
Computer Construction

32
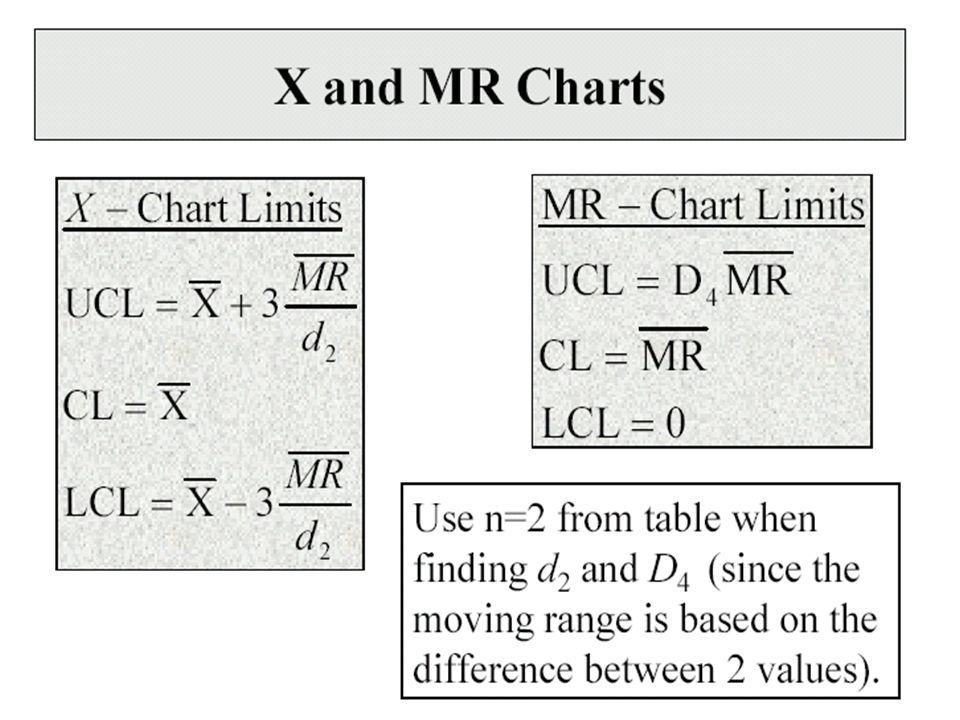
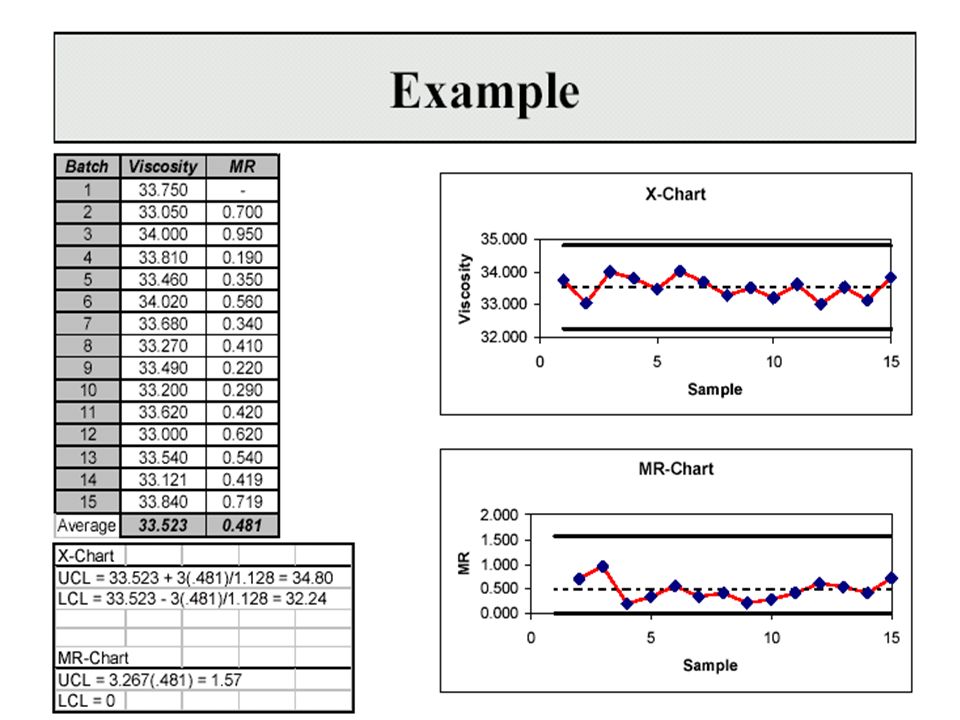
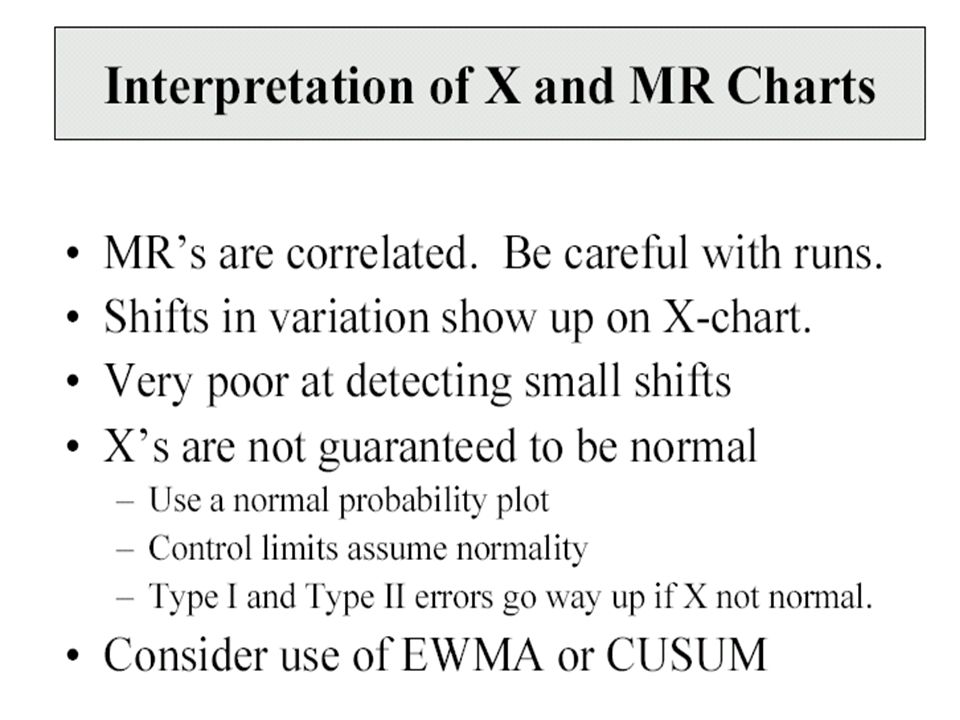
Control Charts for Individual Measurements

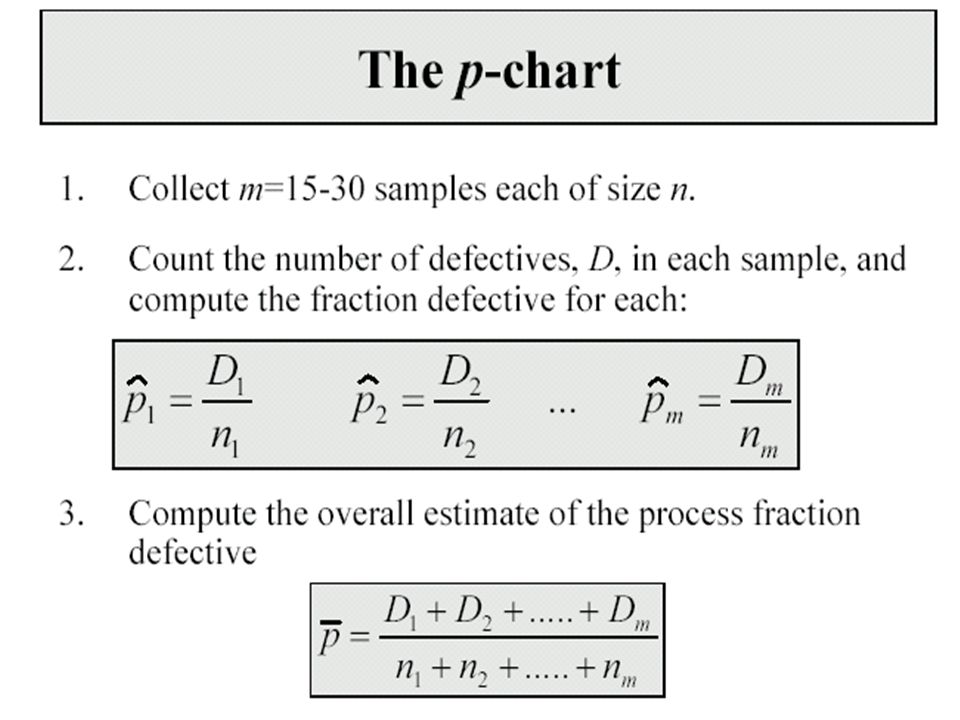
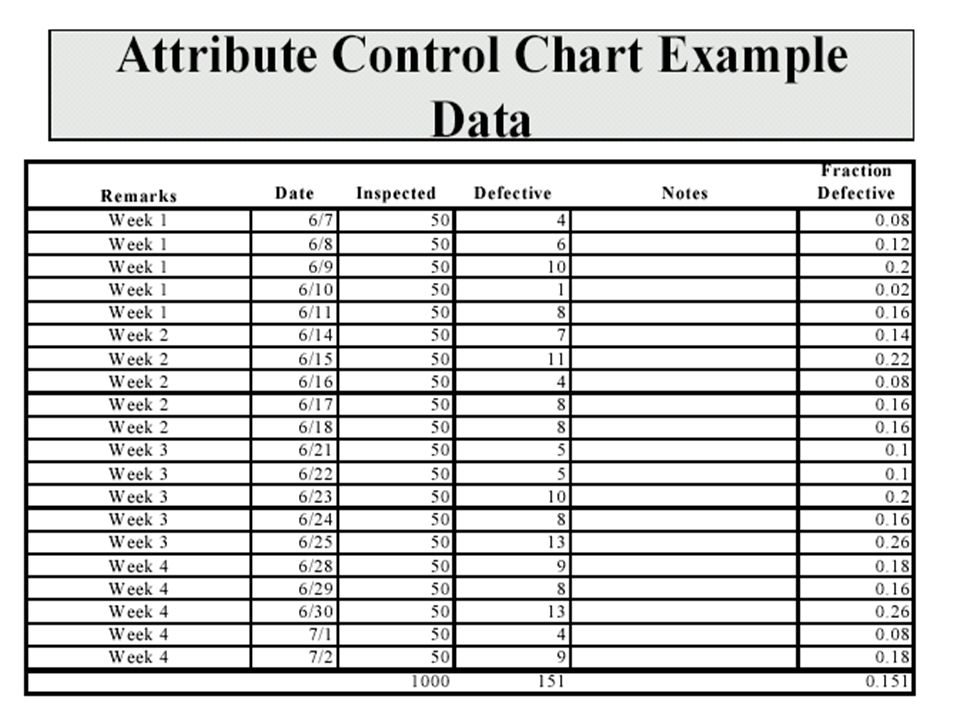
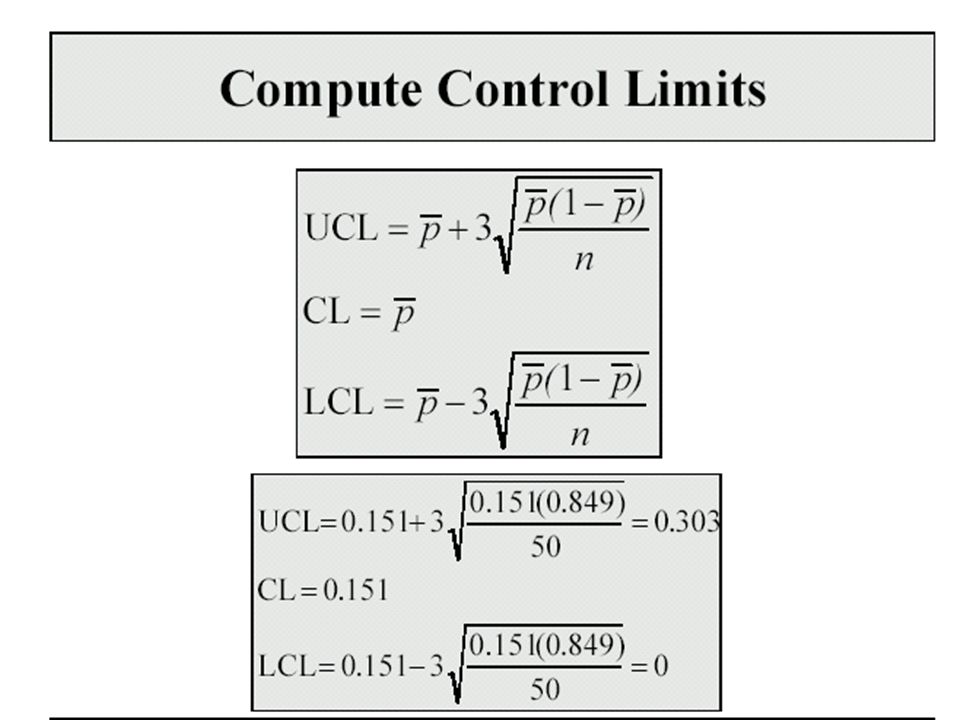
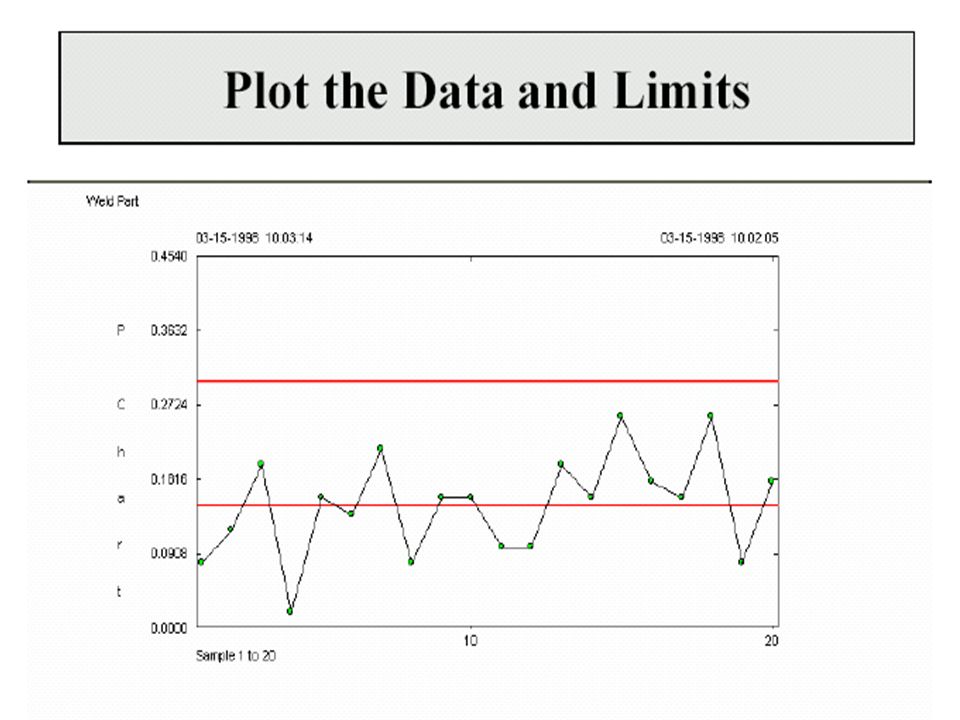
50
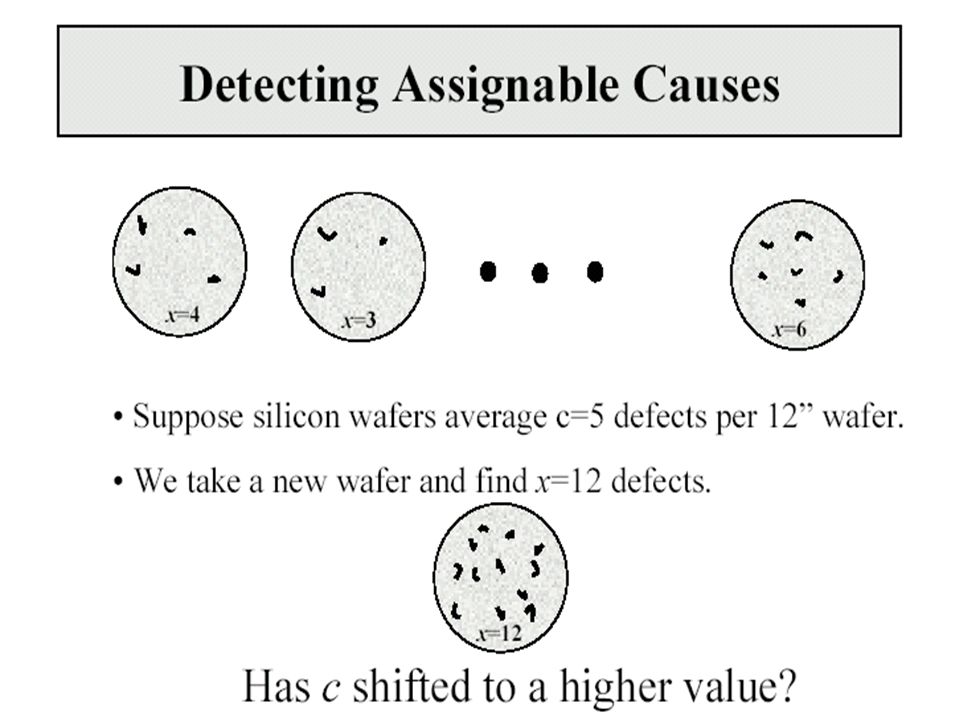
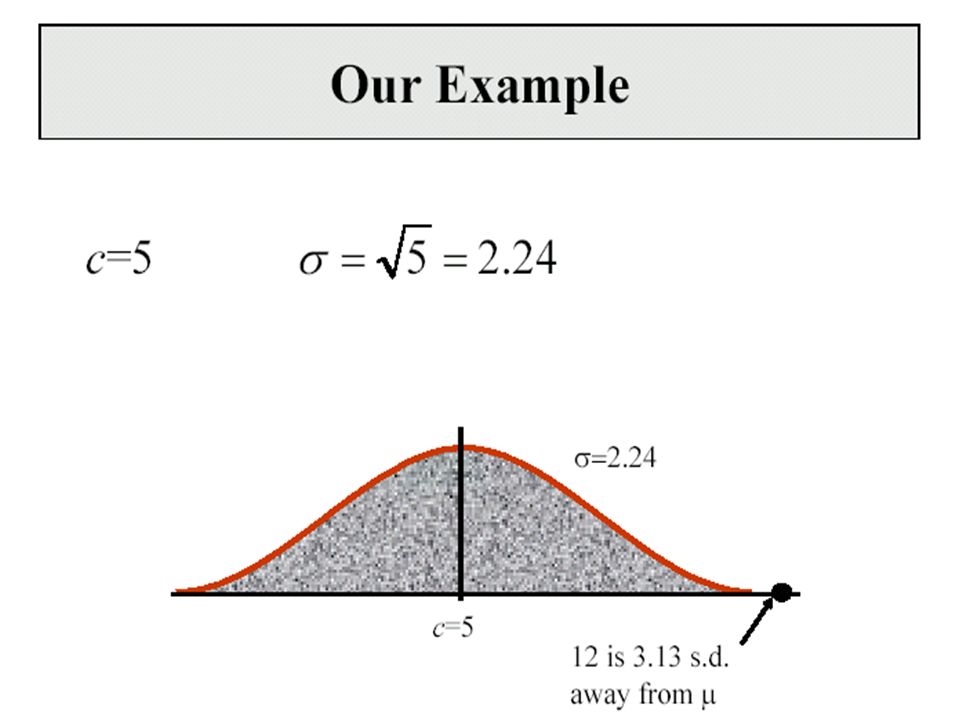
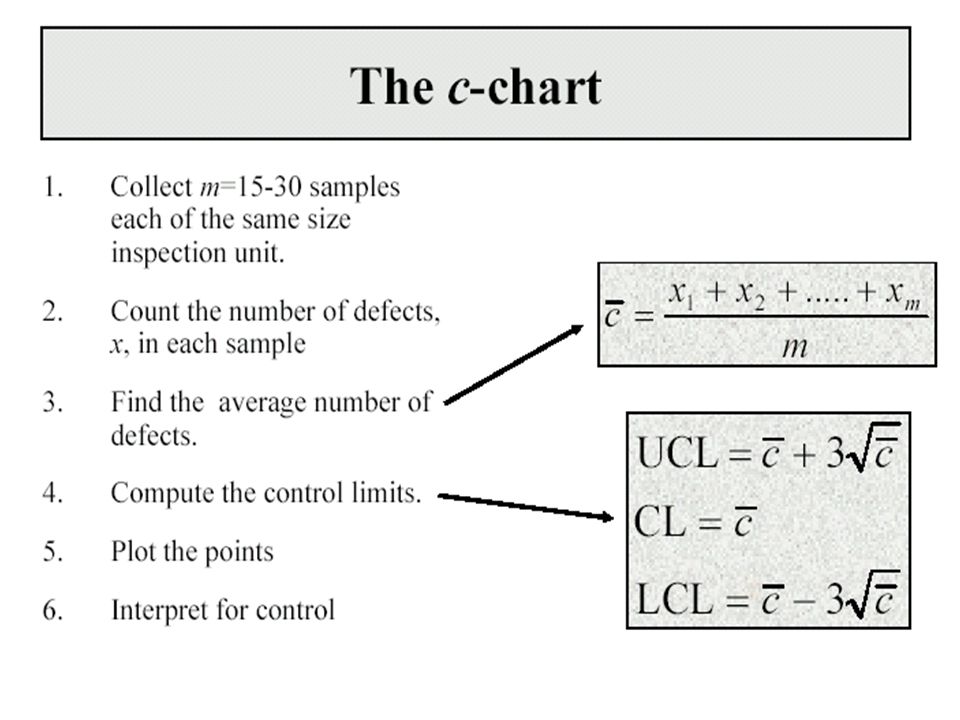
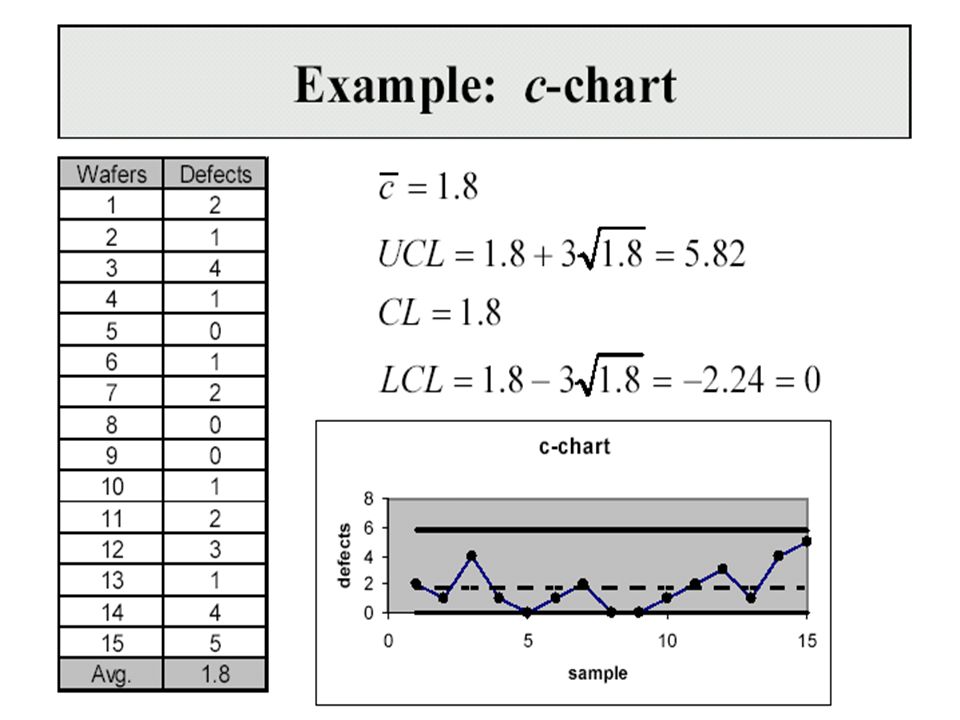
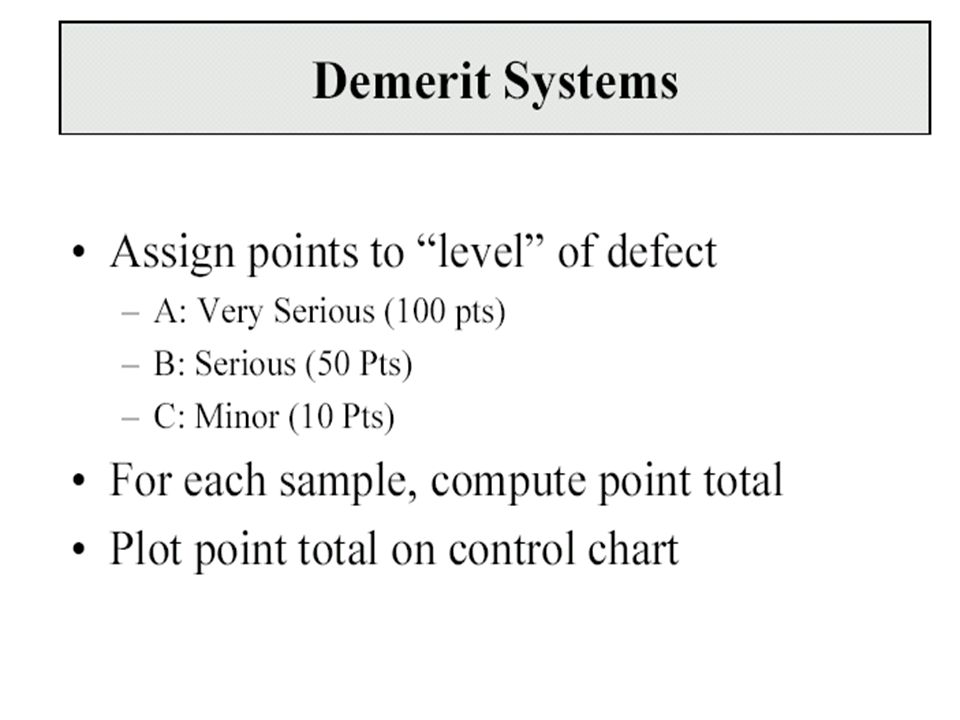
Attribute Control Charts

84
84 Inspection/Testing Points Receiving inspection In-process inspection Final inspection

85
85 Receiving Inspection Spot check procedures 100 percent inspection Acceptance sampling

86
86 Acceptance Sampling Lot received for inspection Sample selected and analyzed Results compared with acceptance criteria Accept the lot Send to production or to customer Reject the lot Decide on disposition

87
87 In-Process Inspection What to inspect? –Key quality characteristics that are related to cost or quality (customer requirements) Where to inspect? –Key processes, especially high-cost and value-added How much to inspect? –All, nothing, or a sample
 Where to inspect. –Key processes, especially high-cost and value-added How much to inspect. –All, nothing, or a sample.")
88
88 Economic Model C 1 = cost of inspection and removal of nonconforming item C 2 = cost of repair p = true fraction nonconforming Breakeven Analysis: p*C 2 = C 1 If p > C 1 / C 2, use 100% inspection If p < C 1 / C 2, do nothing

89
Human Factors in Inspection complexity defect rate repeated inspections inspection rate Inspection should never be a means of assuring quality. The purpose of inspection should be to gather information to understand and improve the processes that produce products and services.

90
90 Gauges and Measuring Instruments Variable gauges Fixed gauges Coordinate measuring machine Vision systems

91
Examples of Gauges

92
Metrology - Science of Measurement Accuracy - closeness of agreement between an observed value and a standard Precision - closeness of agreement between randomly selected individual measurements

93
Repeatability and Reproducibility Repeatability (equipment variation) – variation in multiple measurements by an individual using the same instrument. Reproducibility (operator variation) - variation in the same measuring instrument used by different individuals
 - variation in the same measuring instrument used by different individuals.")
94
Repeatability and Reproducibility Studies Quantify and evaluate the capability of a measurement system –Select m operators and n parts –Calibrate the measuring instrument –Randomly measure each part by each operator for r trials –Compute key statistics to quantify repeatability and reproducibility

95
Reliability and Reproducibility Studies(2)
")
96
Reliability and Reproducibility Studies(3)
")
97
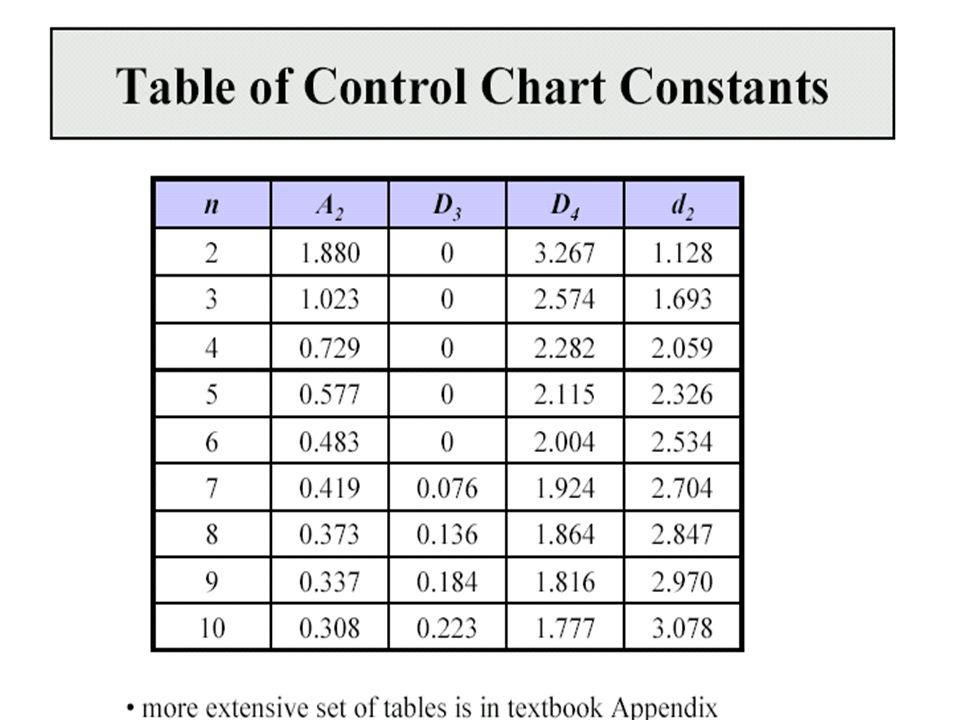
R&R Constants Number of Trials 2345 K1K1 4.563.052.5 0 2.21 Number of Operators 2345 K2K2 3.652.702.3 0 2.08

98
R&R Evaluation Under 10% error - OK 10-30% error - may be OK over 30% error - unacceptable

Similar presentations


>")


