Download presentation
Presentation is loading. Please wait.

1
LONDON CATALYST ‘Health Inequalities in London: developing joint solutions to achieve better health outcomes’ Jessica Allen UCL Institute of Health Equity www.instituteofhealthequity.org

2
Inequalities in health Between and within countries – the social class gradient in health Inequalities in life expectancy and healthy life expectancy The social determinants of health and action to reduce inequalities London – inequalities in health and recession impact

3
CountryYear Life expectancy Highest Israel200980 Iceland200980 Sweden201080 Switzerland200780 Lowest Ukraine201065 Republic of Moldova201065 Kyrgyzstan200965 Belarus200965 Kazakhstan200964 Russian Federation200963 Male life expectancy – WHO European Region Source: WHO HFA database

4
Sweden: Life Expectancy at age 30 by level of education,1986 – 2003, women Source: SCB +3.0 +1.8 +0.7

5
Trends in probability of survival in men by education: Russian Federation 45 p20 = probability of living to 65 yrs when aged 20 yrs University Less than secondary Source: Murphy et al 2006

6
Strategic Review of Health Inequalities in England: The Marmot Review – Fair Society Healthy Lives 2010

7
English Review Following publication of CSDH 2008 Michael Marmot commissioned to produce report to: describe health inequalities describe drivers of health inequalities and propose action to monitor and to reduce health inequalities. Reported in 2010

8
Why Commissioned Frustration that, despite actions and some investment, health inequalities in England continued to widen. Signal that this a government priority. Commissioned by a Labour Govt, reported to a Conservative govt.

9
Reviewed the Evidence Base 13 task groups to support this process Described health inequalities and the evidence linking social determinants of health and health inequalities Made proposals for action and monitoring.

10
Life expectancy and disability-free life expectancy at birth by neighbourhood income deprivation, 1999-2003

11
Prevalence of any common mental disorder by household income, England 2007

12
Health inequalities Social justice – the greatest inequality of all. the conditions in which we are born, grow, live, work and age Creating the conditions for people to have control of their lives

13
Key themes Reducing health inequalities is a matter of fairness and social justice Action is needed to tackle the social gradient in health – Proportionate universalism Action on health inequalities requires action across all the social determinants of health Reducing health inequalities is vital for the economy – cost of inaction

14
Cost of Inaction Human cost In England, dying prematurely each year as a result of health inequalities, between 1.3 and 2.5 million extra years of life. Financial Cost of doing nothing Economic benefits in reducing losses from illness associated with health inequalities. Each year in England: –productivity losses of £31-33B –reduced tax revenue and higher welfare payments of £20-32B and –increased treatment costs well in excess of £5B.

15
A.Give every child the best start in life B.Enable all children, young people and adults to maximise their capabilities and have control over their lives C.Create fair employment and good work for all D.Ensure healthy standard of living for all E.Create and develop healthy and sustainable places and communities F. Strengthen the role and impact of ill health prevention Fair Society, Healthy Lives: 6 Policy Recommendations

16
Every sector is a health sector Early years Education Housing Environment Planning Work Social protection etc etc.

17
Universal proportionate action To raise and flatten the gradient For most excluded, particular, specific focus. Focus on the processes of exclusion

18
To prioritise politically and ensure implementation Evidence Practical Cost efficacy Public support Wider system and cross government support Measurement and monitoring Accountability Leadership, leadership, leadership

19
Cited obstacles to further prioritisation and implementation – nationally and locally We don’t know what to do It’s not our role and remit (health care sector, national government role) Investment is difficult, no money available Difficult to prioritise – not high on the political or public agenda No clear accountability incentives, enforcements Lack of data and information
 Investment is difficult, no money available Difficult to prioritise – not high on the political or public agenda No clear accountability incentives, enforcements Lack of data and information")
20
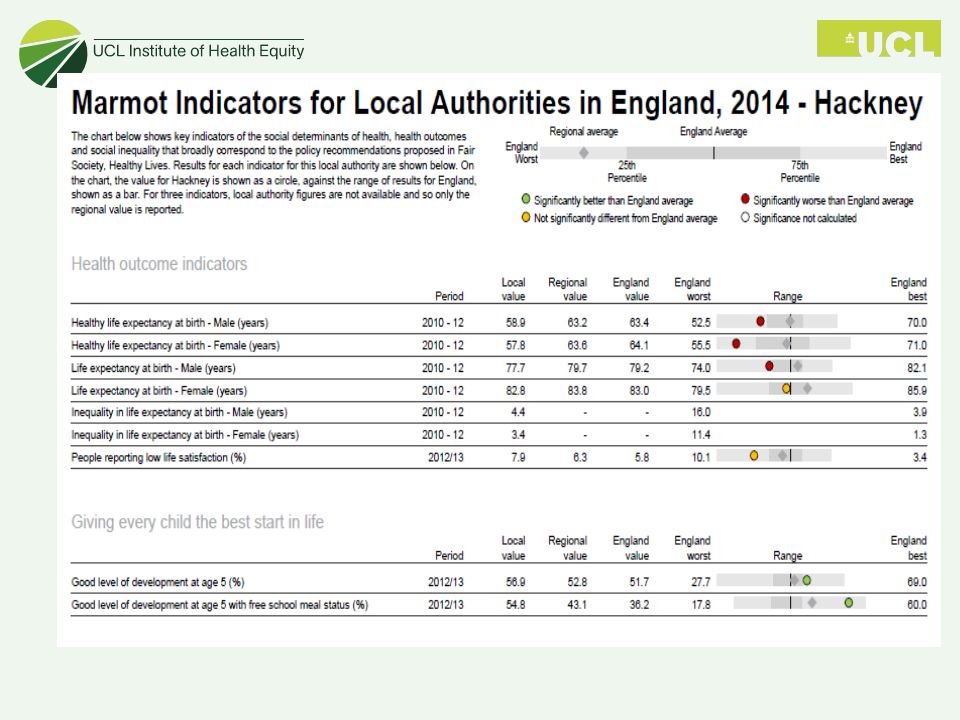
Deprivation level Best performing local authority-females Healthy life expectancy at birth- females 1 – most deprived Greenwich63.3 2Brighton and Hove66.5 3Kensington and Chelsea67.5 4Barnet69.9 5 – least deprived Wokingham71 DeprivationBest performing local authority-males Healthy life expectancy at birth- males 1 – most deprived Brent63.2 2Enfield64.4 3Kensington and Chelsea66.7 4Barnet68.9 5 – least deprived Richmond Upon Thames70 Learn from best performing local authorities by deprivation level.

25
Give every child the best start in life – key points Inequalities evident from a young age Not just genetic variation Inequalities accumulate An equal start details outcomes that need to be improved to improve children’s life chances – children’s development, parenting and the context in which families live Can start reducing inequalities BEFORE birth Adverse circumstances linked to poor health and other outcomes, multiple adverse circumstances particularly harmful Physical or sexual abuse in particular has long lasting impacts Evidence that you can improve the gradient RESOURCE See IHE evidence review on parenting interventions, home to school transition, An Equal Start and Measuring What Matters

26
Percentage of 5-year-olds achieving good development score* in Birmingham Local Authority, the West Midlands region and England. * in personal, social and emotional development and communication, language and literacy. Source: Department of Education. Percentage Early Years

27
ENABLE ALL CHILDREN, YOUNG PEOPLE AND ADULTS TO MAXIMISE THEIR CAPABILITIES AND HAVE CONTROL OVER THEIR LIVES.

28
Education and Skills Educational attainment is a predictor of health outcomes. Higher educational attainment is associated with healthier behaviour. There is a gradient in limiting illness by level of educational attainment. There is a gradient in mortality by educational attainment. B. Enable all children, young people and adults to maximise their capabilities and have control over their lives.

29
Proportion of Year 11 school leavers known to be NEET in 2004 - 2010 Education and Skills

30
Swansea and Wrexham NEETs NEETs reduced by 68% over 5 years, in Swansea from 12.2% in 2004 to 4.2% in 2010 – well below the Welsh average. Strategic focus (priority at strategic level; clear targets set; resources shifted; work intensified; earlier intervention) Identifying target groups within the population of young people (Careers Wales advisers and school staff working together to identify pupils in Year 11 at risk of becoming NEETs) Partnership working and information sharing (Local Authority, Careers Wales, JobCentre Plus, head teachers, teachers, Learning Coaches, Youth Workers, and Education Welfare Officers) Provision & support (change in core service provision, greater emphasis on summer months, skills building provision, flexible start dates for training, work placement through project partners) People (enthusiastic and committed staff) Education and Skills
 Identifying target groups within the population of young people (Careers Wales advisers and school staff working together to identify pupils in Year 11 at risk of becoming NEETs) Partnership working and information sharing (Local Authority, Careers Wales, JobCentre Plus, head teachers, teachers, Learning Coaches, Youth Workers, and Education Welfare Officers) Provision & support (change in core service provision, greater emphasis on summer months, skills building provision, flexible start dates for training, work placement through project partners) People (enthusiastic and committed staff) Education and Skills.")
31
Improving skills and reducing inequalities Equal access to excellent schools and lifelong learning that is not associated with income or wealth. Careers advisors in secondary schools, school nurses Apprenticeship schemes and valued and genuine alternatives for non academic children - early identification of NEETS and structured programme Health literacy and empowerment classes – limit risky behaviour See also: IHE evidence briefing - building resilience in schools, Structured programmes for adolescents to reduce risky behaviour. (Early intervention Foundation)
.")
32
CREATE FAIR EMPLOYMENT AND GOOD WORK FOR ALL: MORTALITY

33
C. Create fair employment and good work for all: mortality

34
What works Ensure employers comply with HSE stress management guidelines Encourage permanent contracts, with clear progression Autonomy in how work is done Good health and safety regulation Support workforce to accommodate older workers Fair effort/reward balance Careful handling of shift work Use LEPs/Social value act to create more high quality jobs Skills audit and skills progression to match training to work available

35
A MINIMUM INCOME FOR HEALTHY LIVING

36
In 2011/12, 23% of households studied (which covers 2/3rds of household types in England) did not receive enough income to reach an acceptable Minimum Income Standard (MIS). In London, where costs are higher, one in four households (29.3%) did not receive enough income. There has been a deterioration in living standards, with the proportion of people living in households below MIS increasing by a fifth between 2008/9 and 2011/12 from 3.8 million to 4.7 million households Data derived from analysis by Matt Padley and Donald Hirsch, Households Below a Minimum Income Standard 2008/9 to 2011/12, JRF
 did not receive enough income. There has been a deterioration in living standards, with the proportion of people living in households below MIS increasing by a fifth between 2008/9 and 2011/12 from 3.8 million to 4.7 million households Data derived from analysis by Matt Padley and Donald Hirsch, Households Below a Minimum Income Standard 2008/9 to 2011/12, JRF.")
37
Effects on health Lower incomes associated with worse health. 29% of household in London have insufficient income. 34% of families with children in UK have insufficient income Many ethnic minorities fair worse Insufficient income – poor, cheap diets not conducive to weight regulation, inadequate intake of vitamins – e.g iron, lack of resources for clothes, social interaction, good quality housing. Stress effect of debt can lead to addiction Stress/depression as a result of debt can lead to sub optimal parenting

38
What works Increase wages/reduce prices Implement the living wage within the council and through supply chain (see Islington for example) Try to negotiate for cheaper prices for housing and essential services (follow up on Coventry on whether they managed to get utility bills down) Utilise social value act NB. Food banks saw a tripling of use last year – without them situation could be worse. Resource: see IHE evidence review on implementing the living wage

39
System alignment and other relevant levers HI duties in Health and Social Care Act Integration duties

40
Summary, Social Value is… An opportunity to improve health and reduce inequalities in social determinants –Locally AND nationally An opportunity to ‘work’ the economic power of public procurement. In 2012-13 over £230 billion spent on public sector procurement of goods and services. An opportunity to align with other priorities and obligations – win wins A legal obligation!

41
needs? National and local system leadership Public Awareness Non government support – third sector Cost case Evidence Cross government sector action and mechanisms

42
Monitoring Accountability Levers Other sectors and workforce

Similar presentations