Download presentation
Presentation is loading. Please wait.

1
If you relate the position of the runner to the background in each image over equal time intervals, you will conclude that she is in motion.

2
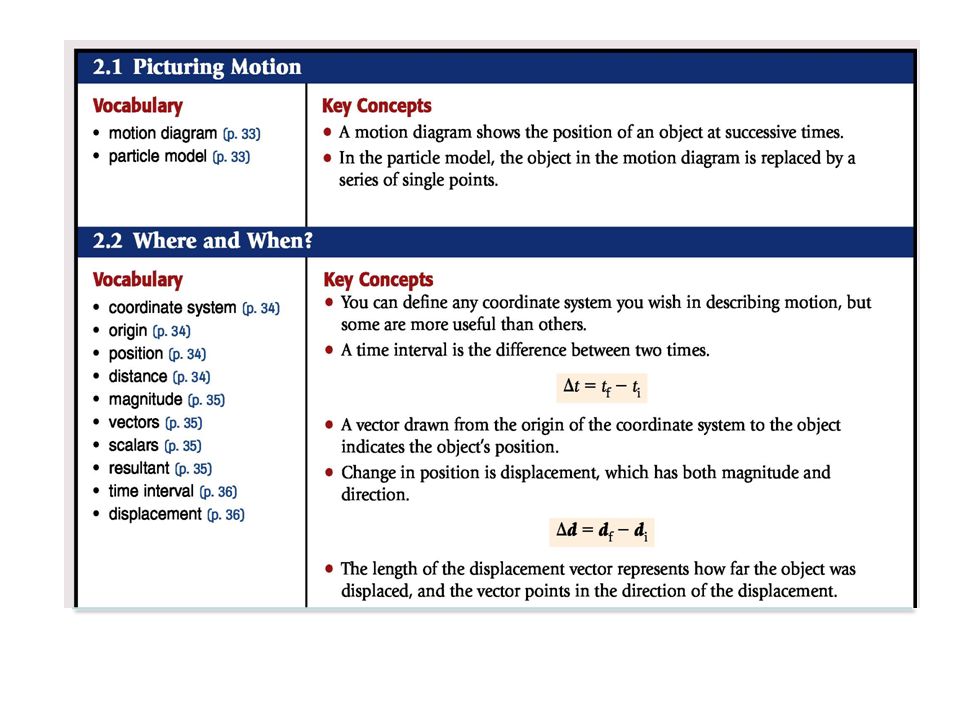
Stacking a series of images taken at regular time intervals and combining them into one image creates a motion diagram for the runner for one portion of her run. Reducing the runner’s motion to a series of single points results in a particle model of her motion.

3
You are defining a coordinate system, which tells you the location of the zero point of the variable you are studying and the direction in which the values of the variable increase. The origin is the point at which both variables have the value zero.

4
The arrow drawn on this motion diagram indicates a negative position. It’s “backwards” from the overall motion..

5
Vectors and scalars Quantities that have both size, also called magnitude, and direction, are called vectors, and can be represented by arrows. Quantities that are just numbers without any direction, such as distance, time, your age, or temperature, are called scalars. The textbook uses boldface letters to represent vector quantities and regular letters to represent scalars Vector addition applet

6
Add two vectors by placing them tip to tail. The resultant points from the tail of the first vector to the tip of the last vector. + A + B A B

7
Start with two vectors, A and B To subtract vector B from vector A, first reverse vector B, then add them together to obtain the resultant, R

8
You can see that it took the runner 4.0 s to run from the tree to the lamppost. The initial position of the runner is used as a reference point. The vector from position 1 to position 2 indicates both the direction and amount of displacement during this time interval.

11
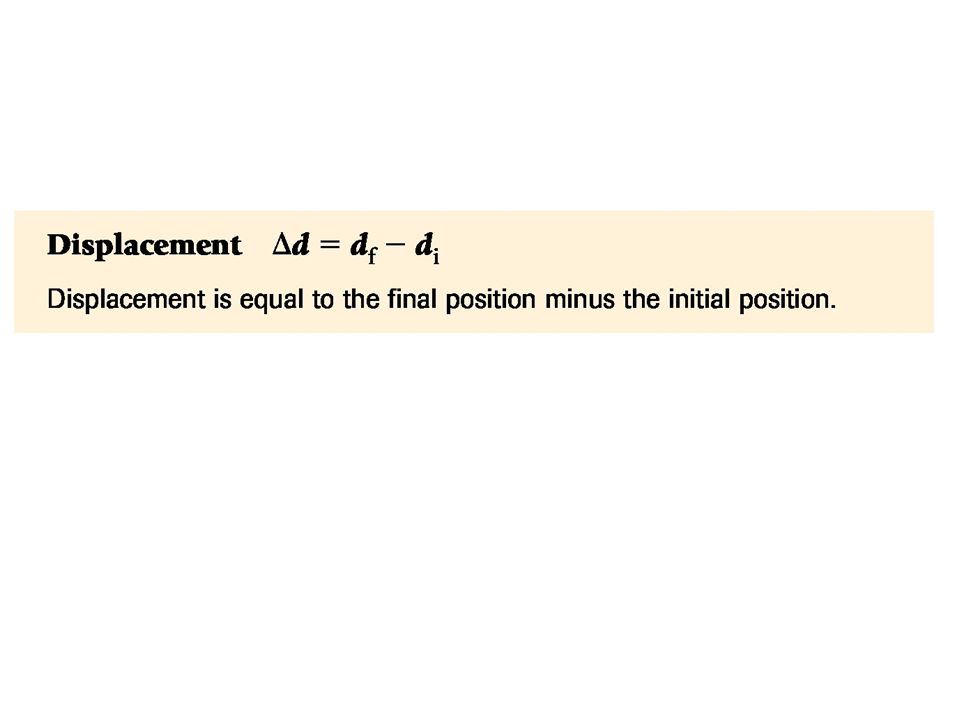
The displacement of the runner during a 4.0-s time interval is found by subtracting d f from d i. In (a) the origin is at the left, and in (b) it is at the right. Regardless of your choice of coordinate system, Δd is the same.
 the origin is at the left, and in (b) it is at the right. Regardless of your choice of coordinate system, Δd is the same..")
12
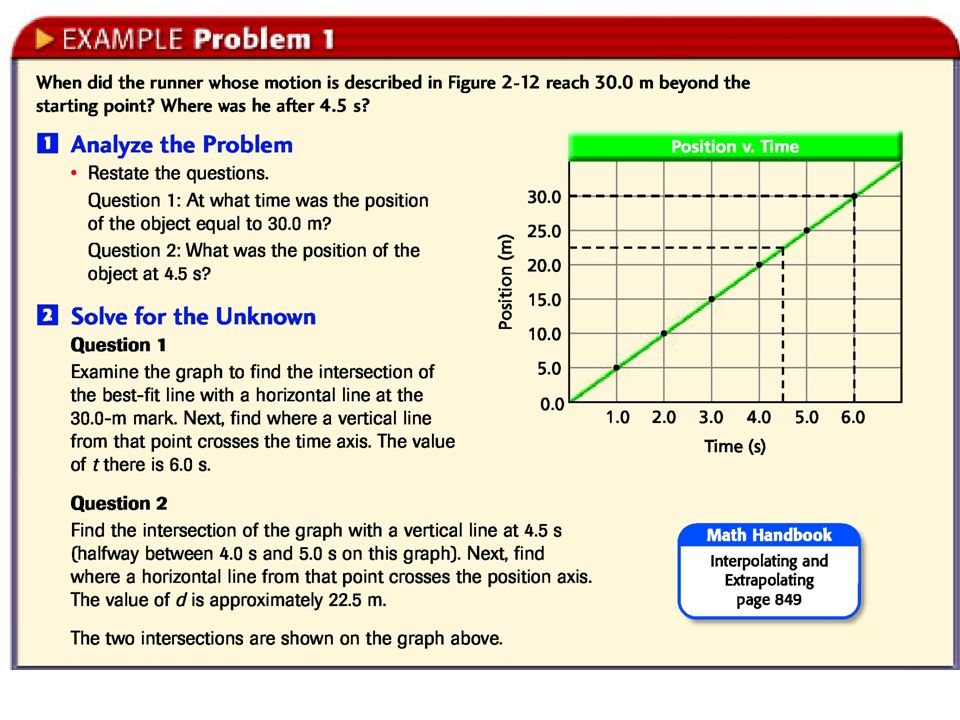
A position-time graph for the runner can be created by plotting his known position at each of several times. After these points are plotted, the line that best fits them is drawn. The best-fit line indicates the runner’s most likely positions at the times between the data points. You did a computer “Gizmo” lab on these…!

14
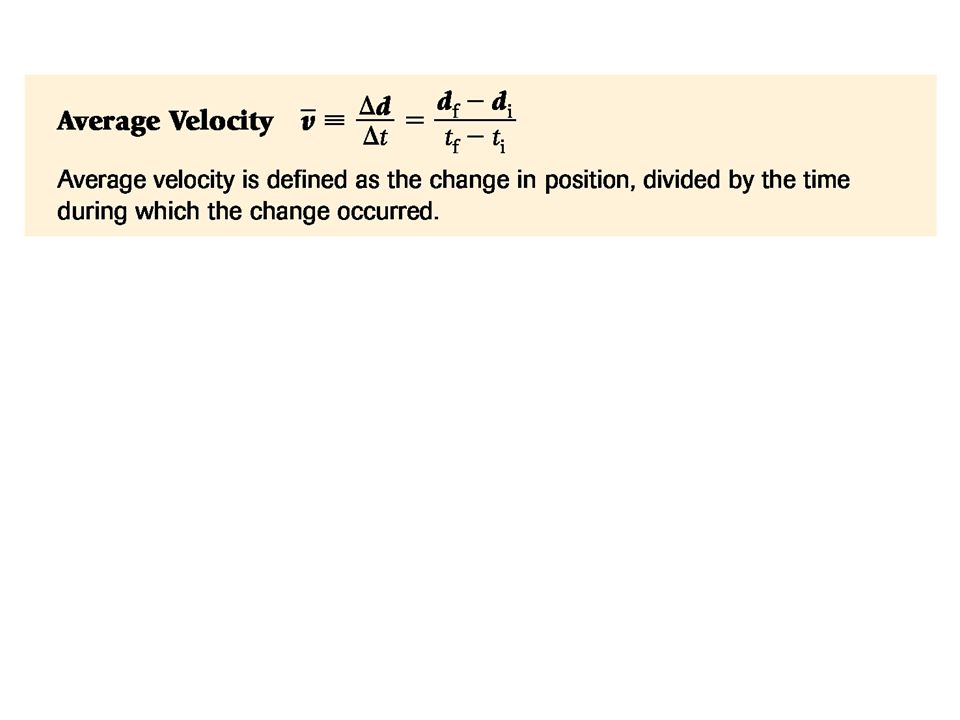
Average velocity From the example of the joggers, you can see that both the displacement, Δd, and time interval, Δt, might be needed to create the quantity that tells how fast an object is moving. How might they be combined? Compare the lines representing the red and blue joggers in the position-time graphs below. The slope of the red jogger’s line is steeper than the slope of the blue jogger’s line. A steeper slope indicates a greater change in displacement during each time interval.

17
The object whose motion is represented here is moving in the negative direction at a rate of 5.0 m/s

19
Instantaneous Velocity Why is the quantity Δd/Δt called average velocity? Why isn’t it called velocity? Think about how a motion diagram is constructed. A motion diagram shows the position of a moving object at the beginning and end of a time interval. It does not, however, indicate what happened within that time interval. During the time interval, the speed of the object could have remained the same, increased, or decreased. The object may have stopped or even changed direction. All that can be determined from the motion diagram is an average velocity, which is found by dividing the total displacement by the time interval in which it took place. The speed and direction of an object at a particular instant is called the instantaneous velocity. In this textbook, the term velocity will refer to instantaneous velocity, represented by the symbol v.

20
A speedometer in a car shows the Instantaneous Velocity!! (This is actually an Android app…!) Note the difference between average and the instantaneous velocity… Analog Digital
 Note the difference between average and the instantaneous velocity… Analog Digital.")
21
Using equations Any time you graph a straight line, you can find an equation to describe it. There will be many cases for which it will be more efficient to use such an equation instead of a graph to solve problems. Any straight line can be represented by the formula: y = mx + b where y is the quantity plotted on the vertical axis, m is the slope of the line, x is the quantity plotted on the horizontal axis, and b is the y- intercept of the line.

22
For the graph in Figure 2-21, the quantity plotted on the vertical axis is position, and the variable used to represent position is d. The slope of the line is –5.0 m/s, which is the object’s average velocity, v avg The quantity plotted on the horizontal axis is time, t. The y-intercept is 20.0 m.

23
Based on the information shown in Table 2-2, the equation y = mx + b becomes d = v avg t + d i, or, by inserting the values of the constants, d = (-5.0 m/s)t + 20.0 m.
t m.")
Similar presentations


. Do Now Why is it important to describe and analyze motion? How fast? How far? Slowing/Speeding? Rest/Constant.>")


