Download presentation
Presentation is loading. Please wait.

2
3 DEMAND AND SUPPLY

3
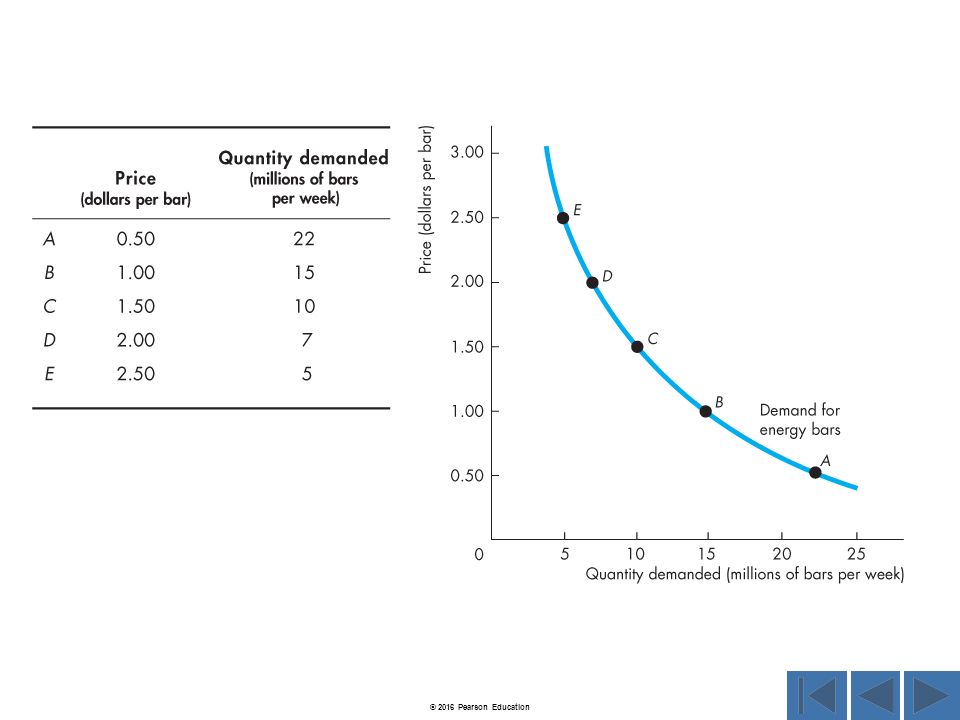
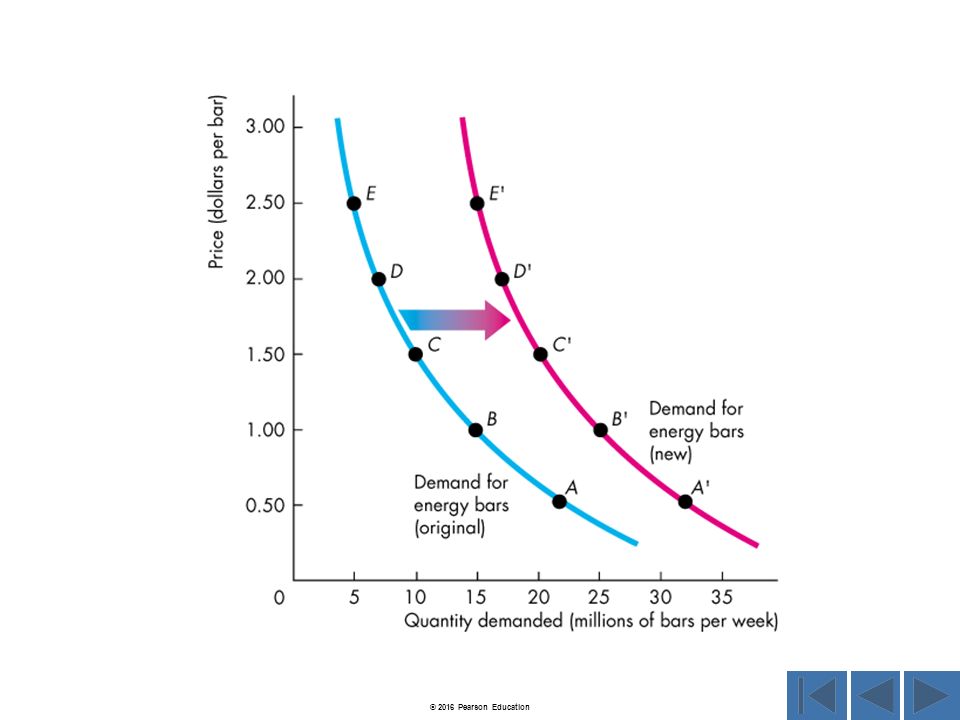
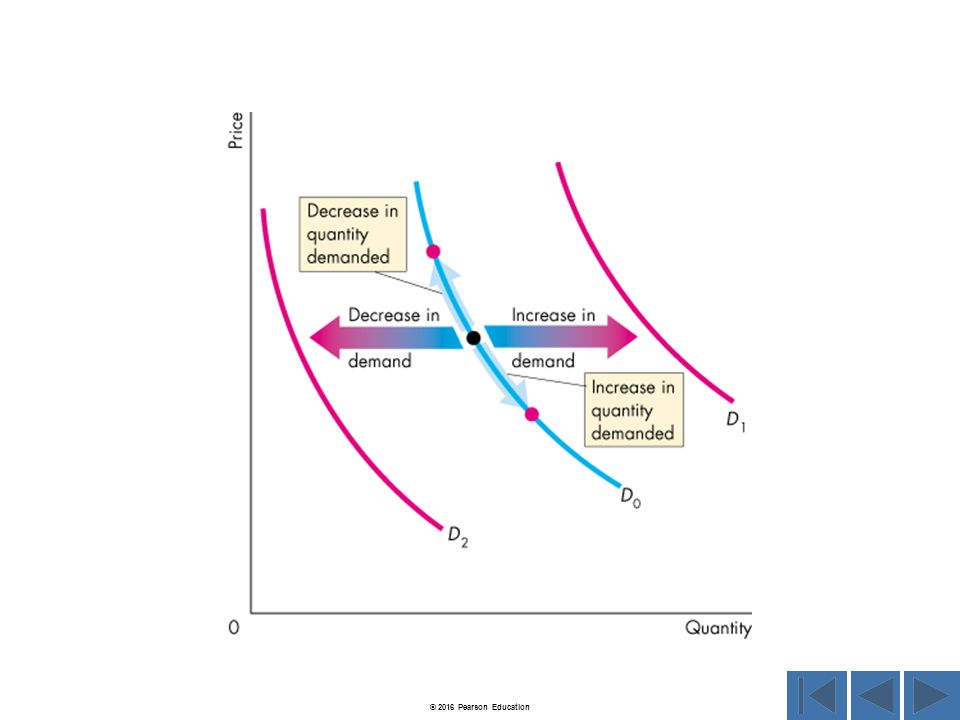
Click on button to go to figure © 2016 Pearson Education Figure 3.3 Figure 3.2 Figure 3.1 The Demand Curve An Increase in Demand A Change in the Quantity Demanded Versus a Change in Demand Figure 3.1 with table Figure 3.1 with table The Demand Curve Figure 3.2 with table Figure 3.2 with table An Increase in Demand

4
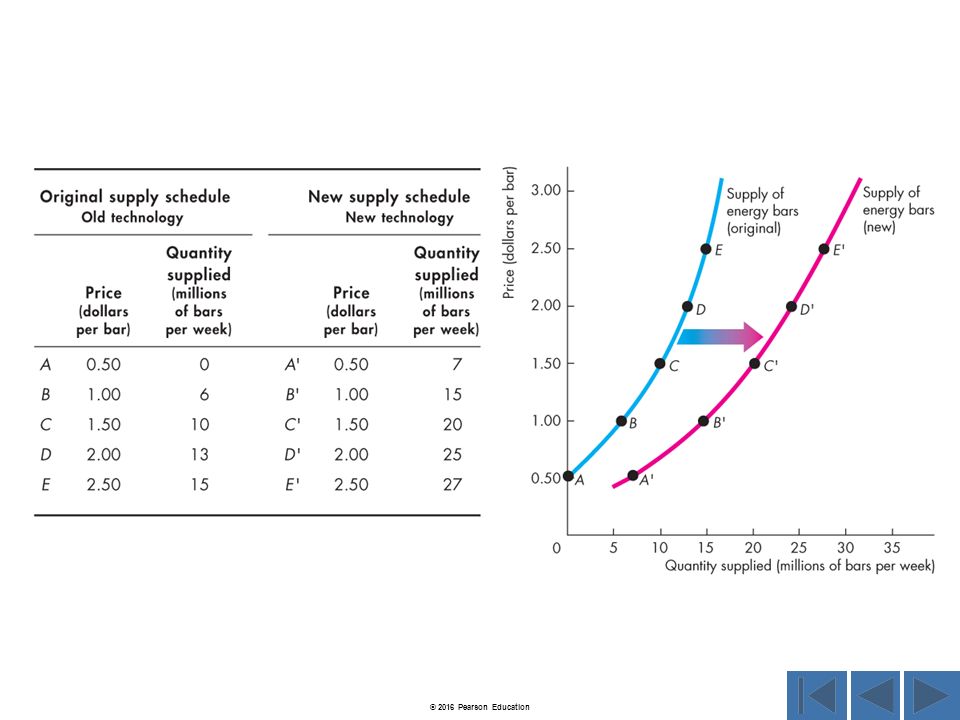
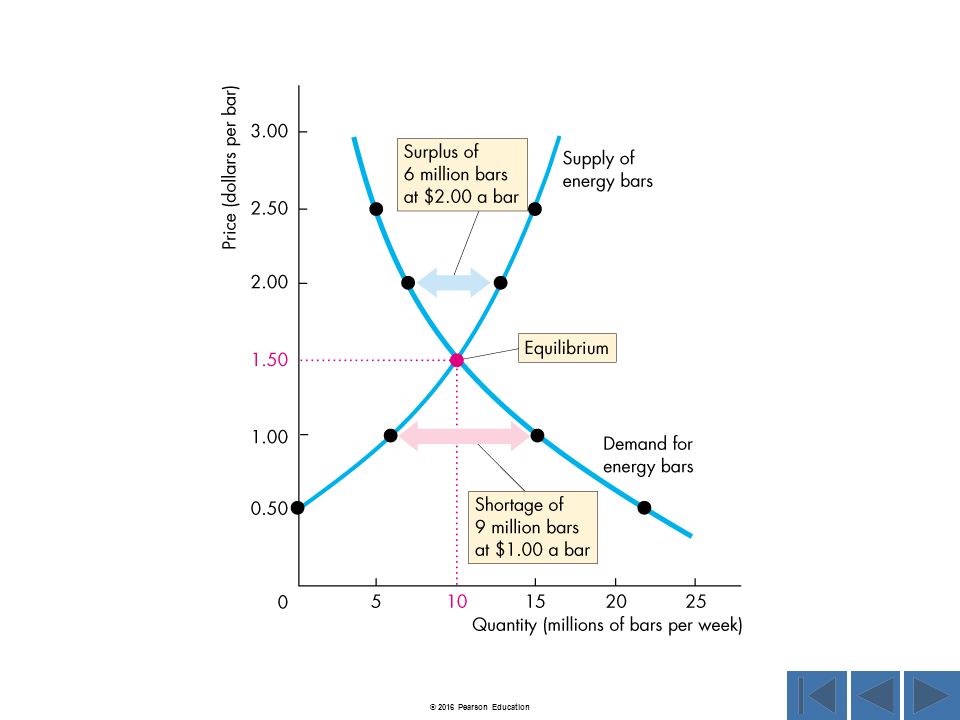
Click on button to go to figure © 2016 Pearson Education A Change in the Quantity Supplied Versus a Change in Supply Figure 3.7 Figure 3.6 Equilibrium Figure 3.7 with table Figure 3.7 with table Equilibrium Figure 3.5 with table Figure 3.5 with table An Increase in Supply Figure 3.5 An Increase in Supply Figure 3.4 The Supply Curve Figure 3.4 with table Figure 3.4 with table The Supply Curve

5
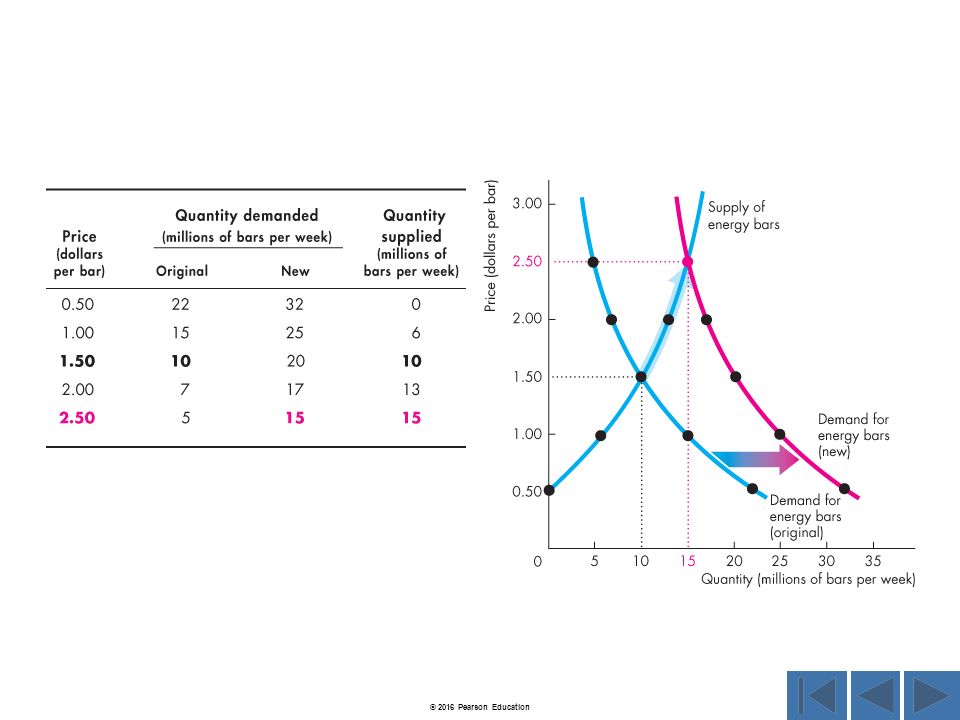
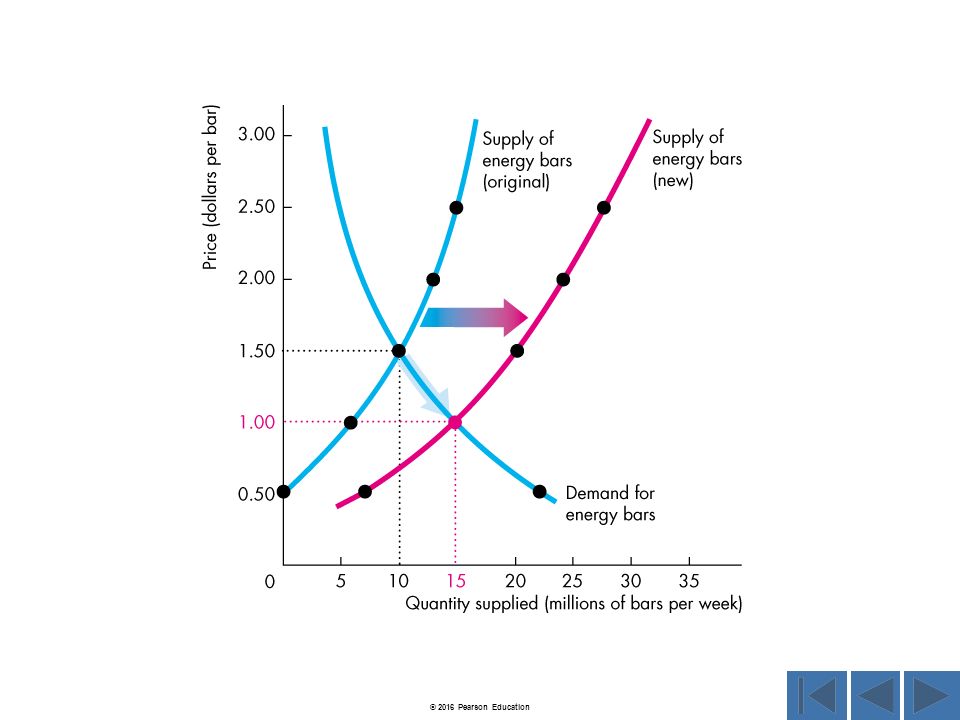
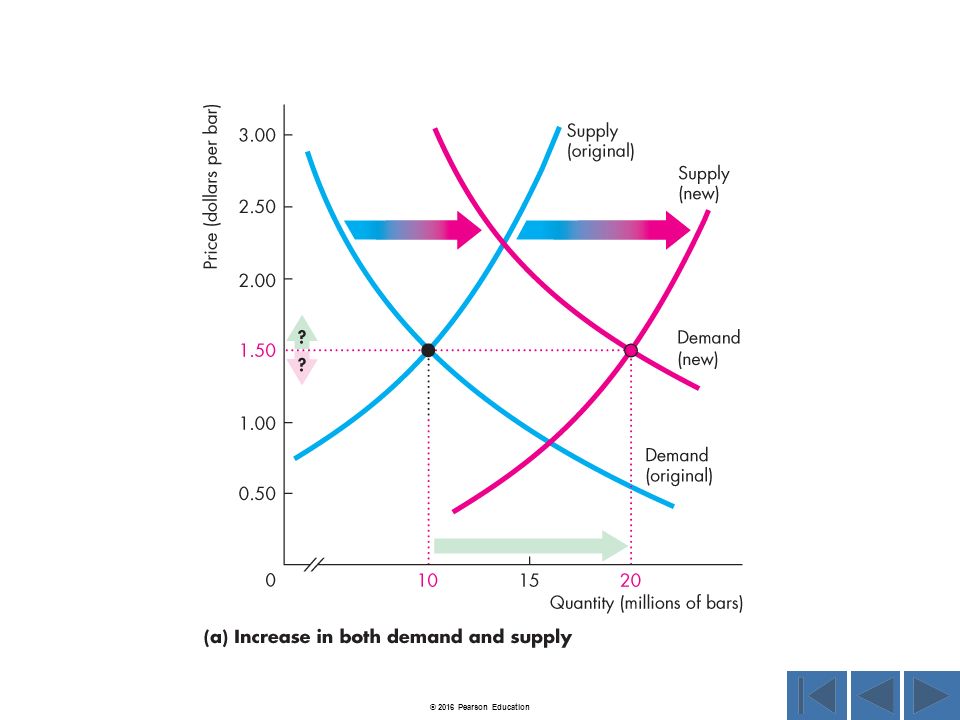
Click on button to go to figure © 2016 Pearson Education Decrease in Both Demand and Supply Increase in Both Demand and Supply Figure 3.10 (b) Figure 3.10 (a) The Effects of a Change in Supply Figure 3.9 The Effects of a Change in Supply Figure 3.9 with table Figure 3.9 with table The Effects of a Change in Demand Figure 3.8 The Effects of a Change in Demand Figure 3.8 with table Figure 3.8 with table
 Figure 3.10 (a) The Effects of a Change in Supply Figure 3.9 The Effects of a Change in Supply Figure 3.9 with table Figure 3.9 with table The Effects of a Change in Demand Figure 3.8 The Effects of a Change in Demand Figure 3.8 with table Figure 3.8 with table")
6
Click on button to go to figure © 2016 Pearson Education The Market for Coffee in 2013-2014 The Market for College Education Economics in the News Economics in the News Economics in the News Economics in the News Decrease in Demand; Increase in Supply Increase in Demand; Decrease in Supply Figure 3.11(a) Figure 3.11(b)
 Figure 3.11(b)")
7
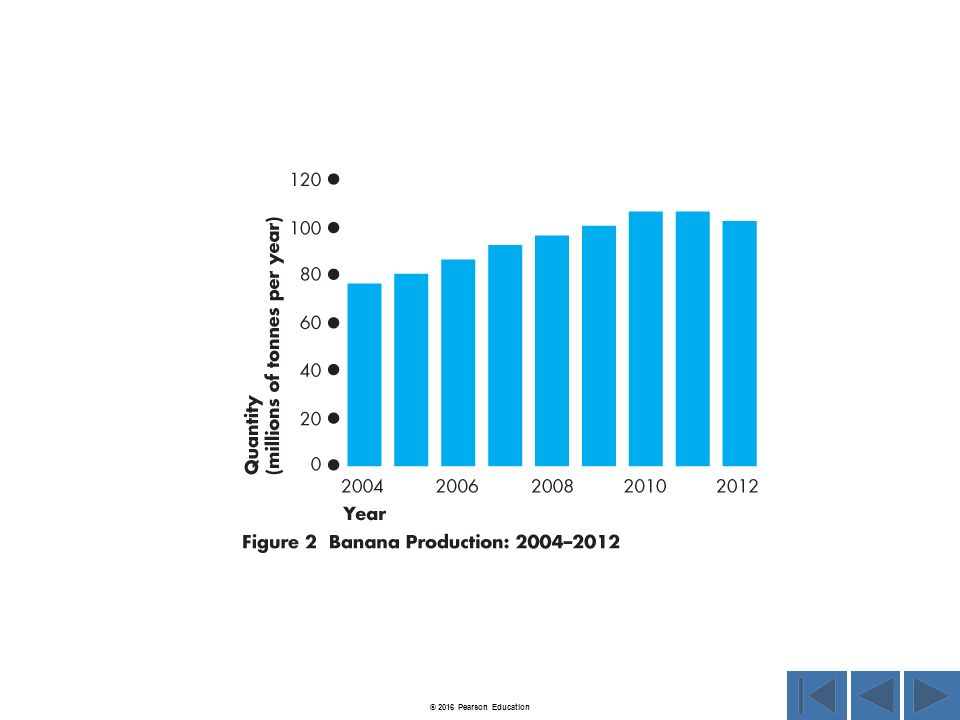
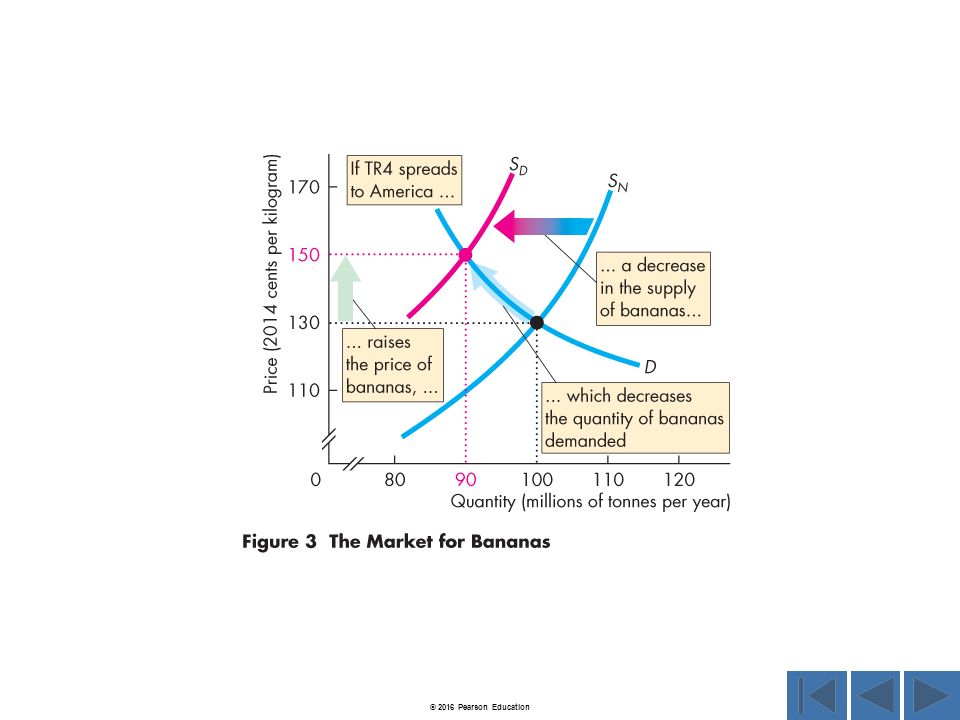
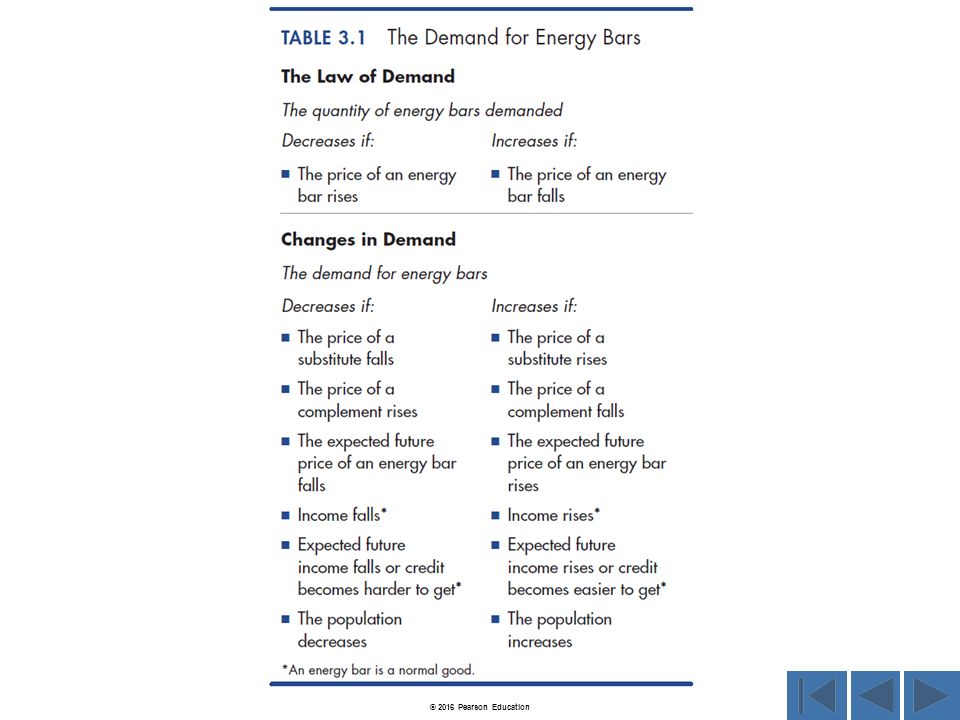
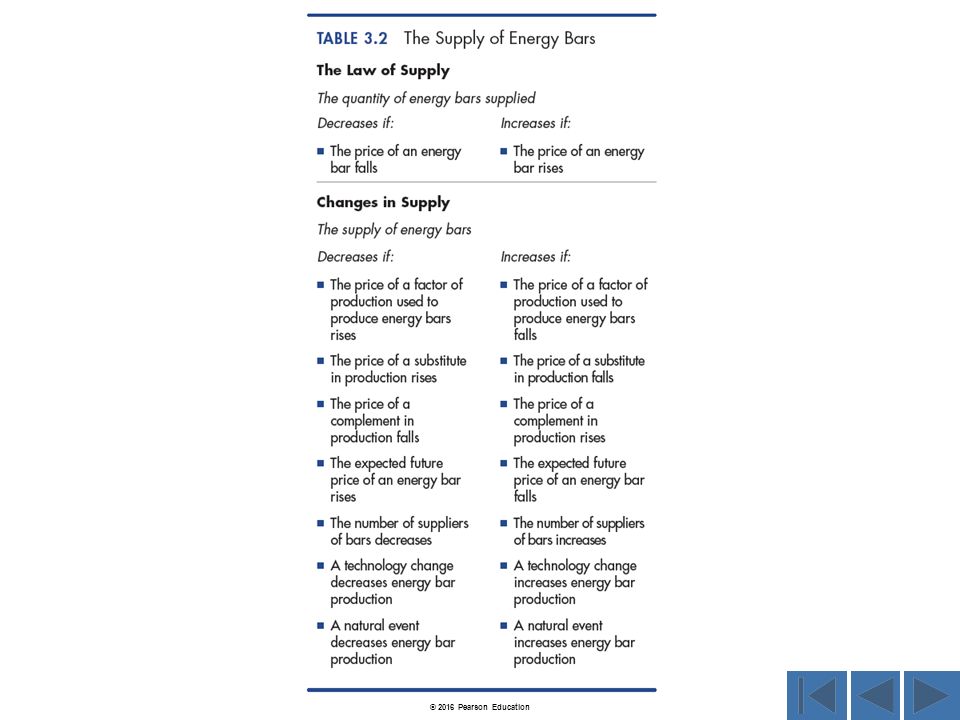
Click on button to go to figure © 2016 Pearson Education The Demand for Energy Bars The Supply of Energy Bars Table 3.2 Table 3.1 Economics in the News Figure 1 Economics in the News Figure 1 Economics in the News Figure 2 Economics in the News Figure 2 The Price of Bananas: 2004-2014 Banana Production: 2004-2012 Economics in the News Figure 3 Economics in the News Figure 3 The Market for Bananas The Market for Roses Worked Problem

8
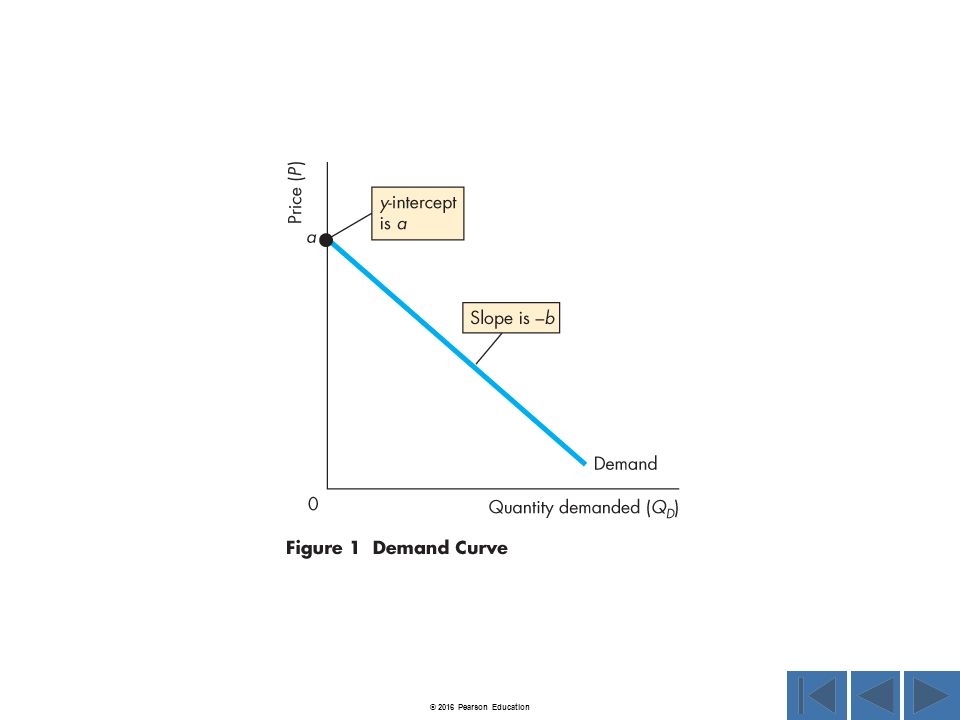
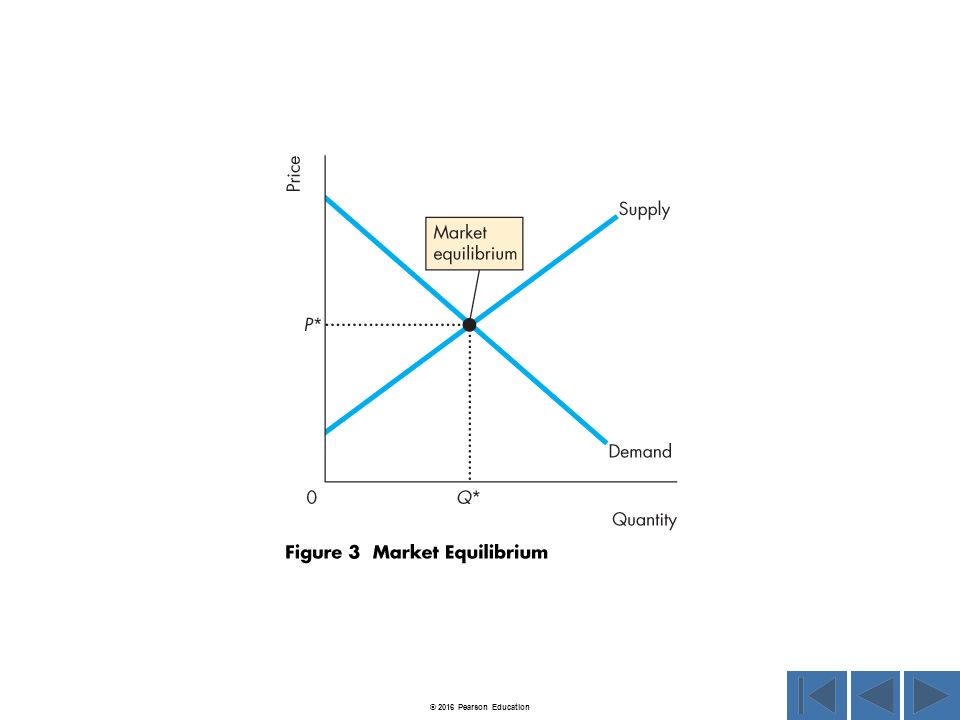
Click on button to go to figure © 2016 Pearson Education Math Note Figure 1 Math Note Figure 1 Math Note Figure 2 Math Note Figure 2 Demand Curve Supply Curve Math Note Figure 3 Math Note Figure 3 Market Equilibrium

9
© 2016 Pearson Education

Similar presentations