Download presentation
Presentation is loading. Please wait.

1
Distillation & PE Diagrams Are you ready...for some chemistry?

2
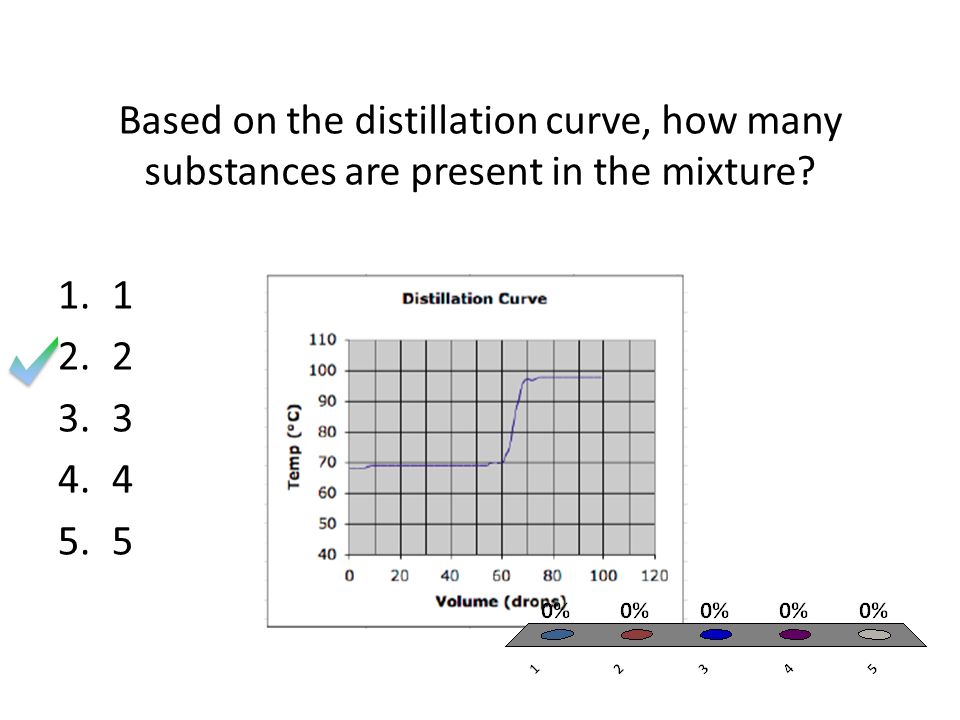
Based on the distillation curve, how many substances are present in the mixture? 1.1 2.2 3.3 4.4 5.5
3
What is the boiling point of substance 1 (the first substance to be collected from the condenser tube)? 1.68.8 0 C 2.80.0 0 C 3.90.0 0 C 4.98.5 0 C

4
What is the boiling point of substance 2 (the second substance to be collected from the condenser tube)? 1.68.8 0 C 2.80.0 0 C 3.90.0 0 C 4.98.5 0 C

5
What is happening in the flat regions of the curve? 1.A substance is undergoing a phase change. 2.A substance’s temperature is increasing. 3.A substance is undergoing a chemical change. 4.A substance is losing energy.

Similar presentations


>")


 1500 700 Phase Change Diagram Practice Use the following graph of Temperature vs. Heat for 10 g of compound “X” to answer the questions: 500.>")


>")
