Download presentation
Presentation is loading. Please wait.

1
Increasing AVF Rates in Facilities with AVF Rates < 50% Project Lisle Mukai, QI Coordinator ESRD Network 18 September 30, 2009

2
Special Acknowledgement for Slide Content Contribution: Fistula First Breakthrough Initiative Website Mid-Atlantic Renal Coalition (FFBI: Presentation to CMS/ESRD-Annual Meeting) CMS Surveyor Training (Condition: Quality Assessment and Performance Improvement - Show Me The Progress
 CMS Surveyor Training (Condition: Quality Assessment and Performance Improvement - Show Me The Progress")
3
Fistula First Breakthrough Initiative (FFBI) The FFBI is a collaboration between the Centers for Medicare and Medicaid Services (CMS), ESRD Networks, and the renal community. Began in 2003 Main objective: 1.To have every eligible patient receive the most optimal form of vascular access-AVF 2.To ensure every vascular access undergo appropriate monitoring and surveillance to avoid vascular access complications.

4
Fistula First AVF Goals CMS Prevalent AVF Goal = 66% Network 18 2009-2010 AVF Goal: Network 18 Goal = 57.8% Network 18 Stretch Goal = 58% Current AVF Rates: National: 53.2% (July 2009) Network 18: 56.9% (July 2009)
 Network 18: 56.9% (July 2009)")
5
Tools & Best Practices: Fistula First Change Concepts 1. Routine CQI Review of vascular access 2. Timely referral to nephrologist 3. Early referral to surgeon for “AVF Only” 4. Surgeon Selection 5. Full range of appropriate surgical approaches 6. Secondary AVFs in AVG patients 7. AVF evaluation/ placement in catheter pts 8. Cannulation training 9. Monitoring and maintenance 10. Continuing Education 11. Outcomes feedback

6
Cost Per Patient by Access Type (USRDS 2006 data) Annual Per Patient Per Year Expenditure Catheter $77,093 Graft $71,616 AVF $59,470 The annual per patient cost savings of an AVF over a graft is $12,269 The annual per patient cost savings of an AVF over a catheter is $17,746
 Annual Per Patient Per Year Expenditure Catheter $77,093 Graft $71,616 AVF $59,470 The annual per patient cost savings of an AVF over a graft is $12,269 The annual per patient cost savings of an AVF over a catheter is $17,746")
7
Network 18 activities to promote & support Fistula First Monthly data collection ◦ Electronically by LDOs (DaVita & FMC) ◦ Manual submission by Independent & SDOs. Distribute quarterly feedback reports (Facility-specific reports, SIMS reports, and Network summary reports) Sharing best practices via Fistula First Newsletter
 Sharing best practices via Fistula First Newsletter.")
8
Network 18 activities to promote & support Fistula First (continued) Provide current educational information relevant to professionals and patients on the NW 18 website and mailings. Work with the MRB to develop projects to assist identified facilities in improving outcomes. Site visits

9
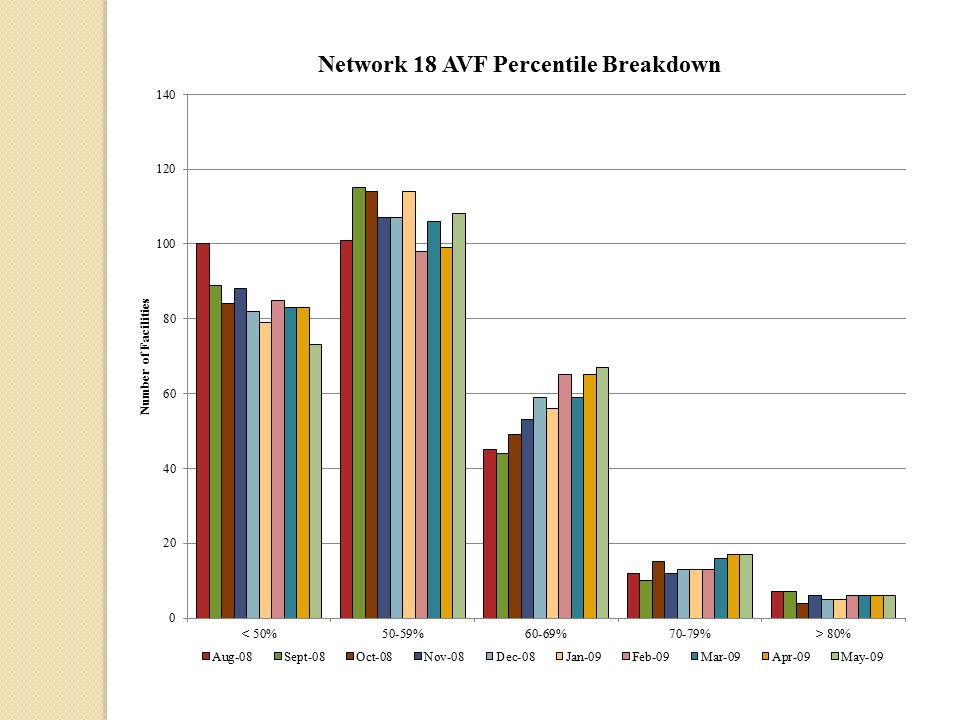
Increasing AVF Rates in Facilities with AVF Rates < 50% Project Facilities > 50% AVF Rate = 73.1% (198 facilities – as of May 2009) 108 facilities = 50-59% 67 facilities = 60-69% 23 facilities = > 70% Facilities < 50% AVF Rate = 26.9% (73 facilities – as of May 2009)
 108 facilities = 50-59% 67 facilities = 60-69% 23 facilities = > 70% Facilities < 50% AVF Rate = 26.9% (73 facilities – as of May 2009)")
11
Increasing AVF Rates in Facilities with AVF Rates < 50% Project (continued) Inclusion Criteria for the project: o AVF rate < 50% (May 2009 SIMS data) o Patient census > 50 patients Exclusion Criteria: o Patient census < 50 patients o Facilities already included in another QIWP Project (exception of SMR and Clinical Indicator Goals Project) o Facilities participating in Phase 2 of CROWNWeb
 Inclusion Criteria for the project: o AVF rate < 50% (May 2009 SIMS data) o Patient census > 50 patients Exclusion Criteria: o Patient census < 50 patients o Facilities already included in another QIWP Project (exception of SMR and Clinical Indicator Goals Project) o Facilities participating in Phase 2 of CROWNWeb")
12
Increasing AVF Rates in Facilities with AVF Rates < 50% Project (continued) Objective: ◦ To have each participating facility review their vascular access program and determine root cause(s) for their facility’s low AVF rate. ◦ Each facility will develop a Quality Assessment and Performance Improvement Plan to improve their AVF rate based on their root cause analysis ◦ Implement their plan and revise their plan along the way by making necessary changes if certain strategies/activities are not successful. ◦ Develop a process to sustain improvements.

13
Increasing AVF Rates in Facilities with AVF Rates < 50% Project (continued) Goal: Group Goal: The participating group of facilities will achieve an increase in the prevalent AVF rate by at least 4 percentage points by May 2010 Facility Goal: Determined by applying the CMS quality deficit reduction formula 66%-AVF rate x 20% = expected improvement AVF rate + expected improvement = goal
 Goal: Group Goal: The participating group of facilities will achieve an increase in the prevalent AVF rate by at least 4 percentage points by May 2010 Facility Goal: Determined by applying the CMS quality deficit reduction formula 66%-AVF rate x 20% = expected improvement AVF rate + expected improvement = goal")
14
Increasing AVF Rates in Facilities with AVF Rates < 50% Project (continued) Timeline: Project period: September 2009 to May 2010 Due dates: ◦ Facility Manager Acknowledgement Letter – August 26, 2009 ◦ Environmental Scan – August 26, 2009 ◦ Medical Director Acknowledgement Letter – September 9, 2009 ◦ Quality Assessment and Performance Improvement Plan (PDSA: Plan-Do-Study-Act format) – November 2, 2009
 Timeline: Project period: September 2009 to May 2010 Due dates: ◦ Facility Manager Acknowledgement Letter – August 26, 2009 ◦ Environmental Scan – August 26, 2009 ◦ Medical Director Acknowledgement Letter – September 9, 2009 ◦ Quality Assessment and Performance Improvement Plan (PDSA: Plan-Do-Study-Act format) – November 2, 2009")
15
Increasing AVF Rates in Facilities with AVF Rates < 50% Project (continued) Conference Calls Monthly calls to share and discuss successes and issues. ◦ Very important because it gives each facility the chance to discuss their concerns or share their issues with others and possibly find solutions to problems. Last Wednesdays of the month starting on October 28, 2009 at 2pm.

16
Increasing AVF Rates in Facilities with AVF Rates < 50% Project (continued) Network Responsibilities: ◦ Project Leader ◦ Instruct/assist with the QI process ◦ Distribute templates for RCA and PDSA ◦ Distribute toolkits/resources and evaluate their usefulness
 Network Responsibilities: ◦ Project Leader ◦ Instruct/assist with the QI process ◦ Distribute templates for RCA and PDSA ◦ Distribute toolkits/resources and evaluate their usefulness")
17
Increasing AVF Rates in Facilities with AVF Rates < 50% Project (continued) Network Responsibilities (continued) ◦ Provide monthly feedback reports (SIMS) ◦ Facilitate monthly conference calls ◦ Provide technical assistance as necessary ◦ Conduct facility site visits as necessary
 Network Responsibilities (continued) ◦ Provide monthly feedback reports (SIMS) ◦ Facilitate monthly conference calls ◦ Provide technical assistance as necessary ◦ Conduct facility site visits as necessary")
18
Increasing AVF Rates in Facilities with AVF Rates < 50% Project Facility Responsibility: Conduct a root-cause analysis and develop a Quality Assessment and Performance Improvement Plan Submit your QAPI plan Implement QAPI plan and revise as necessary during the project Monitor your facility’s progress towards achieving the goal

19
Increasing AVF Rates in Facilities with AVF Rates < 50% Project (continued) Facility Responsibility (continued): Identify tools that would be useful for your facility Participate in monthly conference calls Follow project timelines/due dates Submitting requested documents for the project in a timely manner
 Facility Responsibility (continued): Identify tools that would be useful for your facility Participate in monthly conference calls Follow project timelines/due dates Submitting requested documents for the project in a timely manner")
20
Quality Assessment and Performance Improvement Plan (QAPI) 494.110: (V626) Condition The dialysis facility must develop, implement, maintain and evaluate an effective, data driven, quality assessment and performance improvement program with participation by the professional members of the interdisciplinary team.
 : (V626) Condition The dialysis facility must develop, implement, maintain and evaluate an effective, data driven, quality assessment and performance improvement program with participation by the professional members of the interdisciplinary team.")
21
Quality Assessment and Performance Improvement Plan (QAPI) Interdisciplinary Team: (minimum) o Physician o Registered nurse o Social Worker o Dietitian Also include your surgeon(s) and interventional radiologist(s)
 Interdisciplinary Team: (minimum) o Physician o Registered nurse o Social Worker o Dietitian Also include your surgeon(s) and interventional radiologist(s)")
22
Quality Assessment and Performance Improvement Plan (QAPI) (continued) Standard: Program Scope: 1. The program must include, but not limited to, an ongoing program that achieves measurable improvement in healthcare outcomes and reduction of medical errors by using indicators or performance measures associated with improved health outcomes and with the identification and reduction of medical errors.

23
Quality Assessment and Performance Improvement Plan (QAPI) (continued) Standard: Program Scope: 2. The dialysis facility must measure, analyze, and track quality indicators or other aspects of performance that the facility adopts or develops that reflect processes of care and facility operations.

24
Quality Assessment and Performance Improvement Plan (QAPI) (continued) Standard: Monitoring performance improvement: The dialysis facility must continuously monitor its performance, take actions that result in performance improvements, and track performance to ensure that improvements are sustained over time.
 (continued) Standard: Monitoring performance improvement: The dialysis facility must continuously monitor its performance, take actions that result in performance improvements, and track performance to ensure that improvements are sustained over time.")
25
Quality Improvement Process Root Cause Analysis: Finding the real cause of the problem and dealing with it rather than simply dealing with the symptoms. o Those situations which are recurring with the greatest frequency and consume the greatest amount of resources to rectify are candidates for RCA o To find the root cause, ask “Why?” until the pattern completes and the cause of the difficulty in the situation becomes rather obvious. Gene Bellinger 2004

27
Quality Improvement Process: Plan-Do-Study-Act: PDSA is the format the Network uses for developing a QAPI plan. ACTPLAN STUDY DO

28
Adopted from IHI Website, June 2007 PROJECT: TEAM: (List all members) BACKGROUND: (Summary of facility’s identified problem and description of what the facility has been doing to improve the problem.) Step 1. PLAN: Plan the test. What is the objective of this improvement cycle? What is the goal? (Include a numeric goal to achieve.) Develop a plan to achieve the goal? (List steps of the plan – this will allow you to identify the step that may need modifying/revising if necessary.) 2 of 3 pages What data sources are needed for the test? (What data sources will you be using to monitor your progress?) What measures are used to analyze if you are achieving the goal? B ASELINE : Measure: (Numerical formula) Monitoring frequency : PDSA Template
 Develop a plan to achieve the goal. (List steps of the plan – this will allow you to identify the step that may need modifying/revising if necessary.) 2 of 3 pages What data sources are needed for the test. (What data sources will you be using to monitor your progress ) What measures are used to analyze if you are achieving the goal. B ASELINE : Measure: (Numerical formula) Monitoring frequency : PDSA Template.")
29
Step 2. DO: Try out the test on a small scale. Implement the plan. Document problems and unexpected observations. Step 3. STUDY: Set aside time to analyze the data and study the results. Analyze the results and compare the results with your goal. Step 4. ACT: Determine if the test was successful or the plan needs to be revised. If the test was successful, how will you implement the plan on a wider scale? If it was not successful, what needs to be changed based on what you have learned? Should you continue to search for other root causes?

30
Plan-Do-Study-Act (PDSA) Plan: Set your objective for the project Set goals to achieve (numerical goals and a target date) Develop your plan on how you will improve your identified problem List data sources you will use to monitor your progress for the project
 Plan: Set your objective for the project Set goals to achieve (numerical goals and a target date) Develop your plan on how you will improve your identified problem List data sources you will use to monitor your progress for the project")
31
Plan-Do-Study-Act (PDSA) (continued) Plan (continued): Write out the measure you will be using to analyze if you are achieving your goal. (numerical formula) # of prevalent patients using AVF as primary access Total # of patients at the facility
 # of prevalent patients using AVF as primary access Total # of patients at the facility.")
32
Plan-Do-Study-Act (PDSA) (continued) Plan (continued): Note your baseline for comparison towards your goal Note the frequency in which you will conduct measurement of your progress
 (continued) Plan (continued): Note your baseline for comparison towards your goal Note the frequency in which you will conduct measurement of your progress")
33
Plan-Do-Study-Act (PDSA) (continued) Plan (continued): When you develop your plan, write out your methodology (what you are going to do step-by-step). This way when you implement your plan you can go back to the step that may not have worked and revise it.

34
Plan-Do-Study-Act (PDSA) (continued) Do: Implement your plan Document problems and unexpected observations of your plan Study: Analyze the results and compare it to the goal This analysis should be conducted with the interdisciplinary team. Revise plan if necessary to achieve goal

35
Plan-Do-Study-Act (PDSA) (continued) Act: Is your plan successful? How will you ensure continued improvement? If it wasn’t successful, what needs to be changed based on what you have learned? Should you continue to search for other root causes?

36
Plan-Do-Study-Act (PDSA) (continued ) The PDSA cycle is a continuous cycle. It allows you to frequently assess your plan and make revisions as necessary to achieve your goal. Your plan should be reviewed at least monthly and/or when you realize that your strategy or activity is not working.

37
Plan-Do-Study-Act (PDSA) (continued) You can go back to any step and revise as necessary. Note your progress on your form so that you have a record of the strategies/activities you’ve attempted and results of those attempts as well as the revisions you have made to improve your plan.

38
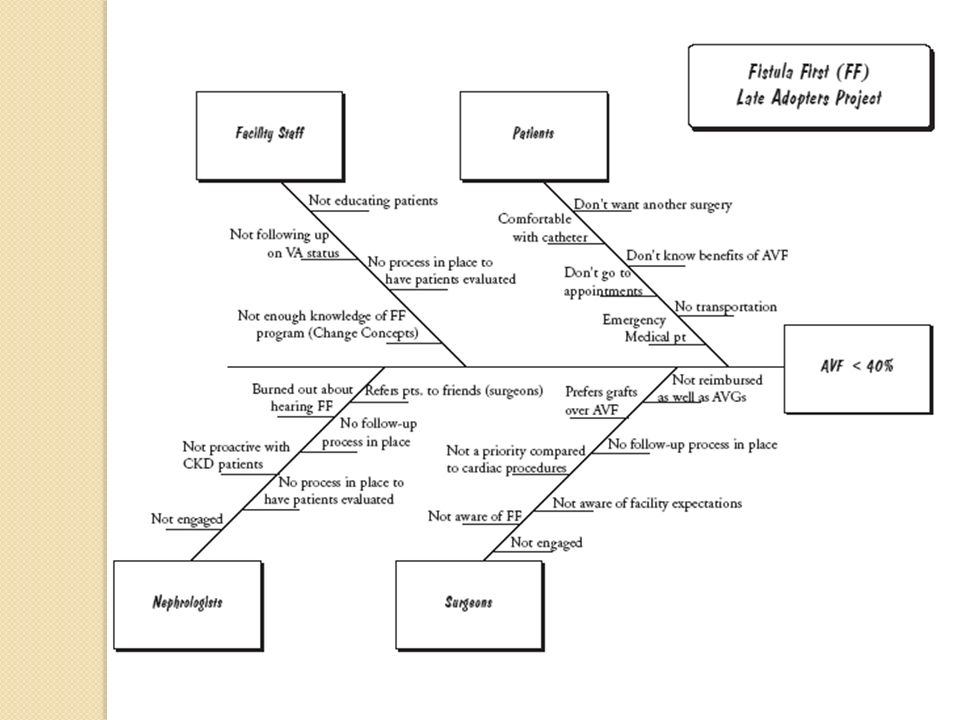
Overcoming Obstacles and Barriers Categories for Network 18 facilities’ common obstacles and barriers: Education Process Communication

39
Overcoming Obstacles and Barriers (continued) Insurance: Communication: When you send a patient to the surgeon for de- clotting of an AVG or catheter send a letter to that surgeon explaining all the difficulties and frequency of those difficulties you have had with that access and why you would like that patient evaluated for an AVF. When the problem occurs frequently, it is justifiable for the surgeon to recommend and place another access.

40
Overcoming Obstacles and Barriers (continued) Fistula First has a “Payer Packet” ( Found on Fistula First website) Includes: o Flyer explaining about the Fistula First Breakthrough Initiative, why this program matters, and what the insurance company can do. o Summary of Recommendations o FFBI Priority Recommendations o Graphs/charts on vascular access costs

41
Overcoming Obstacles and Barriers (continued) Fistula First Sample Letter for PCP or Insurance companies (Found on the Fistula First website) Encourage patients to become an advocate for their care. Involve SW to assist patient on what to discuss with the insurance company.

42
Overcoming Obstacles and Barriers (continued) No surgeons/good surgeons in the area: Education: Nephrologists and the facility (Medical Director, Manager or Vascular Access Coordinator) speak with surgeons about the Fistula First program and the facility’s expectation of the surgeon to meet goals of the Fistula First program. Refer surgeons to the Fistula First website for resources including the surgical video “Creating AV Fistulae in All Eligible Hemodialysis Patients”

43
Overcoming Obstacles and Barriers (continued) Education (continued): Share the Cannulation DVD with the surgeons so that they understand the logistics of cannulation and can position the veins suitably and safely for cannulation. Communication: If facilities in the same area use the same surgeon(s), all facilities should communicate the same message/urgency regarding AVF placement.
, all facilities should communicate the same message/urgency regarding AVF placement..")
44
Overcoming Obstacles and Barriers (continued) Communication (continued): The San Diego and Orange County areas have Dialysis Access Club meetings in which any surgeons, interventional radiologist, nephrologists, and dialysis staff can attend. These meetings are a great open discussion forum for issues in accesses creation, complications, etc. that these disciplines can discuss. Nephrologists can discuss with their colleagues about which surgeons they utilize and how well those surgeons perform.

45
Overcoming Obstacles and Barriers (continued) Process: If you have access to a Vascular Access Center, use those facilities for AVF evaluations - vein mapping – and communicate results with surgeons. You can also use the centers for follow-up after an AVF placement to ensure the access is maturing. Implement Change Concept #4: Surgeon selection based on best outcomes, willingness, and ability to provide access services.

46
Overcoming Obstacles and Barriers (continued) No communication/relationship between Nephrologist and Surgeon: Communication: Try and convey to these physicians and surgeons that the ultimate concern is the patient’s well being. Involve Regional Managers and/or Medical Directors to talk with them and convey the facility’s goals and expectations.

47
Overcoming Obstacles and Barriers (continued) Communication (continued): Invite the surgeon to the facility to get a first hand look at dialysis and what impact they have on the patient’s care and treatment. Facilities develop a communication process with the surgeon’s office – Nephrologist/facility staff meet with the surgeon and explain the Fistula First program, facility expectations and have an agreement with the surgeon to communicate patient progress/status with the facility.

48
Overcoming Obstacles and Barriers (continued) Nephrologists or Surgeons Not Engaged: Education: Educate nephrologists and surgeons about the Fistula First Program – set up a meeting in which you can discuss the program and the facility’s goals and expectations. Refer or download resources from the Fistula First website for nephrologists and/or surgeon.

49
Overcoming Obstacles and Barriers (continued) Communication (continued): Find ways to engage your surgeons and nephrologists (i.e. Share your facility specific data that you receive from the Network, inform them about the vascular access clubs, etc.).
..")
50
Overcoming Obstacles and Barriers (continued) Nephrologist or facility has no control over what access is placed. It is under the control of the individual nephrologist to see to it that his/her patient(s) have quality vascular access care. Communication: Inform surgeon of access preference. A sample letter to surgeons is available on the Fistula First website.
 have quality vascular access care. Communication: Inform surgeon of access preference. A sample letter to surgeons is available on the Fistula First website..")
51
Overcoming Obstacles and Barriers (continued) Communication (continued): Have the nephrologist consult with other nephrologists/surgeons on who they can refer their patients if the current surgeon is not engaged in the Fistula First program or does not perform well.
 Communication (continued): Have the nephrologist consult with other nephrologists/surgeons on who they can refer their patients if the current surgeon is not engaged in the Fistula First program or does not perform well.")
52
Overcoming Obstacles and Barriers (continued) Patient refuses AVF placement, patient is scared, patient is comfortable with current access, patient refuses another surgery, patients access is still functioning, etc.: Education: Educate the patient as a team. If the patient hears the same message from different disciplines, they are more likely to believe that it is for their best interest and comply.

53
Overcoming Obstacles and Barriers (continued) Education (continued): Multiple patient education materials can be found on the Fistula First website. Review materials and resources with the patients/families as it applies to the patient. Encourage family support

54
Overcoming Obstacles and Barriers (continued) Education (continued): Designate a Vascular Access Coordinator to educate and work with these patients and have the team support his/her teaching by reiterating the same message. Facilities should conduct an in-service regarding vascular access (benefits, assessment, care, and how to teach/communicate it with the patients Involve Social Workers with teaching staff how to teach/communicate with patients.

55
Project Summary and Expectations: Develop a Quality Assessment and Performance Improvement Plan and submit a copy to the Network (Due: November 2, 2009) Implement QAPI plan and revise as necessary during the project Monitor your facility’s progress towards achieving the goal Participate in monthly conference calls Scheduled for the last Wednesdays of the month at 2pm
 Implement QAPI plan and revise as necessary during the project Monitor your facility’s progress towards achieving the goal Participate in monthly conference calls Scheduled for the last Wednesdays of the month at 2pm")
56
Project Summary and Expectations: Follow project timelines/due dates Submit requested documents Facility Manager Acknowledgement Letter (Due: August 26, 2009) Environmental Scan (Due: August 26, 2009) Medical Director Acknowledgement Letter (Due: September 9, 2009) QAPI Plan – Signed by the Medical Director (Due: November 2, 2009) Other requested documents during the project
 Environmental Scan (Due: August 26, 2009) Medical Director Acknowledgement Letter (Due: September 9, 2009) QAPI Plan – Signed by the Medical Director (Due: November 2, 2009) Other requested documents during the project")
57
Resources Fistula First www.fistulafirst.org Network 18 www.esrdnetwork18.org The toolkit with resources will be mailed to your facilities next week. Please review them and use them as they pertain to your facility.

58
Project Communication: To communicate more efficiently with you about this project and to be more eco- friendly, we are creating a listserv of all the facilities in this project. In the past, we have had e-mail delivery problems with facility firewalls, please ensure you are able to receive e-mails from me about the project. Consult with your IT Department to assist you.

59
Lisle Mukai, RN Quality Improvement Coordinator ESRD Network 18 323-962-2020 lmukai@nw18.esrd.net

Similar presentations


 October.>")


