Download presentation
Presentation is loading. Please wait.

1
Select, Overlay, Explore; Multidimensional data Maintain Distributed Data; Heterogeneous coding, access Connect providers to users; Homogenize data access Voyager Data Federation Services Built and Used by a Virtual Community Layered Map Time Chart ProvidersUsers Vector GIS Data XDim Data SQL Table OLAP Web Images Voyager Federation Web Services Publish, Find, Bind Data & Tool Catalog Uniform Access/Retrieval Scatter Chart

2
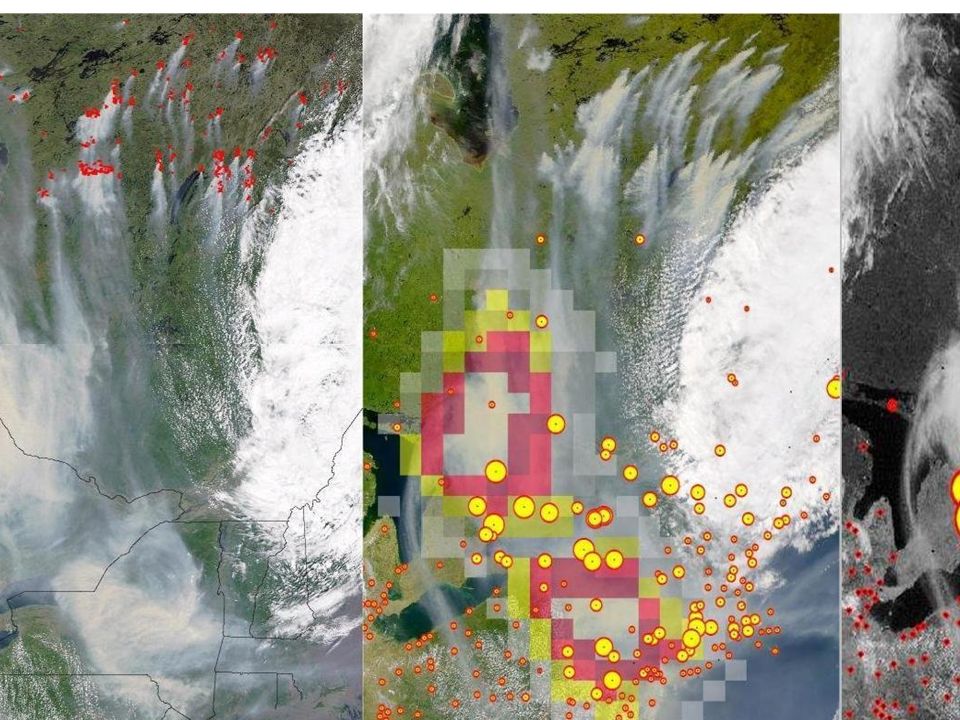
Overlaying Fire Locations, PM2.5, SewWiFS PM2.5 data from the IMPROVE and AIRS database at Colorado State (VIEWS) CIRA ColoState-VIEWS European Space Agency Generic Map Server NASA SeaWiFS Project CAPITA SeaWiFS AOT FEDERATED DATA SOURCES: Fire locations from European Space Agency (Project IONIA) Reflectance image from NASA SeaWiFS Project
 CIRA ColoState-VIEWS European Space Agency Generic Map Server NASA SeaWiFS Project CAPITA SeaWiFS AOT FEDERATED DATA SOURCES: Fire locations from European Space Agency (Project IONIA) Reflectance image from NASA SeaWiFS Project")
3
The Dvoy Project DVOY is Federated Information System for heterogeneous, multidimensional datasets Voyager is a generic graphic browser for the federated DVOY data. The initial Dvoy infrastructure is being developed at CAPITA, with NSF supportDvoy Further services for data access, processing and viewing are expected from the community The project evolution is to ride 'web services wave‘ of the Internet CAPITA projects which use DVOY: –NSF ITRWorkgroup Collaboration Tool:Aug 2001 - Aug 2004 –EPA Web-based Visibility:Aug 2001 - Apr 2003 –NOAAASOS Visibility:Sep 2001 - Sep 2002 –MARAMAChemical Trajectory Tool:Aug 2002 - July 2003 –EPA OAQPS Global Transport Analysis:Nov 2002 – Oct 2003 –NSF DigiGov Fire and Smoke Network :May 2003 – Apr 2006 Pending –NASA ESE Satellite Appl. to PM Management :June 2003 – May 2008 Pending In-kind support by organizations participating in DVOY-based federated data sharing Collaborators/Partners: CIRA (Schichtel), NRL(Westphal), NASA (Goddard)…many data sources. CAPITA cast: R. Husar, S. Falke, K. Hoijarvi, J. Colson, R. Zager)
, NRL(Westphal), NASA (Goddard)…many data sources. CAPITA cast: R. Husar, S. Falke, K. Hoijarvi, J. Colson, R. Zager).")
4
RPO Data Sharing Management of visibility and PM requires coordination among local, state, regional and and federal agencies. data collection data analysis forecasting/modeling communication to managers and the public. A Federated PM Data Sharing Network could augment the dedicated RPO efforts, e.g VIEWS. identify and fill data gaps incorporate new data such as satellite imagery use community efforts to prepare summary/assessments present summary/assessments to managers and the public

5
Federated Information System Data producers maintain their own workspace and resources (data, reports, comments). However, part of the resources are shared through a Federated Information System. Web-based integration of the shared resources can be across several dimensions: Planned data sharing federations: Open GIS Consortium (GIS data layers) NASA SEEDS network (Satellite data) NSF Digital Government EPA’s National Env. Info Exch. Network. VIEWSRPO NASA NAAPS RPO Federated Data System Data, Tools, Methods SharedPrivate RPO Other Federations Applications PM Policy Regulation Mitigation
 NASA SEEDS network (Satellite data) NSF Digital Government EPA’s National Env. Info Exch. Network. VIEWSRPO NASA NAAPS RPO Federated Data System Data, Tools, Methods SharedPrivate RPO Other Federations Applications PM Policy Regulation Mitigation.")
6
Render Service Chaining in Spatio-Temporal Data Browser Spatial Slice Find/Bind Data Data Cube Time Slice Time Portrayal Spatial PortrayalSpatial Overlay Time Overlay OGC-Compliant GIS Services Time-Series Services PortrayOverlay Homogenizer Catalog Wrapper Mediator Client Browser Cursor/Controller Maintain Data Vector GIS Data XDim Data SQL Table OLAP Satellite Images Data Sources

7
Multi-Dimensional Data Model Data can be distributed over 1,2, …n dimensions 1 Dimensional e.g. Time dimension i j k j i Data Granule i 1 Dimensional e.g. Location & Time 1 Dimensional e.g. Location, Time & Parameter View 1 Data Space View 2 Views are orthogonal slices through multidimensional data cubes Spatial and temporal slices through the data are most common

8
Web Services Components and Actions Service providers publish services to a service broker. Service users find the needed service and get access key from a service broker With the access key, users bind to the service provider The result is a dynamic binding mechanism between the service users and providers Service Broker Service Provider Publish Find Bind Service User Components:Provider – User – Broker Actions: Publish – Find - Bind

9
Web Publish HTTP, FTP Data Access though a Web Service Adapter Service Cataloger Service Consumer Ordinary web content can be delivered as a Web Service through a Proxy Server. The Wrapper Service converts HTTP/FTP service to XML Web service The Wrapper Service is published as a web service to the Broker The User finds the service from the broker and accesses the Wrapper to use the service Service Wrapper HTTP/FTP Service User Chain Find UDDI, WSDL Publish UDDI, WSDL Access SOAP, XML

10
Interoperability through a Layered Protocol Stack Web Services are implemented on a layered stack of technologies and standards The lower layers enable binding and exchange of messages; higher levels enable interoperability Applications are formed dynamically from distributed components through publish-find-bind mechanisms TCP/IP, HTTP, FTP ASCII, XML, etc. HTML, XML OGC -GML OGC Coverage, CoordTransfom, WMS HTTP, SOAP WSDL UDDI OGC Catalog WSFL, XLANG Standards Interoperability Comm. Protocols Data Encoding Data Schema Data Binding Web Service Service Integr. Service Discovery Service Descript. Connectivity

11
Architecture of Dvoy Federated Information System The main software components of Dvoy are wrappers, which encapsulate sources and remove technical heterogeneity, and mediators, which resolve the logical heterogeneity (e.g. Busse et. al., 1999). Wrapper classes are available for geo-spatial (incl. satellite) images, SQL servers, text files,etc. The mediator classes are implemented as web services for uniform data access to n-dimensional data.
. Wrapper classes are available for geo-spatial (incl. satellite) images, SQL servers, text files,etc. The mediator classes are implemented as web services for uniform data access to n-dimensional data..")
12
Features of the DVOY XML Web Service Architecture Interoperability: Platform and language independence; based on Web Services (XML,SVG) Legacy Support: Encapsulating existing data and exposing them as Web Services. (Access to standard HTTP/FTP servers) Just-in-time integration: Discovery, access to and ad-hoc chaining of services. (Future: Agile application building) DVOY draws on three basic web services: DataCatalogWrapping service is for data registration, finding and wrapping information DataAccess service provides uniform access to heterogeneous, distributed, multidim. data DataPortrayal service prepares input data in form suitable for rendering
 Just-in-time integration: Discovery, access to and ad-hoc chaining of services. (Future: Agile application building) DVOY draws on three basic web services: DataCatalogWrapping service is for data registration, finding and wrapping information DataAccess service provides uniform access to heterogeneous, distributed, multidim. data DataPortrayal service prepares input data in form suitable for rendering.")
13
Current DVoy User Interface Components Catalog: User selects among distributed ‘wrapped’ data Map View: Displays Selected Data Control Panel: Provides user with facilities to customize display NOTE: The data sources are physically located on multiple databases across the country (NASA SQL, CIRA SQL, NOAA SQL …) Terry, the powerplant data could be handled in a similar fashion from the EPA Oracle database
 Terry, the powerplant data could be handled in a similar fashion from the EPA Oracle database")
14
MARAMA/NESCAUM/LADCO Project: MARAMA/NESCAUM/LADCO Project: Source Apportionment of Air Quality Monitoring Data: Paired Aerosol / Trajectory Database Analysis Tool Development R. Husar, K. Hoijarvi, J. Colson, S. Falke, CAPITA Project Officer, Serpil Kayin, MARAMA Project Period: September 2002 – July 2003 Notes for Workshop on: Trajectories and Source Apportionment October 22, 2002 Trajectories and Source Apportionment

15
Background Establishing aerosol source-receptor relationship relies on many different techniques, including chemical fingerprinting, source apportionment and and meteorological back-trajectory analysis. Source attribution results (PMF and UNMIX) for 16 receptor sites between Illinois and New England using IMPROVE and CastNet data have been completed by a previous project, Source Apportionment Analysis of IMPROVE and Castnet Data.Source Apportionment Analysis of IMPROVE and Castnet Data Gridded back-trajectory data for the 16 sites and about 1000 sample days, calculated as “hours per 80 x 80 km grid cell”, provided by Paul Wishinski, VT DEC, based on ATAD trajectories calculated for the IMPROVE/CASTNET sites by Kristi Gebhart, CIRA.. The goal of the current project is to transfer the chemical and trajectory data into a relational database and to develop a data query and analysis tool for the combined datasets.
 for 16 receptor sites between Illinois and New England using IMPROVE and CastNet data have been completed by a previous project, Source Apportionment Analysis of IMPROVE and Castnet Data.Source Apportionment Analysis of IMPROVE and Castnet Data Gridded back-trajectory data for the 16 sites and about 1000 sample days, calculated as hours per 80 x 80 km grid cell , provided by Paul Wishinski, VT DEC, based on ATAD trajectories calculated for the IMPROVE/CASTNET sites by Kristi Gebhart, CIRA.. The goal of the current project is to transfer the chemical and trajectory data into a relational database and to develop a data query and analysis tool for the combined datasets..")
16
Trajectory Tools Project Options VIEWS Database Compatibility Make the chemical-trajectory exploration tool compatible with the evolving VIEWS database at CIRA, Colorado State U.: –insuring consistency of the data base schema –query tools compatibility –data presentation compatibility Dynamic Trajectory Aggregation Online filtering and aggregation of trajectory data –ad hoc gridding, contouring at arbitrary grid resolution –alternative rendering, e.g. trajectory bundles, instead of residence time contours

17
Data Input: PMF and UNMIX Model Results The results of the Battelle/Sonoma modeling project are source profiles and time series for each source contribution at each location Prepared by Battelle and Sonoma Tech. Inc. Source attribution results (PMF and UNMIX) for 16 receptor sites between Illinois and New England using IMPROVE and CastNet data have been completed by a previous project.previous project
 for 16 receptor sites between Illinois and New England using IMPROVE and CastNet data have been completed by a previous project.previous project.")
18
Biomass Smoke Avg. Mass:2.4 ug/m3 (32%) Species:OC, EC, S, K Summer Maximum East Coast Residual Oil Avg. Mass:0.38 ug/m3 (5%) Species: OC, EC, S, Si, Ni, V Winter Maximum Secondary Coal Avg. Mass:3.2 ug/m3 (42%) Species: S, OC, EC, Na Summer Maximum Combining Chemical Fingerprints and Transport, Lye Brook, NH Aerosol Source Type and Transport Origin Analysis Wishinski and Poirot (2002) Based on Positive Matrix Factorization, PMF results from B. Coutant and ATAD trajectories from K. Gebhart
 Species:OC, EC, S, K Summer Maximum East Coast Residual Oil Avg. Mass:0.38 ug/m3 (5%) Species: OC, EC, S, Si, Ni, V Winter Maximum Secondary Coal Avg. Mass:3.2 ug/m3 (42%) Species: S, OC, EC, Na Summer Maximum Combining Chemical Fingerprints and Transport, Lye Brook, NH Aerosol Source Type and Transport Origin Analysis Wishinski and Poirot (2002) Based on Positive Matrix Factorization, PMF results from B. Coutant and ATAD trajectories from K. Gebhart.")
19
Back-trajectory for temporal peak PMF Cluster Trends Airmass history during the PM25 peak. Smoke? PMF cluster data eliminated during the C. American smoke. Why?

20
Seasonal Residence Time e.g. Sum ResTime for Loc=LYBR, Date between June-Sept Lye Brook, DJF Gr Smoky Mtn, JJA Lye Brook, JJA Gr Smoky Mtn, JJA

21
Transport Pattern Filtered by Chemical ‘Source’ LYE BROOK, PMF Source C6 Sulfate, Titanium Transport During High C6 Chemical Conditions Transport During Low C6 Chemical Conditions

22
Chemical-Trajectory Project Summary December – Initial feedback

23
Possible Project: Real-Time Aerosol Watch System Real-Time Virtual PM Monitoring Dashboard. A web-page for one-stop access to pre-set views of current PM monitoring data including surface PM, satellite, weather and model data. Virtual Workgroup Website. An interactive website which facilitates the active participation of diverse members in the interpretation, discussion, summary and assessment of the on-line PM monitoring data. Air Quality Managers Console. Helps PM managers make decisions during major aerosol events; delivers a subset of the PM data relevant to the AQ managers, including summary reports prepared by the Virtual workgroups.

24
wind directionback trajectoriestemperatureNAAPS modelPM/Bext time seriesBext contoursPM2.5 contoursweb cam Real-time PM Monitoring Dashboard Example Views – Selected from Dozens of spatial, temporal, height cross-sections satellite image

26
Quebec Fires, July 6, 2002 SeaWiFS, METAR and TOMS Index superimposed SeaWiFS satellite and METAR surface haze shown in the Voyager distributed data browser Satellite data are fetched from NASA GSFC; surface data from NWS/CAPITA servers

27
Trans-Atlantic Transport of Quebec Smoke July 11: Smoke approaching Europe July 10: Quebec smoke over Mid- Atlantic SeaWiFS Reflectance TOMS Absorbing Aerosol SeaWiFS Reflectance TOMS Absorbing Aerosol Spain E. US

28
Browsing of Distributed Data from HTTP/FTP Servers Land Reflectance from SeaWiFS Project, NASA GSFC AVHRR Oceanic Aerosol CAPITA, WashU, STL Fire Pixels, Jan 1997, ESA Ionia Project

29
Voyager Spatio-Temporal Data Browser

30
NRL Forecast Model for Dust, Smoke and Sulfate METAR Surface Haze Real-time model and surface observations are compared spatially and temporally Dust Sulfate Smoke METAR Haze Time Selector

31
Idaho Fires Example (August 2000) ASTR Fire Locations Processed SeaWiFS image showing aerosol optical depth Derived aerosol optical depth provides a focused look at smoke dispersion The SeaWiFS reflectance image is hidden to expose the aerosol optical depth image ‘below’ it
 ASTR Fire Locations Processed SeaWiFS image showing aerosol optical depth Derived aerosol optical depth provides a focused look at smoke dispersion The SeaWiFS reflectance image is hidden to expose the aerosol optical depth image ‘below’ it")
32
Overlay of multiple Datasets Each DataCube may have 0-n dimensions Each dimension is assigned a view In a view, the number of layers is the number of datasets If a DataCube does not have a data for a view, a Null Layer is assigned 3 D DataCube 2 D DataCube DataView 3 Layer 2 Layer 1 DataView 1 DataView 2 Null Layer

Similar presentations


, compared to gases (blue): –Spatial dimensions (X, Y, Z) –Temporal Dimensions (T)>")


 Prepared by Stefan Falke Rudolf Husar Bret Schichtel June 2000.>")


 Web Services>")


