Download presentation
Presentation is loading. Please wait.

1
Non-classical phase behavior and partitioning of Anionic surfactant
Aparna Raju Sagi

2
Contents Classical phase behavior (Winsor)
Non-classical phase behavior Hypothesis Method of analysis Results

3
Classical phase behavior (Winsor)
Ref: R.N.Healy et.al 1976 Increasing salinity Type I Type II Type III Initial o/w int This is the picture of surfactant salinity scan from Healy et.al 1976, that shows a classical Winsor type phase behavior At low salinities a oil in water microemulsion is in eq. with excess oil phase – this is called type I. At high salinities w/o microemulsion is in eq. with excess water phase this is called type II. At intermediate salinities, a bicontinuous o-w microemulsion is in eq. with excess water and oil phases – called Type III. The scan represented as a phase map, with normalized phase volumes plotted as a function of salinity. Type I having microemulsion with excess oil, Type 2 with microemulsion with excess brine, and type 3 with microemulsion with excess oil and brine. With increasing salinity the amount of oil in the microemulsion phase increases, leading to a corresponding decrease in the interfacial tension between the microemulsion and oil phase. Oil solubilization parameter defined as the volume of oil to the volume of surfactant in the microemulsion phase is a good indicator for IFT. As given by Huh’s correlation, IFT is inversely proportional to oil solubilization parameter. As IFT measurements are time consuming, many times, oil solubilization parameter is used as an indicator of low IFT. Rule of thumb >10. σo = Vs Vo Ɣom = σo2 C Huh’s correlation

4
Non-classical phase behavior
2 wt% (aq.) TDA-13 (isotridecyl alcohol 13 PO sulfate Type I Type II Drop in apparent oil solubilization before transitioning to Winsor Type II ? Mixed for 1 day; standing for 11 days This is a system that exhibits non-classical phase behavior. It is a salinity scan of 2wt% TDA-13 isotridecyl alcohol-13 PO sulfate, with a brine called Br2 – which has ~11000ppm TDS and ~1700ppm divalence. The salinity in the system is increased as multiples of brine 2 from 0 to 1. From 0 to 0.8 you can see oil solubilized in a o/w microemulsion. We will call this Type 1. At 0.9 and 1 we have excess brine in equilibrium with a macroemulsion and w/o microemulsion. We call this Type 2. This is the phase map of the system. Note that we do not have a Type 3 middle phase microemulsion like in the classical Winsor system. More importantly note that the amount of oil solubilized in the microemulsion phase in the Type I region drops before the system transitions to a Type 2. Brine 2 (Br2) ~11,000 ppm TDS; ~1,700ppm (Ca+Mg)
 TDA-13 (isotridecyl alcohol 13 PO sulfate. Type I. Type II. Drop in apparent oil solubilization before transitioning to Winsor Type II Mixed for 1 day; standing for 11 days. This is a system that exhibits non-classical phase behavior. It is a salinity scan of 2wt% TDA-13 isotridecyl alcohol-13 PO sulfate, with a brine called Br2 – which has ~11000ppm TDS and ~1700ppm divalence. The salinity in the system is increased as multiples of brine 2 from 0 to 1. From 0 to 0.8 you can see oil solubilized in a o/w microemulsion. We will call this Type 1. At 0.9 and 1 we have excess brine in equilibrium with a macroemulsion and w/o microemulsion. We call this Type 2. This is the phase map of the system. Note that we do not have a Type 3 middle phase microemulsion like in the classical Winsor system. More importantly note that the amount of oil solubilized in the microemulsion phase in the Type I region drops before the system transitions to a Type 2. Brine 2 (Br2) ~11,000 ppm TDS; ~1,700ppm (Ca+Mg)")
5
Hypothesis Surfactant is not in a single microemulsion phase. It distributes between the aqueous and oil phases. Preferential partitioning The more lipophilic components of the polydisperse surfactant are partitioning preferentially into the oil. (OR) The surfactant components partition in the same proportion as in the original surfactant. The first hypothesis was that, the reason for the drop in oil solubilization is because the surfactant is not all in a single pahse, and it is distributing between the aq and oil pahses. The second hypothesis was with regard to preferential paritioning The surfactant used is not a signle species, but a distribution of species with an average of 13 PO groups. Could the more lipophilic species be partitioning preferentially into the oil phase. Or are the species partitioning in the same proportion as in the original surfactant.
 The surfactant components partition in the same proportion as in the original surfactant. The first hypothesis was that, the reason for the drop in oil solubilization is because the surfactant is not all in a single pahse, and it is distributing between the aq and oil pahses. The second hypothesis was with regard to preferential paritioning. The surfactant used is not a signle species, but a distribution of species with an average of 13 PO groups. Could the more lipophilic species be partitioning preferentially into the oil phase. Or are the species partitioning in the same proportion as in the original surfactant.")
6
Method of analysis - HPLC
C18 25 °C ACN/DI gradient elution 40/60/80 %ACN in 0/60/80 min. 1ml/min flow rate 50µl sample size ELSD 60 °C To answer this, the lower phases of the system, were analyzed by HPLC, usin a C18 25C. Acetonitrile DI water gradient elution method was used, with at 40% CAN, and increasing linearly to 60 and 80% CAN by 60 and 80min respectively. The effluent from HPLC was analyzed by ELSD detector maintained at 60C

7
Effect of divalent ions on elution time
This is the chromatogram of the surfactant in DI water, given by the elsd signal as a function of the elution time. The more hydrophilic components elute first and the more lipophiolic components elute out at higher ACN concentration. The chromatogram of the surfactant in NaCL brine of equivalent ionic strength as brine 2 matches that with DI water. But the chromatogram of the surfactant with Brine 2 is drastically different, with the components eluting out at a much later time of higher ACN concentration. This has been attributed to the formation of surfactant dimers with the divalent ions, resulting in a more lipophilic species which elutes out later.

8
EDTA is only partially effective
n = moles of (Ca+Mg) in Br2. We decided to use EDTA which is a good complexing agent that compelxes with Ca and Mg in a 1:1 stoichiometry. When EDTA was added in twice the amount of moles of Ca and Mg, we recovered only a few peaks of the chromatogram. When we increased the EDTA concentration to 4 times the moles of ca and Mg, we recovered a few more peaks. While EDTA chelating ability in aqueous media is known to be very good, in non-aqueous media of 40% ACN it seems to be poor.
 in Br2. We decided to use EDTA which is a good complexing agent that compelxes with Ca and Mg in a 1:1 stoichiometry. When EDTA was added in twice the amount of moles of Ca and Mg, we recovered only a few peaks of the chromatogram. When we increased the EDTA concentration to 4 times the moles of ca and Mg, we recovered a few more peaks. While EDTA chelating ability in aqueous media is known to be very good, in non-aqueous media of 40% ACN it seems to be poor.")
9
Citrate recovers most of chromatogram
n = moles of (Ca+Mg) in Br2. We then used citrate as a complexing agent. We recover most of the peaks with citrate at twice the concentration of divalvent ions. And at 4 times the divalent ion concentration the improvement is only marginal. The last few peaks are not recovered with this method. An improvement over this method was later developed where we could recover all the peaks of the chromatogram, but will not be discussed in this talk. The samples in this talk were analyzed with 4n citrate.
 in Br2. We then used citrate as a complexing agent. We recover most of the peaks with citrate at twice the concentration of divalvent ions. And at 4 times the divalent ion concentration the improvement is only marginal. The last few peaks are not recovered with this method. An improvement over this method was later developed where we could recover all the peaks of the chromatogram, but will not be discussed in this talk. The samples in this talk were analyzed with 4n citrate.")
10
Surfactant partitions between lower and upper phases
Lower phases of Br2 were analyzed by HPLC for total surfactant concentration Csaq > Cso Cso > Csaq Type I Type II The lower phases of the samples from 0.2 to 0.8 Br2 were analyzed, and based on the area under the chromatograph, the surfactant concentration of the phase was determined. Based on the concentration and the volume of the phase, the moles of surfactant in the lower phase normalized to the total moles of surfactant in the sysmtem was calculated, and is plotted here as a function of salinity. you can see the amount of surfactant in the lwoer phase is decreasing with icnreasing salinity while still in the Type I region. 0.8 Br2 which looks like a lower phae microemulsion in the picture has only 25% of the total surfactant, the rest is in the upper phase. based on concentrations, we can plot the partition coefficient, which increases as a function of salinity.

11
Underestimation of apparent oil solubilization parameter in Type I
Before mixing After mixing Vo Classical Type I Vo Non-classical Type I(?) Initial o/w int σo = Vs Vo Classical Type I all surfactant is in a single microemulsion phase. Excess oil phase doesn’t contain any water Non-classical Type I(?) Surfactant is distributed between two phases. Excess oil phase contains water solubilizes by the surfactant. How does this effect the interpretation of oil solubilization parameter, which as I discussed before is used as an indicator for IFT. Typically oil solubilization is calculated as follows. We know the initial o/w interface before mixing the sample. After mixing and allowing the sample to stand for a few days, we can caculate the amount of oil in the microemulsion phase based on the change in the o/w interface level. This holds good under the assumption that no water is there in the excess oil phase. Also we assume that all the surfactant is in the microemulsion phase However, in the non-classical Type I like in this system, if we measure the amount of oil in the microemulsion phase based on the change in itnerface, we are underestimating it, because the oil phase now has water solubilized in it due to the presence of surfactant in it. So we are underestimating Vo. Also if we go by the classical definition and assume all the surfactant is in the microemulsion phase, we are overestimating the denominator as we know that all surfactant is not in the microemulsion hase. So by udnerestimating the numerator and overestimating the denominator by using the traditional method for caculating oil solubilization parameter, we are udnerestimating the oil solublization parameter. This is important, necause we observed that in a similar system, with a oil solublization parameter of 8, which is considered to be onl the lower side, we still got good oil recoevry of ~ 80%.
 Initial o/w int. σo = Vs. Vo. Classical Type I. all surfactant is in a single microemulsion phase. Excess oil phase doesn’t contain any water. Non-classical Type I( ) Surfactant is distributed between two phases. Excess oil phase contains water solubilizes by the surfactant. How does this effect the interpretation of oil solubilization parameter, which as I discussed before is used as an indicator for IFT. Typically oil solubilization is calculated as follows. We know the initial o/w interface before mixing the sample. After mixing and allowing the sample to stand for a few days, we can caculate the amount of oil in the microemulsion phase based on the change in the o/w interface level. This holds good under the assumption that no water is there in the excess oil phase. Also we assume that all the surfactant is in the microemulsion phase. However, in the non-classical Type I like in this system, if we measure the amount of oil in the microemulsion phase based on the change in itnerface, we are underestimating it, because the oil phase now has water solubilized in it due to the presence of surfactant in it. So we are underestimating Vo. Also if we go by the classical definition and assume all the surfactant is in the microemulsion phase, we are overestimating the denominator as we know that all surfactant is not in the microemulsion hase. So by udnerestimating the numerator and overestimating the denominator by using the traditional method for caculating oil solubilization parameter, we are udnerestimating the oil solublization parameter. This is important, necause we observed that in a similar system, with a oil solublization parameter of 8, which is considered to be onl the lower side, we still got good oil recoevry of ~ 80%.")
12
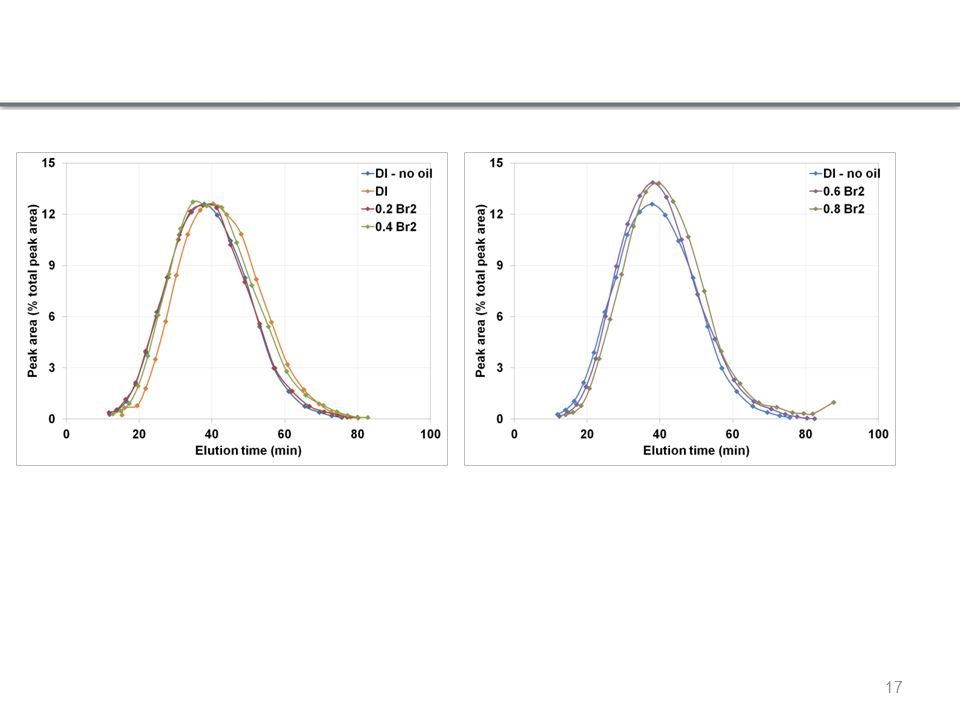
HPLC of aqueous solutions before contacting with oil
HPLC of lower phases after equlibrating with oil -

13
Conclusion Surfactant partitioning between aqueous and oil phase was observed. This explains the reduction in oil solublization in Type I region before transitioning into Type II. This results in underestimating the oil solubilization parameter in the Type I region. Preferential partitioning of the more lipophilic components doesn’t seem to occur.

14
QUESTIONS

15
Modified citrate method

16
HPLC of aqueous solutions before contacting with oil
HPLC of lower phases after equlibrating with oil

Similar presentations


, 7, 8-1, 17, and parts of 22 (up to and including retention.>")
, 7, 8-1, 17, and parts of 22 (parts in today’s lecture.>")


