Download presentation
Presentation is loading. Please wait.

1
Chuck Brock NOAA Earth System Research Lab, Chemical Sciences Division Arctic Air Pollution: Observational Advances and Needs (focus on aerosols) photo by Eric James/NASA
 photo by Eric James/NASA")
2
Browse et al., ACP, 2012 Four types of pollution aerosols found during airborne studies Arctic Boundary Layer: Long residence time circulating at low altitude over the Arctic Ocean interacting with surface Background: Pollutants emitted directly into the "polar dome"; long residence time Biomass Burning and Anthropogenic layers: emissions from lower latitudes transported with good efficiency (minimal scavenging)
")
3
Recent Airborne Projects ARCTAS (NASA etc.) – gases, aerosols, clouds, radiation ARCPAC (NOAA etc.) – gases, aerosols, clouds, radiation ISDAC (Env. Canada, US DOE etc.) – clouds and aerosols POLARCAT (EU) – aerosols and gases YAK-AEROSIB (EU + Russia) – wildfire smoke ASTAR – clouds and aerosols PAM-ARCMIP NETCARE Project descriptions and summary of findings in Law et al., BAMS (2014). In these project, new instrumentation and integration of gas-phase measurements, aerosol measurements, and modeling has greatly increased quantification of sources, chemistry DRF, cloud nucleating ability, etc.
 – clouds and aerosols POLARCAT (EU) – aerosols and gases YAK-AEROSIB (EU + Russia) – wildfire smoke ASTAR – clouds and aerosols PAM-ARCMIP NETCARE Project descriptions and summary of findings in Law et al., BAMS (2014). In these project, new instrumentation and integration of gas-phase measurements, aerosol measurements, and modeling has greatly increased quantification of sources, chemistry DRF, cloud nucleating ability, etc..")
4
But... Intensive airborne observations provide only snapshots Hard to quantify key processes (deposition rates, scavenging efficiency, transport rates in/out) Hard to link short-term observations with surface climatology—are we looking at the same air? Are we making the right measurements at the right locations and times to effectively constrain models (which are our primary climate assessment tool)? Are we optimally linking our measurements with satellite observations? Airborne projects are affected by technological, logistical and timing/funding constraints that can make them less than optimal for the effort/cost.
 Hard to link short-term observations with surface climatology—are we looking at the same air. Are we making the right measurements at the right locations and times to effectively constrain models (which are our primary climate assessment tool). Are we optimally linking our measurements with satellite observations. Airborne projects are affected by technological, logistical and timing/funding constraints that can make them less than optimal for the effort/cost..")
5
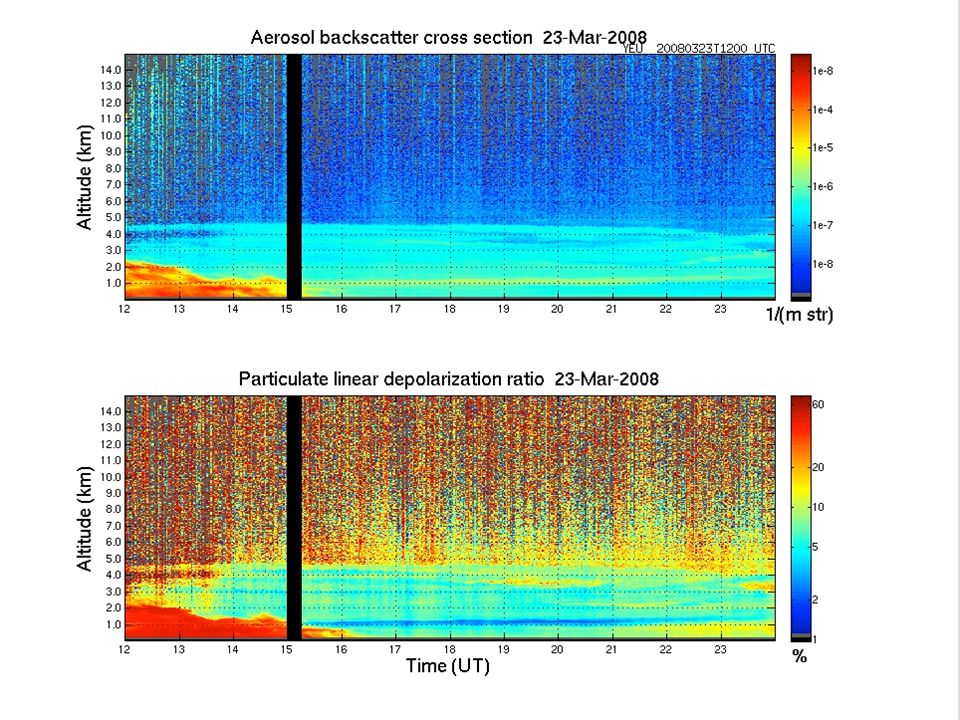
D. Lack, NOAA and CIRES, Univ. of Colorado How do we relate observations of events like this to long-term surface measurements and global models?

6
moist inversion layer in lowest ~400 m O 3 depleted; CO slightly below 160 ppbv background aerosol absorption & extinction decrease black carbon & particle volume decrease no shift in size; just decrease in number Vertical structure: Profile at 75 o N on 2008/04/12 Surface chemistry decoupled from atmosphere aloft

7
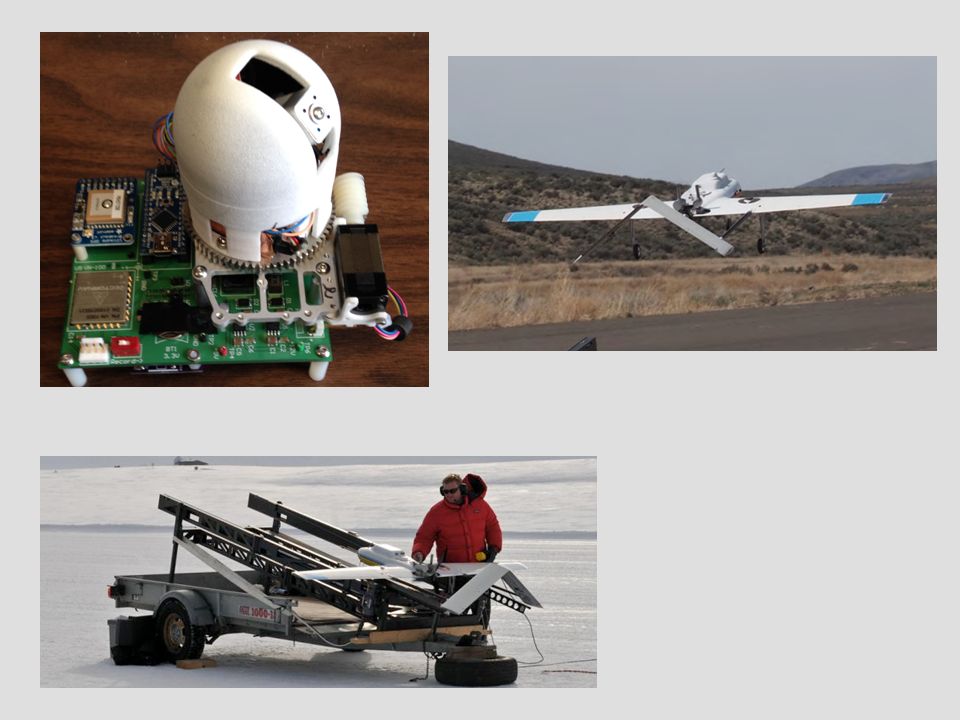
Key Observational Needs (for aerosols) Routine vertical profiles of important aerosol properties Location/timing guided by model sensitivity Unpiloted Aerial Vehicles (UAVS) Routine small aircraft profiles (J. Ogren) Climatological surveys as part of larger program--Systematic Aircraft Measurements to Characterize Aerosol Air Masses (SAM- CAAM) proposed by Ralph Kahn High spectral resolution lidars with polarization
 Climatological surveys as part of larger program--Systematic Aircraft Measurements to Characterize Aerosol Air Masses (SAM- CAAM) proposed by Ralph Kahn High spectral resolution lidars with polarization.")
8
NOAA PMEL Manta UAS Ceiling: 3.7 km Speed 26 m s −1 Endurance: 4.5 h Payload: 5.5 kg Payload Aerosol Absorption Photometer Printed Optical Particle Spectrometer Condensation Particle Counter Printed Scanning Radiometer Filter Sampler 25 cm

10
Concept SAM-CAAM Concept [Systematic Aircraft Measurements to Characterize Aerosol Air Masses] Dedicated Operational Aircraft – routine flights, 2-3 x/week, on a continuing basis Sample Aerosol Air Masses accessible from a given base-of-operations, then move Focus on in situ measurements required to characterize particle optical properties, chemical type, and mass extinction efficiency (MEE) Primary Objectives: Interpret and enhance 14+ years of satellite aerosol retrieval products Characterize statistically particle properties globally to improve: -- Satellite aerosol retrieval algorithms -- The translation between satellite-retrieved aerosol optical properties and species-specific aerosol mass and size tracked in aerosol transport & climate models
![Concept SAM-CAAM Concept [Systematic Aircraft Measurements to Characterize Aerosol Air Masses] Dedicated Operational Aircraft – routine flights, 2-3 x/week, on a continuing basis Sample Aerosol Air Masses accessible from a given base-of-operations, then move Focus on in situ measurements required to characterize particle optical properties, chemical type, and mass extinction efficiency (MEE) Primary Objectives: Interpret and enhance 14+ years of satellite aerosol retrieval products Characterize statistically particle properties globally to improve: -- Satellite aerosol retrieval algorithms -- The translation between satellite-retrieved aerosol optical properties and species-specific aerosol mass and size tracked in aerosol transport & climate models](http://images.slideplayer.com/32/9886108/slides/slide_10.jpg "Concept SAM-CAAM Concept [Systematic Aircraft Measurements to Characterize Aerosol Air Masses] Dedicated Operational Aircraft – routine flights, 2-3 x/week, on a continuing basis Sample Aerosol Air Masses accessible from a given base-of-operations, then move Focus on in situ measurements required to characterize particle optical properties, chemical type, and mass extinction efficiency (MEE) Primary Objectives: Interpret and enhance 14+ years of satellite aerosol retrieval products Characterize statistically particle properties globally to improve: -- Satellite aerosol retrieval algorithms -- The translation between satellite-retrieved aerosol optical properties and species-specific aerosol mass and size tracked in aerosol transport & climate models")
11
Concept SAM-CAAM Concept [Systematic Aircraft Measurements to Characterize Aerosol Air Masses] Dedicated Operational Aircraft Dedicated Operational Aircraft – routine flights, 2-3 x/week, on a continuing basis Sample Aerosol Air Masses Sample Aerosol Air Masses accessible from a given base-of-operations, then move; project science team to determine schedule, possible field campaign participation Optical Properties Focus on in situ measurements required to characterize particle Optical Properties, Chemical TypeMass Extinction Efficiency Chemical Type, and Mass Extinction Efficiency (MEE) Process Data Routinely Process Data Routinely at central site; instrument PIs develop & deliver algorithms, upgrade as needed; data distributed via central web site 3-4 Payload Options White Paper to identify 3-4 Payload Options, of varying ambition; subsequent selections based on agency buy-in and available resources SAM-CAAM is feasible because: aerosol microphysical properties tend to be repeatable Unlike aerosol amount, aerosol microphysical properties tend to be repeatable from year to year, for a given source in a given season
![Concept SAM-CAAM Concept [Systematic Aircraft Measurements to Characterize Aerosol Air Masses] Dedicated Operational Aircraft Dedicated Operational Aircraft – routine flights, 2-3 x/week, on a continuing basis Sample Aerosol Air Masses Sample Aerosol Air Masses accessible from a given base-of-operations, then move; project science team to determine schedule, possible field campaign participation Optical Properties Focus on in situ measurements required to characterize particle Optical Properties, Chemical TypeMass Extinction Efficiency Chemical Type, and Mass Extinction Efficiency (MEE) Process Data Routinely Process Data Routinely at central site; instrument PIs develop & deliver algorithms, upgrade as needed; data distributed via central web site 3-4 Payload Options White Paper to identify 3-4 Payload Options, of varying ambition; subsequent selections based on agency buy-in and available resources SAM-CAAM is feasible because: aerosol microphysical properties tend to be repeatable Unlike aerosol amount, aerosol microphysical properties tend to be repeatable from year to year, for a given source in a given season](http://images.slideplayer.com/32/9886108/slides/slide_11.jpg "Concept SAM-CAAM Concept [Systematic Aircraft Measurements to Characterize Aerosol Air Masses] Dedicated Operational Aircraft Dedicated Operational Aircraft – routine flights, 2-3 x/week, on a continuing basis Sample Aerosol Air Masses Sample Aerosol Air Masses accessible from a given base-of-operations, then move; project science team to determine schedule, possible field campaign participation Optical Properties Focus on in situ measurements required to characterize particle Optical Properties, Chemical TypeMass Extinction Efficiency Chemical Type, and Mass Extinction Efficiency (MEE) Process Data Routinely Process Data Routinely at central site; instrument PIs develop & deliver algorithms, upgrade as needed; data distributed via central web site 3-4 Payload Options White Paper to identify 3-4 Payload Options, of varying ambition; subsequent selections based on agency buy-in and available resources SAM-CAAM is feasible because: aerosol microphysical properties tend to be repeatable Unlike aerosol amount, aerosol microphysical properties tend to be repeatable from year to year, for a given source in a given season")
13
Key Observational Needs Dry and wet deposition measurements Quantify flux and seasonality of black carbon Identify mechanism (ice nucleation/riming/dry deposition) Challenging measurements! Need measurements out on the ice? Snow sampling Broad spatial and temporal coverage Consistent, quantified methodology Separation of BC from other absorbing components

14
Open water leads and polynyas may be critical in determining both dry and wet deposition in the lower troposphere: Produce turbulence that mixes aerosol to the surface Moisture fluxes that lead to light precipitation Air parcels circulating over the Arctic may encounter many such leads

15
Conclusions Vertical distributions for climatology/model comparison New techniques for profiling-UAVs, lightweight/low cost instruments Repeated aircraft profiles Lidar profiling Which parameters are most important? Guide sampling locations/times by model sensitivity Broader, more consistent snow sampling Measurements to understand deposition process Other issues: Aerosol-cloud interactions Halogen chemistry (relevance to CC?) More VOC measurements
 More VOC measurements.")
19
Arctic Boundary Layer Background Anthropogenic- Fossil Fuel Anthropogenic- Fossil Fuel Biomass Burning Biomass Burning Frequency of Occurrence dV/dLog 10 D p (μm 3 cm -3 ) Arctic Boundary Layer Background Arctic Boundary Layer Anthropogenic-Fossil Fuel Fine Coarse Ion Balance Single Particle Number Fraction Particle Size Distribution Biomass Burning Fine Composition dN/dLog 10 D p (cm -3 ) Biomass Burning Anthropogenic-Fossil Fuel Background Barrow Observatory Arctic Boundary Layer
 Arctic Boundary Layer Background Arctic Boundary Layer Anthropogenic-Fossil Fuel Fine Coarse Ion Balance Single Particle Number Fraction Particle Size Distribution Biomass Burning Fine Composition dN/dLog 10 D p (cm -3 ) Biomass Burning Anthropogenic-Fossil Fuel Background Barrow Observatory Arctic Boundary Layer")
20
Shindell et al. ACP, 2008 Various Models Models show seasonal cycle in CO (although magnitude, phase can differ) Models do not show observed seasonal cycle in soot Soot is a potent climate forcing agent; it enhances atmospheric heating, and snowmelt if deposited to surface Disagreements between Models and Measurements in Arctic 1992-20062001 1996-1998 1989-2003 CO Black Carbon
 Models do not show observed seasonal cycle in soot Soot is a potent climate forcing agent; it enhances atmospheric heating, and snowmelt if deposited to surface Disagreements between Models and Measurements in Arctic CO Black Carbon.")
Similar presentations


 Close collaboration with Alfred Wegener Institute (Andreas.>")

 The International Global Atmospheric Chemistry Project A.>")

. Why TRMM? n Tropical Rainfall Measuring Mission (TRMM) is a joint US-Japan study initiated in 1997 to study.>")


 Date: March 29, 2000 Slide:1 Environmentally Conscious Design & Manufacturing Class 11: Air Quality.>")


 used for climate research and prediction.>")
 and.>")
