Download presentation
Presentation is loading. Please wait.

1
PDCWG Report to ROS January 13, 2011 Sydney Niemeyer

2
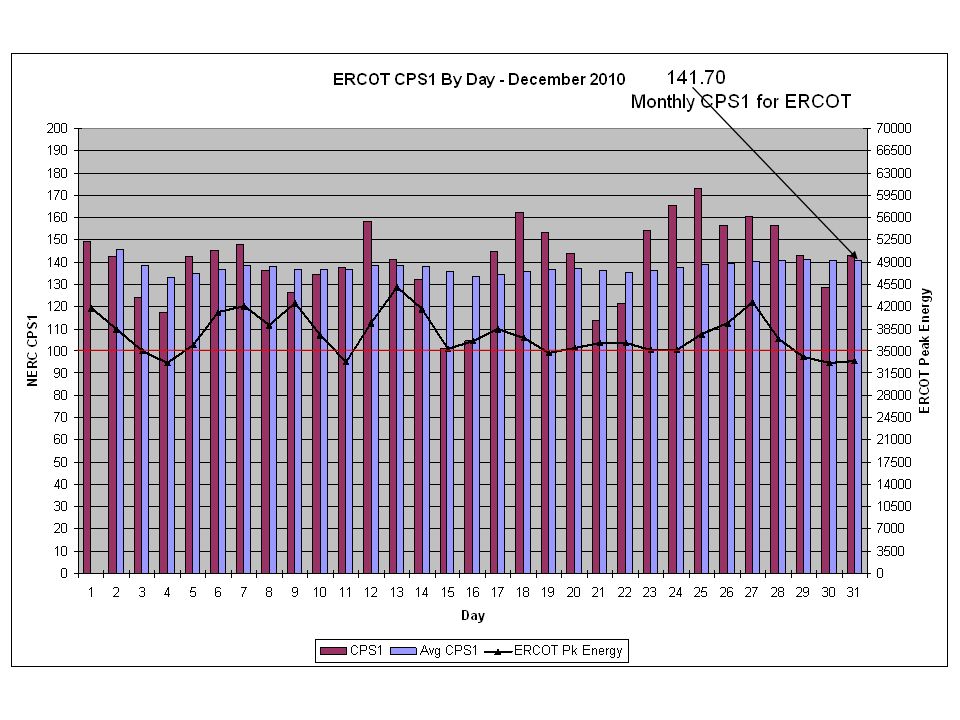
CPS1 = 141.7

8
ERCOT CPS1 Score CPS1 12 Month Rolling Average = 150.83

12
Same 600 MW unit with MW movement due to all frequency change each year.

13
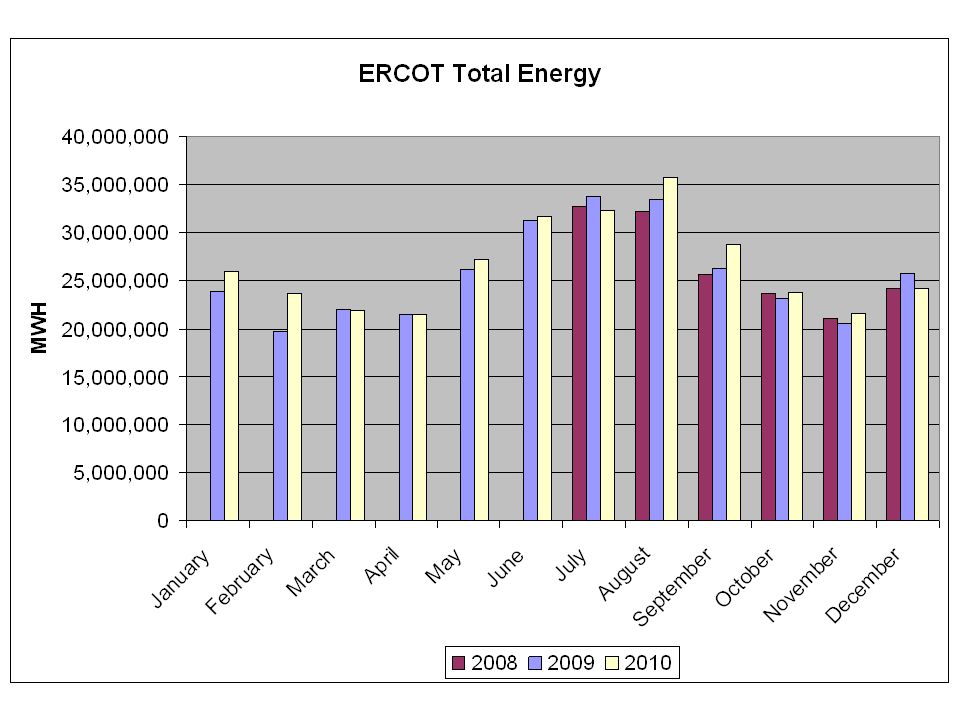
ERCOT Total Load and Wind Generation Data source not EPS quality. Confidence in data is good with some telemetry errors scrubbed. Next three slides for reference only.

15
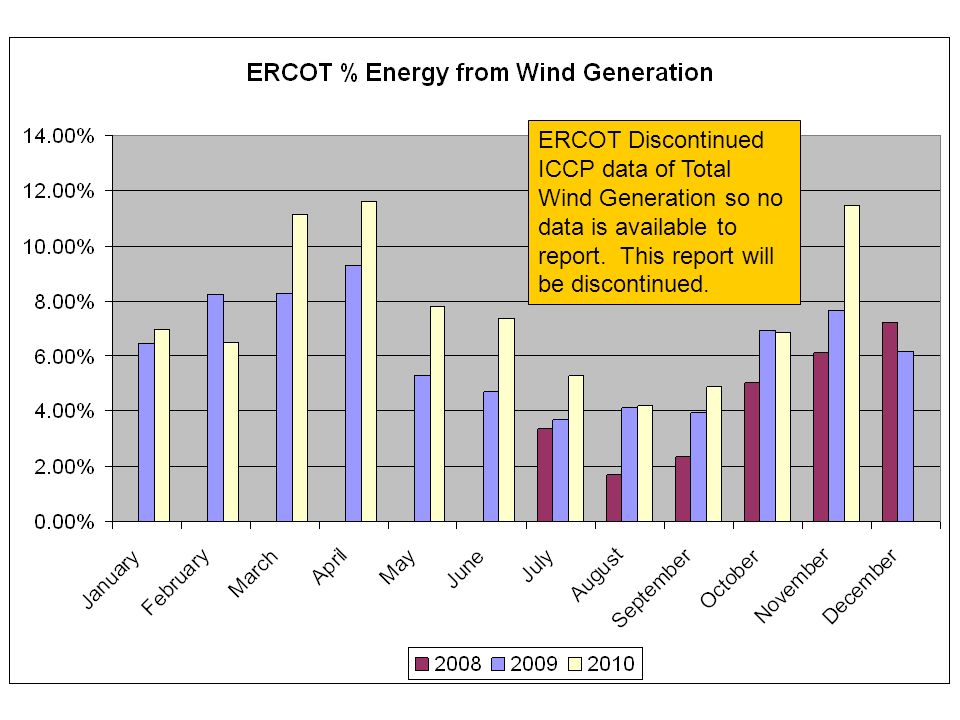
ERCOT Discontinued ICCP data of Total Wind Generation so no data is available to report. This report will be discontinued.

17
Frequency Event Evaluations ERCOT has developed a new Excel Spreadsheet to evaluate each generator’s performance during events. This is the first month that the PDCWG has used the spreadsheet to review an actual event while on Nodal dispatch. –We are slow at learning to navigate and still discovering what information would help speed the analysis. –The tool includes a graph of each generator’s actual generation, updated Base Point, frequency and Generator Expected Generation. The Expected Generation includes any Regulation Deployed and expected frequency response. –The graphs are clear and it is easy to determine if the generator delivered regulation, provided frequency response and followed their base points. –It contains all generators in ERCOT and it is difficult to determine which generators to look at. We will determine a method of identifying key players in each event. (similar to the summing of generator’s change in base points that I did for the 12-21-2010 low frequency event). This evaluates SCED’s performance as well. Reference slide 19 in this report.
. This evaluates SCED’s performance as well. Reference slide 19 in this report..")
18
Dec 21, 2010 22:06 Low Frequency Review Differences between Nodal and Zonal –In zonal, Responsive Reserve would have automatically deployed at 21:59 when frequency reached 59.910 Hz. Resources would have responded quickly to the schedule change in the SCE equation to deliver the RRS. Nodal only moved Resources based on LMP without the knowledge of the amount of MW Resources were ramping off line. Zonal SCPS 1 & 2 measured QSE performance while ramping generation on and off line while schedules and balancing deployments accounted for generation ramping off line. Regulation is deployed based on the frequency deviation. When SCED runs, it will adjust the Base Points to recover the deployed Regulation and accounts for forecasted load change.

19
Except for 22:02, SCED ran every minute between 21:59 and 22:08. (9 runs in 10 minutes). 91 198 322 691 872 1080 1312 1403 Generators with increasing Base Points had a total MW change in BP of 1403 MW beginning 21:59 on 25 different generators. Wind 65 MW and hydro generators about 175 MW BP change is included in total BP change. During the same time period load decreased about 550 MW. (21:59 to 22:08)
 Generators with increasing Base Points had a total MW change in BP of 1403 MW beginning 21:59 on 25 different generators. Wind 65 MW and hydro generators about 175 MW BP change is included in total BP change. During the same time period load decreased about 550 MW. (21:59 to 22:08).")
20
Wind generation to the rescue. Output increased 64 MW during the severe low frequency period.

21
Ideas to Consider Generators ramping off line could set HSL equal to their normal LSL when beginning to ramp down. Or lower their HSL in stages down to LSL. When operating below normal LSL during the shutdown process the LSL and HSL could be set to zero. –This would give SCED the information earlier to adjust other generator’s BP. Ramp rate differences could still be an issue (SCED Updated Base Point vs. actual unit shutdown ramp rate). SCED could include an adjustment for Load Dampening that would move Base Points faster to account for Load that has decreased due to low frequency or load that has increased due to high frequency. This value would ramp to zero as frequency returned to 60 Hz. The PDCWG has a formula to calculate this value in real time. Reference the 60 Hz load trend on the previous Load Graph.
. SCED could include an adjustment for Load Dampening that would move Base Points faster to account for Load that has decreased due to low frequency or load that has increased due to high frequency. This value would ramp to zero as frequency returned to 60 Hz. The PDCWG has a formula to calculate this value in real time. Reference the 60 Hz load trend on the previous Load Graph..")
22
Dec 22, 2010 High Frequency Event Out of Down Regulation. Off Line generation ramping to LSL similar to previous day’s low frequency event only opposite direction. SCED without ability to ramp the Units based on ramp rate due to ONTEST status of generators in start-up target MW. Please refer ERCOT Market Notice to mitigate this issue. Detailed analysis of each generator and SCED Base Point changes has not been completed at this time.

23
Sudden load drop at 04:47 was caused by non- conforming load change. Not a contributing cause but it did delay the recovery.

24
Wind generation increased about 150 MW during the high frequency period. This is not a major contributing cause but it did delay recovery.

25
PDCWG Meeting Jan 4, 2011 Frequency Event review –The PDCWG would like a SME from ERCOT to attend the next meeting so members can learn about the details of SCED’s operation and LFC. Request approval of the new PDCWG Scope. The PDCWG would like to review GREDP scores each month of all generators to evaluate the effectiveness of the metric. The PDCWG would like to work with ERCOT on LFC Regulation deployment tuning as several members believe Regulation is over- controlling generation. A sample graph of over deployment is included. The PDCWG is concerned that the Base Point Deviation charges do not account for the delivery of frequency response. Some fifteen minute periods have frequency deviations greater than +/- 0.05 Hz one direction but average frequency is the opposite direction for the fifteen minute period. This could penalize generators that provide a vital reliability service. Three Frequency Events in December had multiple sympathetic unit trips. Proper implementation of frequency response and generator control tuning is a concern. Further analysis of these events is needed. PDCWG will meet again February 2, 2011.

26
The PDCWG believes that too much Regulation was deployed for each of these frequency oscillations.

Similar presentations


 II Web Ex Texas Nodal Load Frequency Control.>")


 EDS 3 Release 6 - Handbook EDS 3 Release 6 MP Planning.>")


 –CLR participation limits –Telemetry Requirements.>")