Download presentation
Presentation is loading. Please wait.

1
Graphing Systems of Equations and Inequalities January 9, 2013

2
Notes Setup Standards 9.0 Students solve a system of two linear equations or linear inequalities and are able to interpret them graphically 6.0 Sketch the region defined by a linear inequality Toolbox System of equations System of inequalities Consistent Independent Dependent Inconsistent Half-plane Boundary

3
GRAPHING INEQUALITIES IN TWO VARIABLES Section 6-7:

4
Get Ready for the Lesson Hannah budgets $30 a month for lunch. On most days, she brings her lunch. She can also buy her lunch at the cafeteria or at a fast food restaurant. She spends an average of $3 for lunch at the cafeteria and an average of $4 for lunch at the restaurant. How many times a month can Hannah buy her lunch and remain within her budget.

5
Solution There are many solutions for this inequality. Each solution represents a different combination of lunches bought in the cafeteria and the restaurant.

6
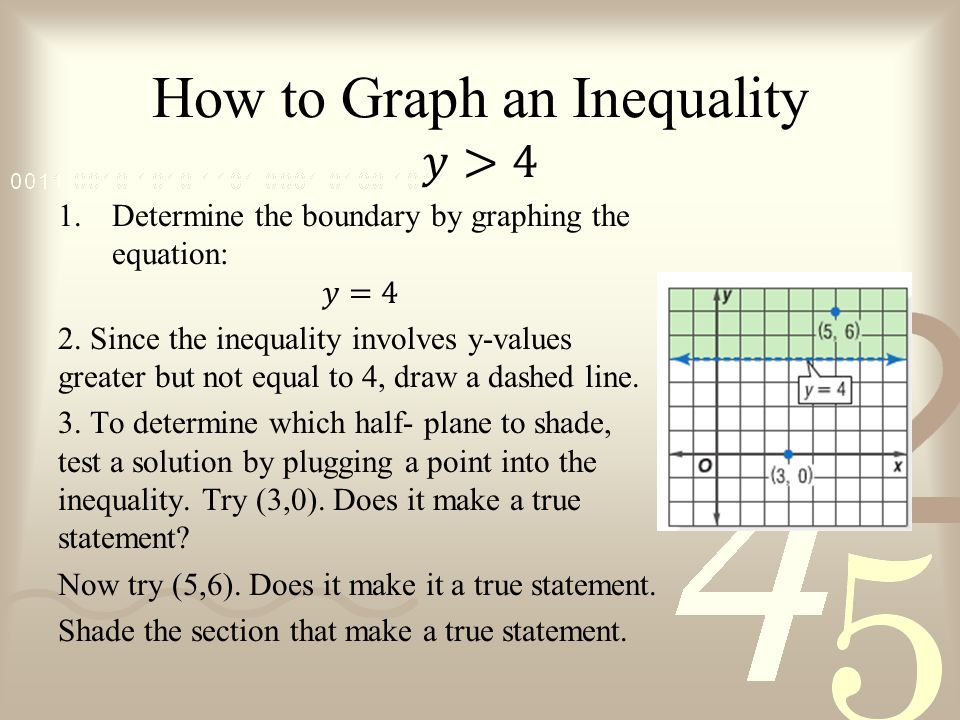
Graphing Linear Inequalities The solution set for an inequality in two variables contains many ordered pairs when the domain and range are a set of numbers.

7
Graphing Linear Inequalities The graphs of these ordered pairs fill a region on the coordinate plane called a half- plane. An equation defines the boundary or edge of each half-plane.

9
Graph the following:

10
Real World Example Neil wants to run a marathon at a pace of at least 6 miles per hour. Write an inequality for the miles y he will run in x hours and graph the solution set.

11
Answer

12
More Practice P. 337 #’s 1 – 7

13
Graphing Systems of Equations System of Equations: two or more equations together Consistent: if the graphs intersect (or coincide at one point); it has exactly one ordered pair to satisfy both equations Independent: it has exactly one solution Dependent: it has an infinite number of solutions Inconsistent: the graphs are parallel; there are no ordered pairs that satisfy both
; it has exactly one ordered pair to satisfy both equations Independent: it has exactly one solution Dependent: it has an infinite number of solutions Inconsistent: the graphs are parallel; there are no ordered pairs that satisfy both")
14
Example #1

15
Answers to Example #1 1.One 2.No solution 3.Infinitely many 4.One

16
Example #2 Graph Each System of Equations. Then determine whether the system has no solution, one solution, or infinitely many solutions. If it has one solution, name it.

17
Answers to Example #2a

18
Answer to #2b INFINITELY MANY

19
Example #3

20
Example #3 Continued 1.Write the equation for each equation 2.Graph each equation: y = 3x + 418 y = 8x + 309 3. Look for the intersection (22,485) Based on the information, both will be the same 22 years after 2004, or 2026
 Based on the information, both will be the same 22 years after 2004, or")
21
Your Turn

22
Answer Border: P=60 w= 2/3 length length 2 l + 2 w = 60 w = 2/3 l Now write each equation in terms of l and w w = 2/3 l w = ̶ l + 30

23
Answer continued (18, 12) There are 18 bricks along one edge and 12 bricks along the other.
 There are 18 bricks along one edge and 12 bricks along the other.")
24
Your Turn The length of the rectangle is 1 meter less than twice its width. What are the dimensions of the rectangle?

25
Answer

26
Summary: Pretend you are explaining how to graph inequalities to a friend. Explain all the steps needed to complete a problem. When solving a system of equations by graphing, how do we find the answer?

27
Homework: P. 256 #’s 17-27 odd, 34-36, 40 P. 337-338 #’s 9-17 odd, 20-22, 27-30, 35, 36

Similar presentations


 Solve systems of linear equations by graphing 2) Determine whether a system of linear equations is consistent.>")
