Download presentation
Presentation is loading. Please wait.

1
A new high resolution satellite derived precipitation data set for climate studies Renu Joseph, T. Smith, M. R. P. Sapiano, and R. R. Ferraro Cooperative Institute of Climate Studies (CICS), University of Maryland Joseph, R., T M Smith, M R P Sapiano and R R Ferraro, 2009: A New High Resolution Satellite Derived Precipitation Data Set for Climate Studies, Journal of Hydrometeorology, in press.
, University of Maryland Joseph, R., T M Smith, M R P Sapiano and R R Ferraro, 2009: A New High Resolution Satellite Derived Precipitation Data Set for Climate Studies, Journal of Hydrometeorology, in press..")
2
Cooperative Institute of Climate Studies (CICS) High Resolution Optimally interpolated Microwave Precipitation from Satellites CHOMPS Objectives –To create a High Resolution Data set (Temporal – Daily, Spatial - 0.25° ) –Utilize all available passive microwave satellite estimates to develop improved global daily rainfall time series (No IR values used) SSM/I, AMSU, AMSR-E and TMI –Use most recent/accurate and consistent retrieval schemes –Use Optimal Interpolation as the merging scheme Why? –Attempt to reduce discontinuities in data –Using all possible sensors reduces diurnal sampling errors –Use of OI reduces random errors Uses of our HR Data product –Created using a different method => Another verification source –Highlights OI’s feasibility as a methodology for the creation of a high resolution precipitation product –Comparable to the other currently available merged precipitation data sets.

3
Summary of Data Sources in CHOMPS and CHOMPS-noA

4
Before combining the data using OI Ensure minimal biases in the data (due to instruments, algorithms) Time of Day sampling
 Time of Day sampling")
5
Biases in Co-located Data

6
Average number of hours/day sampled for January 2003

7
Overall Methodology The Microwave estimates are binned into 0.25º hourly bins These are combined using OI to create an intermediate hourly product A common daily 1° snow-ice mask is used Hourly values are then aggregated to produce a daily estimate …… ……… } OI O-1Z 12-13Z …… ……… AMSU TRMM AMSR-E SSM/I

8
Optimum Interpolation OI is a linear combination (weighted average) of the data that influence the point. Chosen to minimize random errors. OI performed in three stages Combination of the co-located satellite data –Individual precipitation estimates combined using weights that contain information about the satellite estimates –Weights are inversely related to the noise to signal variance ratio OI for the spatial domain –OI is a weighted average of the nearest neighbors –Weights are calculated based on the error estimate and the correlation over neighbors Combined in the temporal domain –Daily values are computed only when at least four values are filled in a day. μ ij - spatial correlation over neighboring points μ ik - correlation of neighboring point and estimated points Both are functions of distance between the points Noise to signal estimates

9
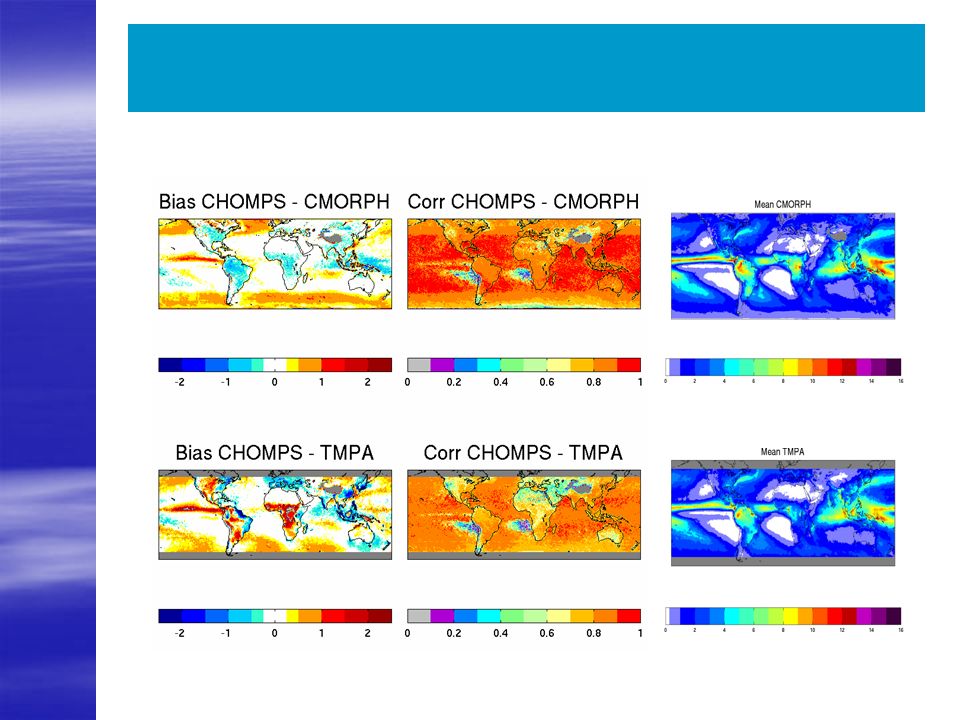
CHOMPS Climatology

10
High Resolution Data Precipitation Product Latitudinal Extent Start Date and Resolution Input Data And MethodologyReference CHOMPS60S to 60N 1 Jan 2000 (daily) Microwave estimates merged using Optimal Interpolation Joseph et al. (2009) CHOMPS-noA60S to 60N 1 Jan 1998 (daily) Same as above but excluding AMSU Joseph et al. (2009) TMPA60S to 60N Jan 1998 (3hr) Microwave merged with IR, calibrated to gauges over land Huffmann et al. (2007) CMORPH60S to 60N 07 Dec 2002 (3hr) Microwave estimates with motion vectors from IR Joyce et al. (2004) MWCOMB60S to 60N 07 Dec 2002 (3hr) Microwave estimates used in the creation of CMORPH Joyce et al. (2004) GPCP 1DD90S to 90N Jan 1998 (daily) Microwave estimates from SSM/I are combined with IR and the daily values are adjusted to sum up to those of the monthly GPCP Huffman et al. (2001)
 CHOMPS-noA60S to 60N 1 Jan 1998 (daily) Same as above but excluding AMSU Joseph et al. (2009) TMPA60S to 60N Jan 1998 (3hr) Microwave merged with IR, calibrated to gauges over land Huffmann et al. (2007) CMORPH60S to 60N 07 Dec 2002 (3hr) Microwave estimates with motion vectors from IR Joyce et al. (2004) MWCOMB60S to 60N 07 Dec 2002 (3hr) Microwave estimates used in the creation of CMORPH Joyce et al. (2004) GPCP 1DD90S to 90N Jan 1998 (daily) Microwave estimates from SSM/I are combined with IR and the daily values are adjusted to sum up to those of the monthly GPCP Huffman et al. (2001).")
11
TAO/TRITTON comparisons Hayes, S. P., et. al., 1991: TOGA/TAO: A moored array for real-time measurements in the tropical Pacific Ocean, Bull. Am. Meteor. Soc., 72, 339–347.

12
Comparison against Stage IV Radar

13
1CHOMPS-noA 2TMPA 3CMORPH 4MWCOMB 5GPCP1DD Comparison with other HR estimates RMSD Very good overall comparison Correlation > 0.9 CHOMPS-noA low variability than CHOMPS

14
Comparison with other HR estimates 1CHOMPS-noA 2TMPA 3CMORPH 4MWCOMB 5GPCP1DD RMSD Very good overall comparison Correlation > 0.9 with exception of GPCP1DD in the extra tropics CHOMPS-noA low variability than CHOMPS

15
Zonal Anomaly

16
Oct 2003 – Apr 2004 Intraseasonal Oscillation

17
Summary CHOMPS (2000-2007) and CHOMPS-noA (1998-2007) Used only passive microwave data Created using the latest and most consistent algorithm so no discontinuities OI minimizes random errors Comparable to other high resolution precipitation products –Captures the similar anomalies –Fewer discontinuities Where do we go from here? –Create diurnal data at the appropriate spatial and temporal resolution Joseph, R., T M Smith, M R P Sapiano and R R Ferraro, 2009: A New High Resolution Satellite Derived Precipitation Data Set for Climate Studies, Journal of Hydrometeorology, in press.

18
Anomalous PDFs indicate shifts in data Shift in PDF in TMPA in 2000 probably due to insertion of AMSU Shift in CHOMPS-noA in 1998 could be a reflection of the ENSO Don’t as yet understand the GPCP 1DD data shift

19
Anomalous PDFs For the 5-year period CMORPH, MWCOMB and PERSIANN has shifts in PDFs. CMORPH & MWCOMB is insertion of data

Similar presentations
 Course.>")


 for Landfalling Tropical Cyclones Elizabeth E. Ebert Centre for Australian Weather and Climate.>")
 Dudley B. Chelton (Oregon State University)>")


 Analyses for Climate NOAA’s National Climatic Data Center Asheville, NC Thomas M. Smith Richard W. Reynolds Kenneth.>")


