Download presentation
Presentation is loading. Please wait.

1
Local Broadcast Television 2000 June, 2000

3
The Internet is Already a Powerful Agent of Change 120 million Americans online. 11 million registered website domain names. 15,000 new domain names registered daily. On track for 140 million domain names by 2004.

4
60% of car buyers now use the internet in their process. Southwest Airlines on pace to sell $1 billion in tickets online in 2000, 25% of their business. 100,000 medical websites. 3 million MP3 music tracks downloaded daily.

5
$13 billion online consumer spending in 1998. $20 billion online consumer spending in 1999. $185 billion online consumer spending in 2004 [Est.]

6
It comes back together around image and brand. What Local Television does better than anyone is more important than ever!

7
What Local Broadcast Television does better than anyone for advertisers: Targeting customers. Reaching them effectively and efficiently. Building image and brand. Delivering results!

8
Geographic Targeting Matters (# of Markets Needed to Deliver Various Sales Thresholds) Major Household Appliances263957 TV’s, Video Recorders & Tapes223452 Computer Hardware & Software141828 Eating & Drinking Places243552 Auto Dealers253754 Drugs, Health & Beauty Aids263854 Department Stores304362 Drug Stores233550 Furniture & Home Furnishings Stores233549 Supermarkets284159 Source: Demographics USA County Edition 1999 50%60% 70%
 Major Household Appliances TV’s, Video Recorders & Tapes Computer Hardware & Software Eating & Drinking Places Auto Dealers Drugs, Health & Beauty Aids Department Stores Drug Stores Furniture & Home Furnishings Stores Supermarkets Source: Demographics USA County Edition %60% 70%")
9
1999 Advertising Expenditures [$Billions] Television$53.0 Local Market Broadcast23.6 Broadcast Networks15.4 Syndication2.8 Total Broadcast TV[$41.8] Cable Nets8.0 Local Cable3.2 Total Cable[$11.2] Source: Myers Group Estimates Newspaper$47.0 Radio16.7 Yellow Pages12.5 Magazines11.2 Online2.4 Outdoor1.8 Other40.8
![1999 Advertising Expenditures [$Billions] Television$53.0 Local Market Broadcast23.6 Broadcast Networks15.4 Syndication2.8 Total Broadcast TV[$41.8] Cable Nets8.0 Local Cable3.2 Total Cable[$11.2] Source: Myers Group Estimates Newspaper$47.0 Radio16.7 Yellow Pages12.5 Magazines11.2 Online2.4 Outdoor1.8 Other40.8](http://images.slideplayer.com/32/9860847/slides/slide_9.jpg "1999 Advertising Expenditures [$Billions] Television$53.0 Local Market Broadcast23.6 Broadcast Networks15.4 Syndication2.8 Total Broadcast TV[$41.8] Cable Nets8.0 Local Cable3.2 Total Cable[$11.2] Source: Myers Group Estimates Newspaper$47.0 Radio16.7 Yellow Pages12.5 Magazines11.2 Online2.4 Outdoor1.8 Other40.8")
10
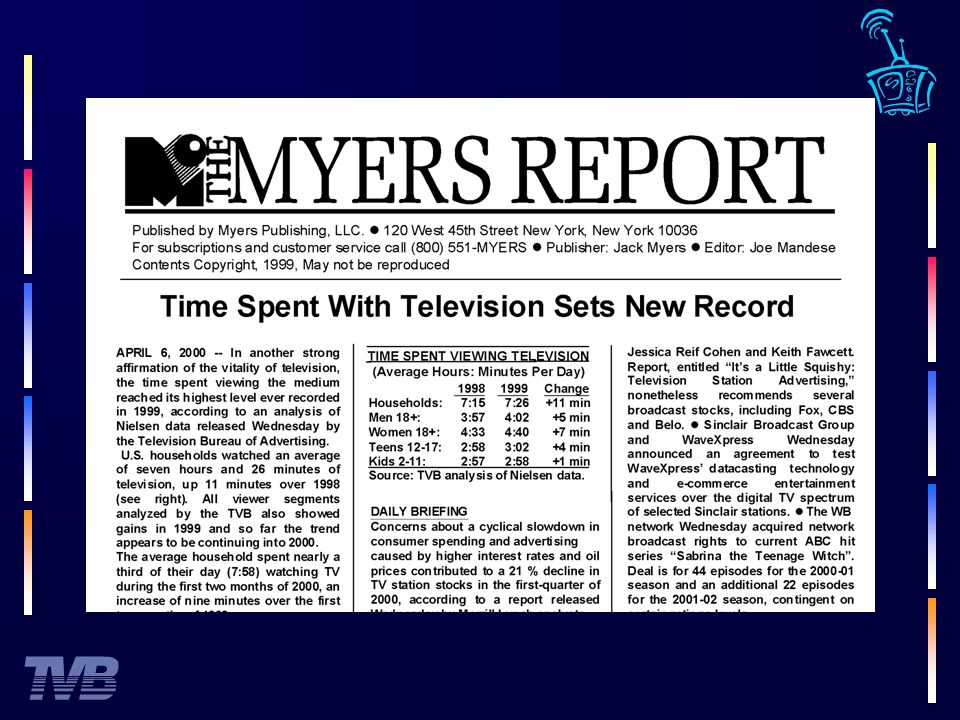
Friday Morning Supplement -- February 18, 2000 Young, Sexy And Newly Hot: Broadcast TV By Jean Bergantini Grillo Despite the heady appeal of those frisky little dot.coms, Chris Rohrs, new president for the Television Advertising Bureau, remains in love with local broadcast, a “newly hot” medium he says is now in it’s best position ever to contributions and immediately re-investing in local television” Rohrs explains. “He’s got the loop put together, creating a model local politicians and local business can follow”. T-commerce raises both risks and rewards, Rohrs adds,

12
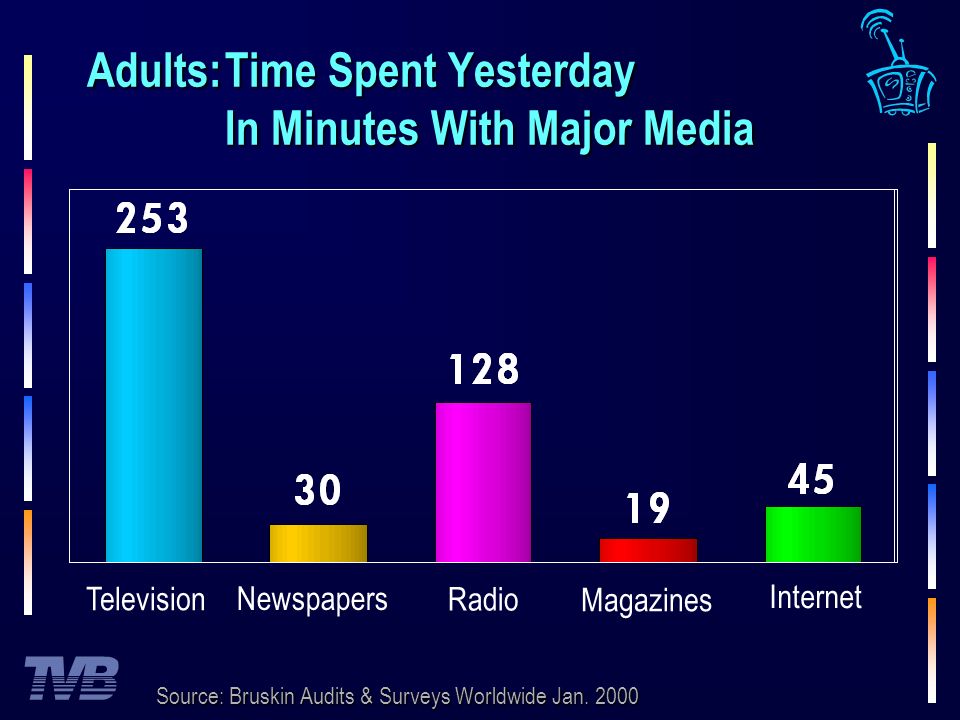
Adults:Time Spent Yesterday In Minutes With Major Media Television Newspapers Radio Magazines Internet Source: Bruskin Audits & Surveys Worldwide Jan. 2000
13
Adults:Reached Yesterday By Major Media (%) TelevisionNewspapersRadioMagazinesInternet Source: Bruskin Audits & Surveys Worldwide Jan. 2000

14
Image of Advertising in Major Media: 2000 Adults 18+ (%) Television49747866 Newspaper24 5 713 Radio11 6 4 8 Magazines10 6 3 8 Internet 6 9 8 5 Source: Bruskin Audits & Surveys Worldwide Jan. 2000 MostAuthoritativeMostExcitingMostInfluentialMostPersuasive

15
Local Television works because it’s Broadcast. 10 Broadcast Networks, 40 Cable Nets, 100 other Cable services. Dual revenue stream favored Cable. Not one Cable Net averaged a 2 Rating!

16
Cable Ratings Feb 2000 vs. Feb ‘99 Down (12) Network2/992/00 AEN1.11.0 AMC0.60.5 CNBC0.50.3 CNN0.70.5 FAM0.60.5 HLN0.20.1 NICK1.41.3 TBS1.51.3 TNN0.70.5 TNT1.61.2 USA1.91.8 WGNC0.50.3 Source Nielsen Television Activity Report (Primetime, Mon-Sun, 8-11pm)
 Network2/992/00 AEN AMC CNBC CNN FAM HLN NICK TBS TNN TNT USA WGNC Source Nielsen Television Activity Report (Primetime, Mon-Sun, 8-11pm).")
17
BET0.30.3 CMDY0.40.4 CMT0.10.1 DISC0.90.9 ESPN0.70.7 ESPN20.30.3 FOXNC0.20.2 LIF1.11.1 MSNBC0.20.2 ODYS0.10.1 TLC0.60.6 TVL0.40.4 TRAV0.10.1 TWC0.20.2 VH10.30.3 Source Nielsen Television Activity Report Cable Ratings Feb 2000 vs. Feb ‘99 No Change (15) Network2/992/00 (Primetime, Mon-Sun, 8-11pm)
 Network2/992/00 (Primetime, Mon-Sun, 8-11pm).")
18
APL0.20.3 BRVO0.10.2 COURT0.10.2 ENT0.20.3 FOOD0.10.2 FX0.3 0.4 HGTV0.30.4 HIST0.40.5 MTV0.50.7 SCIFI0.30.5 TOON0.91.0 Source Nielsen Television Activity Report Cable Ratings Feb 2000 vs. Feb ‘99 Up (11) Network2/992/00 (Primetime, Mon-Sun, 8-11pm)
 Network2/992/00 (Primetime, Mon-Sun, 8-11pm).")
19
Wired Cable Alternatives Skyrocketing ADS Becomes a Serious Threat to Local Cable Advertising DMA Household Universe Estimates: February 2000 Cable Plus ADS (Alternate Delivery Systems) 49Albuquerque-Santa Fe72.756.616.177.922.1 10Atlanta83.271.411.885.814.2 39Birmingham82.769.713.084.315.7 28Charlotte80.166.613.583.116.9 7Dallas-Ft. Worth64.550.214.377.822.2 18Denver73.961.212.782.817.2 35Greenvll-Spart-Ash78.261.117.178.121.9 11Houston68.158.29.985.514.5 26Indianapolis78.365.412.983.516.5 31Kansas City75.864.511.385.114.9 Source: Nielsen Media Research/NSI, February 2000 TV Households Cable & ADS Households %%% DMACable+WiredADSWiredADS RankDMAADSCableOnlyCableOnly

20
Wired Cable Alternatives Skyrocketing ADS Becomes a Serious Threat to Local Cable Advertising DMA Household Universe Estimates: February 2000 Cable Plus ADS (Alternate Delivery Systems) 40Memphis77.063.713.382.717.3 30Nashville79.163.615.580.419.6 45Oklahoma City75.163.311.884.315.7 22Orlando87.176.610.587.912.1 17Phoenix69.859.310.585.015.0 23Portland, OR71.862.98.987.612.4 36Salt Lake City63.252.910.383.716.3 37San Antonio76.265.510.786.014.0 21St. Louis66.656.110.584.215.8 Total U.S.77.868.19.787.512.5 Source: Nielsen Media Research/NSI, February 2000 TV Households Cable & ADS Households %%% DMACable+WiredADSWiredADS RankDMAADSCableOnlyCableOnly

21
BROADCAST WINS FEB: LARGEST MARGIN OF SEASON IN 1999-2000 SEASON’S RATINGS RACE TOTAL TV HOUSEHOLDS (AA%) M-SU 8-11 PM TEAMS BROADCAST AIRWAYS CABLE NETS 12345678 9 AVG. TO DATE SEPOCTNOVDECJANFEB 34.0 APRMAY 24.7 39.2 23.8 41.0 23.0 36.4 24.8 40.0 24.3 38.8 23.8 MAR 42.0 22.4

22
Broadcast vs. Cable In Local Markets Primetime HH AA% New York51.327.3+ 88% Chicago53.922.1+144% Detroit51.726.6+ 94% Houston59.221.3+178% Miami-Ft. Lauderdale55.623.8+134% Phoenix54.021.7+149% Denver50.521.1+139% St. Louis52.620.1+162% Kansas City50.123.6+112% San Antonio 56.427.6+104% Source: Nielsen Media Research; NSI; DMA Total Activity Report, Nov. ’99 Broadcast MarketBroadcast Cable Advantage

23
Broadcast vs. Cable In Local Markets Early Evening HH AA% Philadelphia44.520.5+117% Washington D.C.42.217.5+141% Portland, OR41.316.2+155% Raleigh Durham47.519.0+150% New Orleans48.420.5+136% Broadcast Broadcast MarketBroadcastCableAdvantage MarketBroadcastCableAdvantage Source: Nielsen Media Research; NSI; DMA Total Activity Report, Nov. ’99

24
Broadcast vs. Cable In Local Markets Late News HH AA% San Francisco-Oakland28.213.8+104% Boston33.915.6+117% Seattle-Tacoma29.910.7+179% Tampa-St.Petersburg35.417.6+101% Pittsburgh45.320.2+124% Broadcast Broadcast MarketBroadcastCableAdvantage MarketBroadcastCableAdvantage Source: Nielsen Media Research; NSI; DMA Total Activity Report, Nov. ’99

25
Environment Commercial loads. Highest recall scores.

26
The Business Process Spot verification. Post-analysis. EDI.

27
Data Quality Meter/Diary in 48 markets. Expanded sample markets.

28
Value Commercials don’t have to be expensive. Local Broadcast Television is today’s best value.

29
Because of the Internet, Local TV is more important. The Internet raises the risks and rewards of branding. Everyone will have the transaction piece. The battle rests on brand identity. Local TV complements the Internet. The Web is not yet an Ad medium.

30
Web traffic trending Local. Stations positioned to become major Internet players. “The Incumbent who adapts can be the big winner.” Local Broadcast Television works for advertisers …with the Internet -Jim Schroer, Ford

31
2. Digital is our path to enhanced TV. 3. Wireless distribution of digital content. 1. The chance to aggregate content.

32
Local Broadcast Television works for advertisers …in Digital. Distribution busted open to the competition. - Video to the home - Broadband Local TV is distribution-system-friendly. Advertising and commerce drive the system.

33
Advertisers re-thinking “media mix.” A communication foundation. The one medium that makes the others work better.

34
Targeting customers. Reaching them effectively and efficiently. Building image and brand. Delivering results.

35
Local Television works for advertisers... Because it’s Television. Because it’s Broadcast Television. Because it’s Local Broadcast Television.

36
It works... Because it defines the highest performance standards. With the Internet. In Digital. No matter the distribution system. And, in a business model driven by advertising and commerce.

37
Local Broadcast Television is the greatest value in today’s media marketplace.

38
Thank you. June, 2000

Similar presentations


 April 2010.>")


 Broadcasting vs. Satellite Radio Broadcasting.>")


