Download presentation
Presentation is loading. Please wait.

1
SEM with Measured Genotypes NIDA Workshop VIPBG, October 2012 Maes, H. H., Neale, M. C., Chen, X., Chen, J., Prescott, C. A., & Kendler, K. S. (2011). A twin association study of nicotine dependence with markers in the CHRNA3 and CHRNA5 genes. Behav Genet, 41(5), 680-690. doi: 10.1007/s10519-011-9476-z
. A twin association study of nicotine dependence with markers in the CHRNA3 and CHRNA5 genes. Behav Genet, 41(5), doi: /s z.")
2
What would ACE look like if we knew the genes and environments?

3
Where we’d like to be

4
Molecular Studies using Relatives Association studies Often based on genotyping unrelated individuals Statistical models for relatives have been extended to included measured genotypes van den Oord et al. (2002), Merlin (Abecasis, 2002) Genotype data added to twin/family studies Increased power from family design Problem: Some relatives with phenotypes without genotypes Power of association studies can be increased if incompletely genotyped families are retained in analyses (Visscher et al 2008)
, Merlin (Abecasis, 2002) Genotype data added to twin/family studies Increased power from family design Problem: Some relatives with phenotypes without genotypes Power of association studies can be increased if incompletely genotyped families are retained in analyses (Visscher et al 2008).")
5
The Tobacco and Genetics Consortium Nature Genetics (2010)
")
6
Meta-Analyses of GWAS of Smoking Three Meta-analyses TAG 2010; Thorgeirson et al. 2010; Liu et al. 2010 > 100,000 individuals Several genome-wide significant results Initiation: BDNF, Cessation: DBH Consumption Neuronal acetylcholine receptor subunit genes SNPs in CHRNA5 and CHRNA3CHRNA5CHRNA3 rs16969968 First identified by Saccone et al (2007)
.")
7
Goal: test whether nicotine dependence is linked to nicotinic receptor variants printACE(AceFit) a^2 c^2 e^2 aS^2 [1,] 0.62 0 0.38 0 printACE(AcegFit) a^2 c^2 e^2 aS^2 [1,] 0.61 0 0.38 0.01 mxCompare(AcegFit, AceFit) base comparison ep minus2LL df AIC diffLL diffdf p 1 ACEg 15 3386.251 730 1926.251 NA NA NA 2 ACEg ACEonly 14 3390.466 731 1928.466 4.214693 1 0.0401
![Goal: test whether nicotine dependence is linked to nicotinic receptor variants printACE(AceFit) a^2 c^2 e^2 aS^2 [1,] printACE(AcegFit) a^2 c^2 e^2 aS^2 [1,] mxCompare(AcegFit, AceFit) base comparison ep minus2LL df AIC diffLL diffdf p 1 ACEg NA NA NA 2 ACEg ACEonly](http://images.slideplayer.com/32/9854588/slides/slide_7.jpg "Goal: test whether nicotine dependence is linked to nicotinic receptor variants printACE(AceFit) a^2 c^2 e^2 aS^2 [1,] printACE(AcegFit) a^2 c^2 e^2 aS^2 [1,] mxCompare(AcegFit, AceFit) base comparison ep minus2LL df AIC diffLL diffdf p 1 ACEg NA NA NA 2 ACEg ACEonly")
8
Twin Association Model Traditional Twin Model Measured Genotypes as covariates in Means Model Quantify contributions of specific variants as well as background genetic and environmental factors

9
Twin Association Model

10
Expected Means based on allelic effects of SNPs Population mean = “m” Allele at a particular locus = either “A” or “a” SNP effect modeled as deviations from “m” Additive (aS) or dominant (dS) SNP effect model Expected mean for AA homozygote = m + aS Aa heterozygotes = m + dS aa homozygote = m – aS
 or dominant (dS) SNP effect model Expected mean for AA homozygote = m + aS Aa heterozygotes = m + dS aa homozygote = m – aS")
11
MZs: 1 of 3 classes +aS dS -aS

12
DZs: 1 of 3x3 classes

13
Twin Data Availability Zygosity Twin Data AvailabilityMZDZ Combination Genotype d Phenotype d twin 1twin 2twin 1twin 2 1 both GP 2twin 1GPG G 3twin 2GGPG 4neitherGGGG 5 one bothGPP P 6twin 1GP 7twin 2GPGP 8neitherGG 9 bothPPPP 10twin 1PP 11twin 2PP 12neither

14
Missing Genotypes One MZ twin genotyped One twin or both twins phenotyped > Assign co-twin genotype to un- genotyped co-twin One DZ twin genotyped One or both phenotyped > Use allele frequencies to assign a probability of belongingness to each of 3 possible classes based on genotyped twin Neither MZ twin genotyped One or both twins phenotyped > Assign probability of membership in any of the 3 possible genotype classes based on allele frequencies Neither DZ twin genotyped One or both twins phenotyped > Assign probability of membership in any of the 9 possible genotype classes based on allele frequencies

15
So, how do we do add substitute values for our missing genotype data? Need to know the expected proportions of each genotype in the cases of twin1 and or twin2 missing for MZ and for DZ Need to code our data in such as way as to allow us to fill in the three possible values for missing MZ data and the 9 possible values in the case of one or more missing DZ twin genotypes in a pair.

16
Expected proportion of each genotype based on allele frequencies GenotypeExpected ProportionExpected Mean T1T2MZDZT1T2 AA p2p2 p 4 + p 3 q + (pq) 2 /4gm +aS AAAa0p 3 q + (pq) 2 /4gm +aSgm +dS AAaa0(pq) 2 /4gm +aSgm -aS AaAA0p 3 q + (pq) 2 /4gm +dSgm +aS Aa 2*pqp 3 q + 3(pq) 2 + pq 3 gm +dS Aaaa0pq 3 + (pq) 2 /4gm +dSgm -aS aaAA0(pq) 2 /4gm -aSgm +aS aaAa0pq 3 + (pq) 2 /4gm -aSgm +dS aa q2q2 q 4 + pq 3 + (pq) 2 /4gm -aS expected proportion of each of genotypic categories of twin pairs calculated based on allele frequencies obtained from total sample of genotyped individuals
 2 /4gm +aS AAAa0p 3 q + (pq) 2 /4gm +aSgm +dS AAaa0(pq) 2 /4gm +aSgm -aS AaAA0p 3 q + (pq) 2 /4gm +dSgm +aS Aa 2*pqp 3 q + 3(pq) 2 + pq 3 gm +dS Aaaa0pq 3 + (pq) 2 /4gm +dSgm -aS aaAA0(pq) 2 /4gm -aSgm +aS aaAa0pq 3 + (pq) 2 /4gm -aSgm +dS aa q2q2 q 4 + pq 3 + (pq) 2 /4gm -aS expected proportion of each of genotypic categories of twin pairs calculated based on allele frequencies obtained from total sample of genotyped individuals")
17
Let’s look at the dataset… str(selData) 'data.frame': 850 obs. of 9 variables: $ zyg : int 1 3 5 3 4 2 1 4 5 3... $ rs10a11: int 1 1 1 1 0 1 1 1 1 0... $ rs10a12: int 1 1 1 1 1 1 1 1 1 0... $ rs10a13: int 1 1 1 1 0 1 1 1 1 1... $ rs10a21: int 1 1 1 1 1 1 1 1 1 0... $ rs10a22: int 1 1 1 1 1 1 1 1 1 0... $ rs10a23: int 1 1 1 1 1 1 1 1 1 1... $ ftnd1 : int NA 5 5 7 6 NA NA NA 4 NA... $ ftnd2 : int NA NA 5 9 NA NA NA 8 NA NA...

18
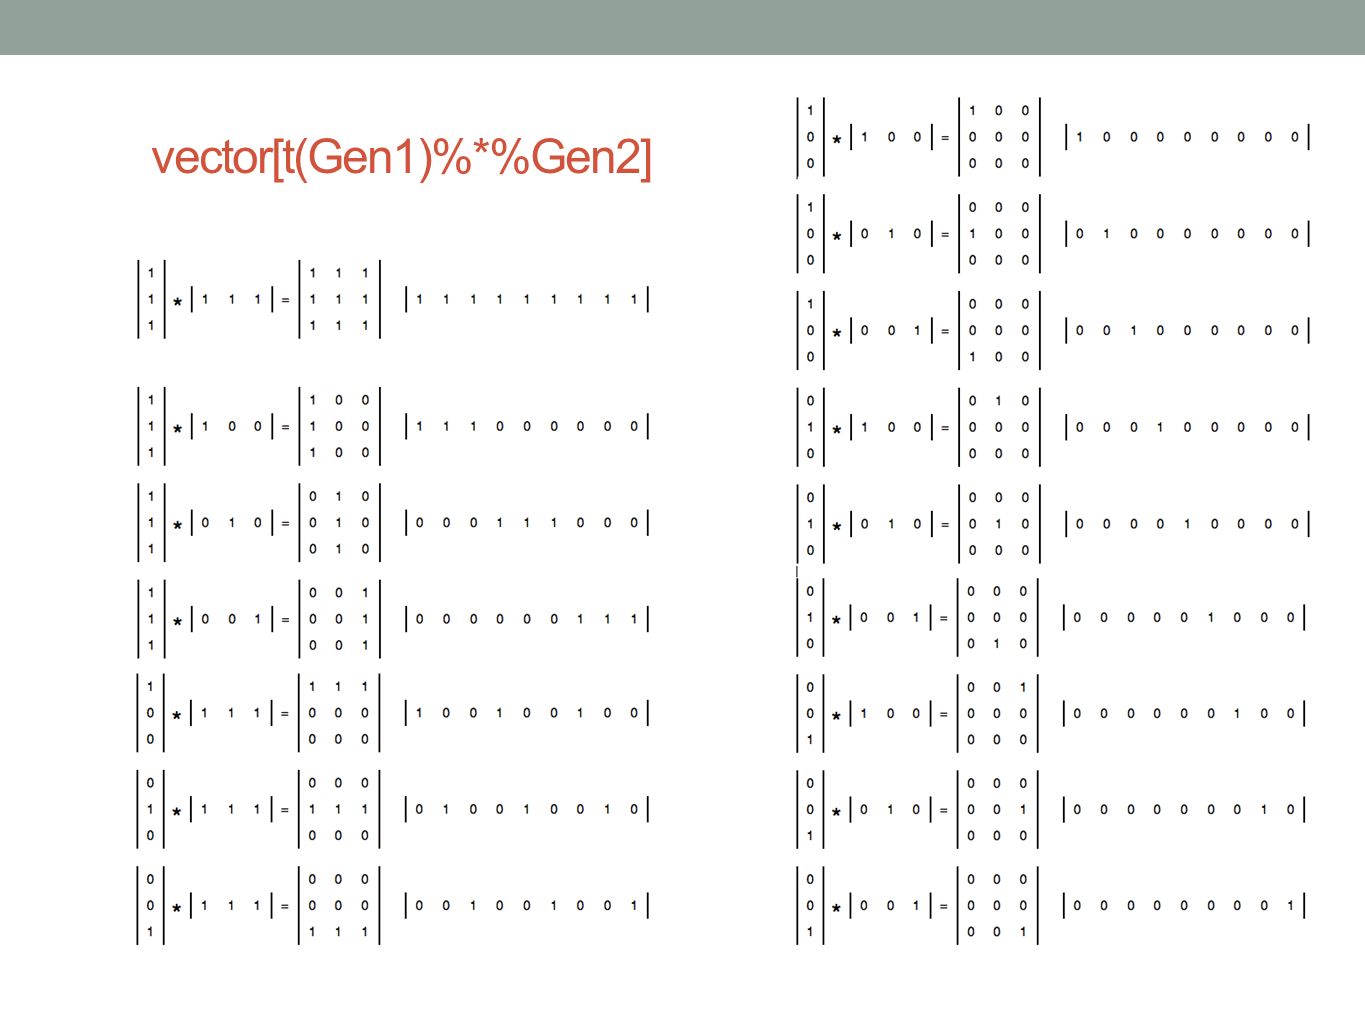
Recode Genotypes into 3 columns (to map into the 9 genotype classes) rs#11 rs#12 rs#13 if rs10a1 = 2 [AA] 1, 0, 0 if rs10a1 = 1 [Aa] 0, 1, 0 if rs10a1 = 0 [aa] 0, 0, 1 if rs10a1 = NA [??] 1, 1, 1 mzGen1 = c(rs#11, rs#12, rs#13) Now we can multiple these 1*3 matrices to get a 9-cell vector with 1s in the “possible” co-twin genotypes vector[ t(Gen1) %*% Gen2 ]
![Recode Genotypes into 3 columns (to map into the 9 genotype classes) rs#11 rs#12 rs#13 if rs10a1 = 2 [AA] 1, 0, 0 if rs10a1 = 1 [Aa] 0, 1, 0 if rs10a1 = 0 [aa] 0, 0, 1 if rs10a1 = NA [ ] 1, 1, 1 mzGen1 = c(rs#11, rs#12, rs#13) Now we can multiple these 1*3 matrices to get a 9-cell vector with 1s in the possible co-twin genotypes vector[ t(Gen1) %*% Gen2 ]](http://images.slideplayer.com/32/9854588/slides/slide_18.jpg "Recode Genotypes into 3 columns (to map into the 9 genotype classes) rs#11 rs#12 rs#13 if rs10a1 = 2 [AA] 1, 0, 0 if rs10a1 = 1 [Aa] 0, 1, 0 if rs10a1 = 0 [aa] 0, 0, 1 if rs10a1 = NA [ ] 1, 1, 1 mzGen1 = c(rs#11, rs#12, rs#13) Now we can multiple these 1*3 matrices to get a 9-cell vector with 1s in the possible co-twin genotypes vector[ t(Gen1) %*% Gen2 ]")
20
Individual Proportions mzGen1| mzGen2 > mzGenProb mzN x 6 mzN x 9 # mzN = number of MZ pairs mzGenComb = vector(t(mzGen1) %*% mzGen2) mzGenProb = mzGenComb %*% mzProb / (mzGenComb %*% (mzProb %*% U)) # note: “%*% U” Sums all the probabilities (Einstein addition)
 %*% mzGen2) mzGenProb = mzGenComb %*% mzProb / (mzGenComb %*% (mzProb %*% U)) # note: %*% U Sums all the probabilities (Einstein addition)")
21
Matrices for Genotype # Matrices to store effect of genotype mxMatrix(name="mean", type="Full", nrow=nv, ncol=nv, free=T, values=0, label="gm"), mxMatrix(name="addSNP", type="Full", nrow=nv, ncol=nv, free=T, values=0, label="aS"), mxMatrix(name="domSNP", type="Full", nrow=nv, ncol=nv, free=F, values=0, label="dS"), mxMatrix(name="pSNP", type="Full", nrow=nv, ncol=nv, free=F, values=allelep), mxAlgebra(1-pSNP, name="qSNP"), mxAlgebra(2 * pSNP * qSNP * addSNP^2, name = "S"), mxAlgebra(V+S, name="totalV"), mxAlgebra((cbind(A,C,E,S)) %x% solve(totalV), name = "stVarCom"), mxAlgebra(cbind(V, A, C, E, S, stVarCom), name = "allVarCom"), mxMatrix(name="U9", type = "Unit", nrow = 9, ncol = 1),
, mxMatrix(name= addSNP , type= Full , nrow=nv, ncol=nv, free=T, values=0, label= aS ), mxMatrix(name= domSNP , type= Full , nrow=nv, ncol=nv, free=F, values=0, label= dS ), mxMatrix(name= pSNP , type= Full , nrow=nv, ncol=nv, free=F, values=allelep), mxAlgebra(1-pSNP, name= qSNP ), mxAlgebra(2 * pSNP * qSNP * addSNP^2, name = S ), mxAlgebra(V+S, name= totalV ), mxAlgebra((cbind(A,C,E,S)) %x% solve(totalV), name = stVarCom ), mxAlgebra(cbind(V, A, C, E, S, stVarCom), name = allVarCom ), mxMatrix(name= U9 , type = Unit , nrow = 9, ncol = 1),")
22
Expected Mean Vector # Matrix & Algebra for expected means vector and expected thresholds mxAlgebra(rbind(mean+addSNP,mean+domSNP,mean-addSNP), name="mean3"), mxAlgebra( cbind(mean+addSNP,mean+addSNP), name="expMean_AAAA"), mxAlgebra( cbind(mean+addSNP,mean+domSNP), name="expMean_AAAa"), mxAlgebra( cbind(mean+addSNP,mean-addSNP), name="expMean_AAaa"), mxAlgebra( cbind(mean+domSNP,mean+addSNP), name="expMean_AaAA"), mxAlgebra( cbind(mean+domSNP,mean+domSNP), name="expMean_AaAa"), mxAlgebra( cbind(mean+domSNP,mean-addSNP), name="expMean_Aaaa"), mxAlgebra( cbind(mean-addSNP,mean+addSNP), name="expMean_aaAA"), mxAlgebra( cbind(mean-addSNP,mean+domSNP), name="expMean_aaAa"), mxAlgebra( cbind(mean-addSNP,mean-addSNP), name="expMean_aaaa"),
, name= mean3 ), mxAlgebra( cbind(mean+addSNP,mean+addSNP), name= expMean_AAAA ), mxAlgebra( cbind(mean+addSNP,mean+domSNP), name= expMean_AAAa ), mxAlgebra( cbind(mean+addSNP,mean-addSNP), name= expMean_AAaa ), mxAlgebra( cbind(mean+domSNP,mean+addSNP), name= expMean_AaAA ), mxAlgebra( cbind(mean+domSNP,mean+domSNP), name= expMean_AaAa ), mxAlgebra( cbind(mean+domSNP,mean-addSNP), name= expMean_Aaaa ), mxAlgebra( cbind(mean-addSNP,mean+addSNP), name= expMean_aaAA ), mxAlgebra( cbind(mean-addSNP,mean+domSNP), name= expMean_aaAa ), mxAlgebra( cbind(mean-addSNP,mean-addSNP), name= expMean_aaaa ),")
23
Expected Thresholds, Covariances mxMatrix( type="Full", nrow = nth, ncol = nv, free = c(F,F,rep(T,nth-2)), values=thValues, lbound=thLBound, name="Thre”), mxMatrix( type="Lower", nrow=nth, ncol=nth, free=FALSE, values=1, name="Inc" ), mxAlgebra(Inc %*% Thre, name="ThreInc"), mxAlgebra(cbind(ThreInc,ThreInc), dimnames=list(thRows,selVars), name="expThre"), # Algebra for expected variance/covariance matrices mxAlgebra((rbind(cbind(A+C+E, A+C), cbind(A+C, A+C+E))), name="expCovMZ"), mxAlgebra((rbind (cbind(A+C+E, 0.5%x%A+C), cbind(0.5%x%A+C, A+C+E))), name="expCovDZ")
), values=thValues, lbound=thLBound, name= Thre ), mxMatrix( type= Lower , nrow=nth, ncol=nth, free=FALSE, values=1, name= Inc ), mxAlgebra(Inc %*% Thre, name= ThreInc ), mxAlgebra(cbind(ThreInc,ThreInc), dimnames=list(thRows,selVars), name= expThre ), # Algebra for expected variance/covariance matrices mxAlgebra((rbind(cbind(A+C+E, A+C), cbind(A+C, A+C+E))), name= expCovMZ ), mxAlgebra((rbind (cbind(A+C+E, 0.5%x%A+C), cbind(0.5%x%A+C, A+C+E))), name= expCovDZ )")
24
mxModel(“MZ_”, mxData(mzData, type="raw" ), mxModel("MZ_AA", mxFIMLObjective( "ACE.expCovMZ", "ACE.expMean_AAAA", selVars,"ACE.expThre", vector=T) ), mxModel("MZ_Aa", mxFIMLObjective("ACE.expCovMZ", "ACE.expMean_AaAa", selVars,"ACE.expThre", vector=T) ), mxModel("MZ_aa", mxFIMLObjective("ACE.expCovMZ","ACE.expMean_aaaa", selVars,"ACE.expThre", vector=T) ), mxMatrix("Full",mzN,9,F, values=mzGenProb, name="mzWeights"), mxMatrix("Zero",mzN,1, name="Zero"), mxAlgebra(-2 * sum(log((mzWeights * cbind( MZ_AA.objective, Zero, Zero, Zero, MZ_Aa.objective, Zero, Zero, Zero, MZ_aa.objective)) %*%ACE.U9)), name="MZmix"), mxAlgebraObjective("MZmix")
, mxModel( MZ_AA , mxFIMLObjective( ACE.expCovMZ , ACE.expMean_AAAA , selVars, ACE.expThre , vector=T) ), mxModel( MZ_Aa , mxFIMLObjective( ACE.expCovMZ , ACE.expMean_AaAa , selVars, ACE.expThre , vector=T) ), mxModel( MZ_aa , mxFIMLObjective( ACE.expCovMZ , ACE.expMean_aaaa , selVars, ACE.expThre , vector=T) ), mxMatrix( Full ,mzN,9,F, values=mzGenProb, name= mzWeights ), mxMatrix( Zero ,mzN,1, name= Zero ), mxAlgebra(-2 * sum(log((mzWeights * cbind( MZ_AA.objective, Zero, Zero, Zero, MZ_Aa.objective, Zero, Zero, Zero, MZ_aa.objective)) %*%ACE.U9)), name= MZmix ), mxAlgebraObjective( MZmix )")
25
mxModel(“DZ_”, mxData(dzData, type="raw"), mxModel("DZ_AAAA", mxFIMLObjective("ACE.expCovDZ", "ACE.expMean_AAAA", selVars, "ACE.expThre", vector=T)), mxModel("DZ_AAAa", mxFIMLObjective("ACE.expCovDZ", "ACE.expMean_AAAa", selVars, "ACE.expThre", vector=T)), mxModel("DZ_AAaa", mxFIMLObjective("ACE.expCovDZ", "ACE.expMean_AAaa", selVars, "ACE.expThre", vector=T)), mxModel("DZ_AaAA”, mxFIMLObjective("ACE.expCovDZ", "ACE.expMean_AaAA", selVars, "ACE.expThre", vector=T)), mxModel("DZ_AaAa", mxFIMLObjective("ACE.expCovDZ", "ACE.expMean_AaAa", selVars, "ACE.expThre", vector=T)), mxModel("DZ_Aaaa”, mxFIMLObjective("ACE.expCovDZ", "ACE.expMean_Aaaa", selVars, "ACE.expThre", vector=T)), mxModel("DZ_aaAA”, mxFIMLObjective("ACE.expCovDZ", "ACE.expMean_aaAA", selVars, "ACE.expThre", vector=T)), mxModel("DZ_aaAa”, mxFIMLObjective("ACE.expCovDZ", "ACE.expMean_aaAa", selVars, "ACE.expThre", vector=T)), mxModel("DZ_aaaa”, mxFIMLObjective("ACE.expCovDZ", "ACE.expMean_aaaa", selVars, "ACE.expThre", vector=T)), mxMatrix(name="dzWeights", type= "Full",nrow=dzN,ncol=9,free=F, values=dzGenProb), mxMatrix(name="Zero", type="Zero",nrow=dzN,ncol=1), mxAlgebra(name="DZmix", expression = -2*sum(log((dzWeights * cbind(DZ_AAAA.objective, DZ_AAAa.objective, DZ_AAaa.objective, DZ_AaAA.objective, DZ_AaAa.objective, DZ_Aaaa.objective, DZ_aaAA.objective, DZ_aaAa.objective, DZ_aaaa.objective)) %*%ACE.U9)), ), mxAlgebraObjective("DZmix”)
, mxModel( DZ_AAAA , mxFIMLObjective( ACE.expCovDZ , ACE.expMean_AAAA , selVars, ACE.expThre , vector=T)), mxModel( DZ_AAAa , mxFIMLObjective( ACE.expCovDZ , ACE.expMean_AAAa , selVars, ACE.expThre , vector=T)), mxModel( DZ_AAaa , mxFIMLObjective( ACE.expCovDZ , ACE.expMean_AAaa , selVars, ACE.expThre , vector=T)), mxModel( DZ_AaAA , mxFIMLObjective( ACE.expCovDZ , ACE.expMean_AaAA , selVars, ACE.expThre , vector=T)), mxModel( DZ_AaAa , mxFIMLObjective( ACE.expCovDZ , ACE.expMean_AaAa , selVars, ACE.expThre , vector=T)), mxModel( DZ_Aaaa , mxFIMLObjective( ACE.expCovDZ , ACE.expMean_Aaaa , selVars, ACE.expThre , vector=T)), mxModel( DZ_aaAA , mxFIMLObjective( ACE.expCovDZ , ACE.expMean_aaAA , selVars, ACE.expThre , vector=T)), mxModel( DZ_aaAa , mxFIMLObjective( ACE.expCovDZ , ACE.expMean_aaAa , selVars, ACE.expThre , vector=T)), mxModel( DZ_aaaa , mxFIMLObjective( ACE.expCovDZ , ACE.expMean_aaaa , selVars, ACE.expThre , vector=T)), mxMatrix(name= dzWeights , type= Full ,nrow=dzN,ncol=9,free=F, values=dzGenProb), mxMatrix(name= Zero , type= Zero ,nrow=dzN,ncol=1), mxAlgebra(name= DZmix , expression = -2*sum(log((dzWeights * cbind(DZ_AAAA.objective, DZ_AAAa.objective, DZ_AAaa.objective, DZ_AaAA.objective, DZ_AaAa.objective, DZ_Aaaa.objective, DZ_aaAA.objective, DZ_aaAa.objective, DZ_aaaa.objective)) %*%ACE.U9)), ), mxAlgebraObjective( DZmix )")
26
Goal: test whether nicotine dependence is linked to nicotinic receptor variants mxCompare(AcegFit, AceFit) base comparison ep minus2LL df AIC diffLL diffdf p 1 ACEg 15 3386.251 730 1926.251 NA NA NA 2 ACEg ACEonly 14 3390.466 731 1928.466 4.214693 1 0.0401 printACE(AceFit) a^2 c^2 e^2 aS^2 [1,] 0.62 0 0.38 0 printACE(AcegFit) a^2 c^2 e^2 aS^2 [1,] 0.61 0 0.38 0.01
![Goal: test whether nicotine dependence is linked to nicotinic receptor variants mxCompare(AcegFit, AceFit) base comparison ep minus2LL df AIC diffLL diffdf p 1 ACEg NA NA NA 2 ACEg ACEonly printACE(AceFit) a^2 c^2 e^2 aS^2 [1,] printACE(AcegFit) a^2 c^2 e^2 aS^2 [1,]](http://images.slideplayer.com/32/9854588/slides/slide_26.jpg "Goal: test whether nicotine dependence is linked to nicotinic receptor variants mxCompare(AcegFit, AceFit) base comparison ep minus2LL df AIC diffLL diffdf p 1 ACEg NA NA NA 2 ACEg ACEonly printACE(AceFit) a^2 c^2 e^2 aS^2 [1,] printACE(AcegFit) a^2 c^2 e^2 aS^2 [1,]")
Similar presentations

 Evolution is a change in.>")


 association? How do we test for association? When to use association.>")


introduction to OpenMx Sarah Medland. Starting at the beginning Opening R Gui – double click Unix/Terminal – type R Closing R Gui – click on the.>")


