Download presentation
Presentation is loading. Please wait.

1
The not revealed truth for GHG and CO2 Electricity Emission in AB Based on Alberta Environment and Statistic Canada reports Picture source: www.climateactionprogramme.org

2
Outline Objectives Relationship between GHG and CO2 World GHG emission Canadian GHG emission Alberta emission AB Power Plant emission Trends Summary

3
Are the emission numbers from Communication complete? ∑ % = 100% Waste? Transport? Agriculture - Land use? Fugitive Sources? Picture sources: neo-nomad.kaywa.com eetdnews.lbl.gov climatechangeaction.blogspot.com

4
Relationship between GHG and CO2 Picture sources: www.msu.edu Methane + 21 * - CH4: Methane (Fossil fuel production and combustion, Agriculture, Waste decomposition) Nitrous Oxide + 310 * - NOx: Nitrous Oxide (Fertilizer, Industrial processes, Fossil fuel combustion ) GHG = CO2e Where: - CO2: Carbon Dioxide (Fossil-fuel combustion, Land-use conversion, Cement Production) Carbon dioxide = GHG are measure in format CO2e
 Nitrous Oxide * - NOx: Nitrous Oxide (Fertilizer, Industrial processes, Fossil fuel combustion ) GHG = CO2e Where: - CO2: Carbon Dioxide (Fossil-fuel combustion, Land-use conversion, Cement Production) Carbon dioxide = GHG are measure in format CO2e")
5
Shared World GHG Emission 2005 2005 World GHG Emission: 30,000 MtCO2e Source: Environment Alberta and Statistic Canada

6
Shared Canadian GHG Emission 2005 Source: Environment Alberta and Statistic Canada 2005 Canada GHG Emission: 747 MtCO2e

7
AB GHG and CO2 Emission 2005 (*) estimates Power Plants emitted 28% of CO2 emission CO2 (179 Mt) Power Plants emitted 22% of GHG emission GHG (233 MtCO2e) Source: Environment Alberta and Statistic Canada
 estimates Power Plants emitted 28% of CO2 emission CO2 (179 Mt) Power Plants emitted 22% of GHG emission GHG (233 MtCO2e) Source: Environment Alberta and Statistic Canada")
8
AB CH4 and N2O Emission 2005 Methane (42 MtCO2e) Power Plants emitted 3% of Nitrous Oxide emission Nitrous Oxide (12 MtCO2e) Power Plants emitted 0% of CH4 Source: Environment Alberta and Statistic Canada
 Power Plants emitted 3% of Nitrous Oxide emission Nitrous Oxide (12 MtCO2e) Power Plants emitted 0% of CH4 Source: Environment Alberta and Statistic Canada")
9
Share of emission of AB Power Plants 2005 Coal Power Plants:91% of GHG Gas Power Plants: 8% of GHG GHG (53.6 MtCO2e) Picture source: Environment Alberta and Statistic Canada Coal Power Plants: 87% of CO2 Gas Power Plants: 13% of CO2 CO2 (51.2 Mt)
 Picture source: Environment Alberta and Statistic Canada Coal Power Plants: 87% of CO2 Gas Power Plants: 13% of CO2 CO2 (51.2 Mt)")
10
Break-down of total AB emissions 2005 Coal Power Plants: 20% of GHG Gas Power Plants: 2% of GHG Coal Power Plants: 25% of CO2 Gas Power Plants: 3% of CO2 GHG (233 MtCO2e) CO2 (179 Mt) Picture source: Environment Alberta and Statistic Canada
 CO2 (179 Mt) Picture source: Environment Alberta and Statistic Canada")
11
AB GHG Power Plant Trend (absolute) Source: Statistic Canada
 Source: Statistic Canada")
12
AB GHG Power Plant Trend (intensity) Source: Statistic Canada
 Source: Statistic Canada")
13
Summary Next Steps Scenarios Modeling for CO2 and Power Generations Plants. CO2 Taxation in AB – what does the estimate COE is? Which are the targets in GHG emission for Canada and Alberta? CCS in AB – it is possible? Will CCS improve the AB Power Plant emissions sufficiently? What does the estimate COE for Power Plant with CCS is?

14
Questions, remarks, comments

15
The not revealed truth for GHG and CO2 Electricity Emission in AB Based on Alberta Environment and Statistic Canada reports Picture source: www.climateactionprogramme.org

16
Scenarios

17
Magnitudes

18
GHG, CO2e and CO2 GHG = CO2e = CO2 + 21*CH4 + 310*N2O + (140, 11700)*HFC + (6500, 9200)*PFC + 23900*SH Where: - CO2: Carbon Dioxide (Fossil-fuel combustion, Land-use conversion, Cement Production) - CH4: Methane (Fossil fuel production and combustion, Agriculture, Waste decomposition) - NOx: Nitrous Oxide (Fertilizer, Industrial processes, Fossil fuel combustion ) - HFCs: Hydrofluorocarbons (Refrigerants) - PFCs: Perfluorocarbons (Aluminum smelting, Semiconductor manufacturing ) - SH: Sulfur Hexafluoride (Dielectric fluid used in electrical equipment )
*HFC + (6500, 9200)*PFC *SH Where: - CO2: Carbon Dioxide (Fossil-fuel combustion, Land-use conversion, Cement Production) - CH4: Methane (Fossil fuel production and combustion, Agriculture, Waste decomposition) - NOx: Nitrous Oxide (Fertilizer, Industrial processes, Fossil fuel combustion ) - HFCs: Hydrofluorocarbons (Refrigerants) - PFCs: Perfluorocarbons (Aluminum smelting, Semiconductor manufacturing ) - SH: Sulfur Hexafluoride (Dielectric fluid used in electrical equipment )")
19
Weight in GHG formula GHGFormula100-Year GWPAtmospheric Lifetime (years) Carbon DioxideCO 2 1Variable MethaneCH 4 2112 ± 3 Nitrous OxideN2ON2O310120 Sulphur HexafluorideSF 6 23 9003 200 Hydrofluorocarbons (HFCs) HFC-23CHF 3 11 700264 HFC-32CH 2 F 2 6505.6 HFC-41CH 3 F1503.7 HFC-43-10meeC 5 H 2 F 10 1 30017.1 HFC-125C 2 HF 5 2 80032.6 HFC-134C 2 H 2 F 4 (CHF 2 CHF 2 )1 00010.6 HFC-134aC 2 H 2 F 4 (CH 2 FCF 3 )1 30014.6 HFC-143C 2 H 3 F 3 (CHF 2 CH 2 F)3001.5 HFC-143aC 2 H 3 F 3 (CF 3 CH 3 )3 8003.8 HFC-152aC 2 H 4 F 2 (CH 3 CHF 2 )14048.3 HFC-227eaC 3 HF 7 2 90036.5 HFC-236faC3H2F6C3H2F6 6 300209 HFC-245caC3H3F5C3H3F5 5606.6 Perfluorocarbons (PFCs) PerfluoromethaneCF 4 6 50050 000 PerfluoroethaneC2F6C2F6 9 20010 000 PerfluoropropaneC3F8C3F8 7 0002 600 PerfluorobutaneC 4 F 10 7 0002 600 Perfluorocyclobutanec-C 4 F 8 8 7003 200 PerfluoropentaneC 5 F 12 7 5004 100 PerfluorohexaneC 6 F 14 7 4003 200 Source: MSA
 Carbon DioxideCO 2 1Variable MethaneCH ± 3 Nitrous OxideN2ON2O Sulphur HexafluorideSF Hydrofluorocarbons (HFCs) HFC-23CHF HFC-32CH 2 F HFC-41CH 3 F HFC-43-10meeC 5 H 2 F HFC-125C 2 HF HFC-134C 2 H 2 F 4 (CHF 2 CHF 2 ) HFC-134aC 2 H 2 F 4 (CH 2 FCF 3 ) HFC-143C 2 H 3 F 3 (CHF 2 CH 2 F) HFC-143aC 2 H 3 F 3 (CF 3 CH 3 ) HFC-152aC 2 H 4 F 2 (CH 3 CHF 2 ) HFC-227eaC 3 HF HFC-236faC3H2F6C3H2F HFC-245caC3H3F5C3H3F Perfluorocarbons (PFCs) PerfluoromethaneCF PerfluoroethaneC2F6C2F PerfluoropropaneC3F8C3F PerfluorobutaneC 4 F Perfluorocyclobutanec-C 4 F PerfluoropentaneC 5 F PerfluorohexaneC 6 F Source: MSA")
20
CO2 TAXation In AB, for 2007: Our consumption was 69661 GWh (according to Gil) Our power plants generated 7954 MW/day of average (AESO), or 190.85 GWh/day Our emission for 2005 was 882 kgCO2e/MWh (Statistic Canada) With $15 per tonne of CO2e emitted, considering: 850 kgCO2e/MWh average emission for 2007. Keeping outside the calculus the small generators (the law exclude them). The same relationship in electricity generation and emission by Coal, Gas and other power plants for 2007 (the last data is for 2005). We have that the cost to emit is around 2129171 $/day = 2.1 M$/day 1.83 M$/day due to Coal Plants 0.30 M$/day due to Gas Plants And the cost of electricity would raise up to 12.6 $/MWh.
. The same relationship in electricity generation and emission by Coal, Gas and other power plants for 2007 (the last data is for 2005). We have that the cost to emit is around $/day = 2.1 M$/day 1.83 M$/day due to Coal Plants 0.30 M$/day due to Gas Plants And the cost of electricity would raise up to 12.6 $/MWh..")
21
Human vs. Nature CO2 emission

23
Decommissions 1998-2005 DeveloperLocation Installed Capacity (MW) Type Date of decommissioning ATCO PowerBattle River 1, 256Coal1998 TransAltaWabamun 3140Coal2003 TransAltaWabamun 1,2128Coal2005 EPCORClover Bar629Gas2005 Total Current Decommissioned Generation (1998-2005) 953 Source: DOE Alberta
 Type Date of decommissioning ATCO PowerBattle River 1, 256Coal1998 TransAltaWabamun 3140Coal2003 TransAltaWabamun 1,2128Coal2005 EPCORClover Bar629Gas2005 Total Current Decommissioned Generation ( ) 953 Source: DOE Alberta")
24
GHG emission by technology Technologyg/kWh Coal800-1000 LNG Thermal550-650 LNG Combined Cycle450-550 PV80-120 Geothermal40-115 Solar PV50-60 Biomass0-40 Wind20-30 Nuclear 15-25 Hydro-electric10-20 Source: http://www.cna.ca

25
Global Warming effect Source: IPCC

26
Components of the climate system Source: IPCC

27
GHG effect Source: IPCC

29
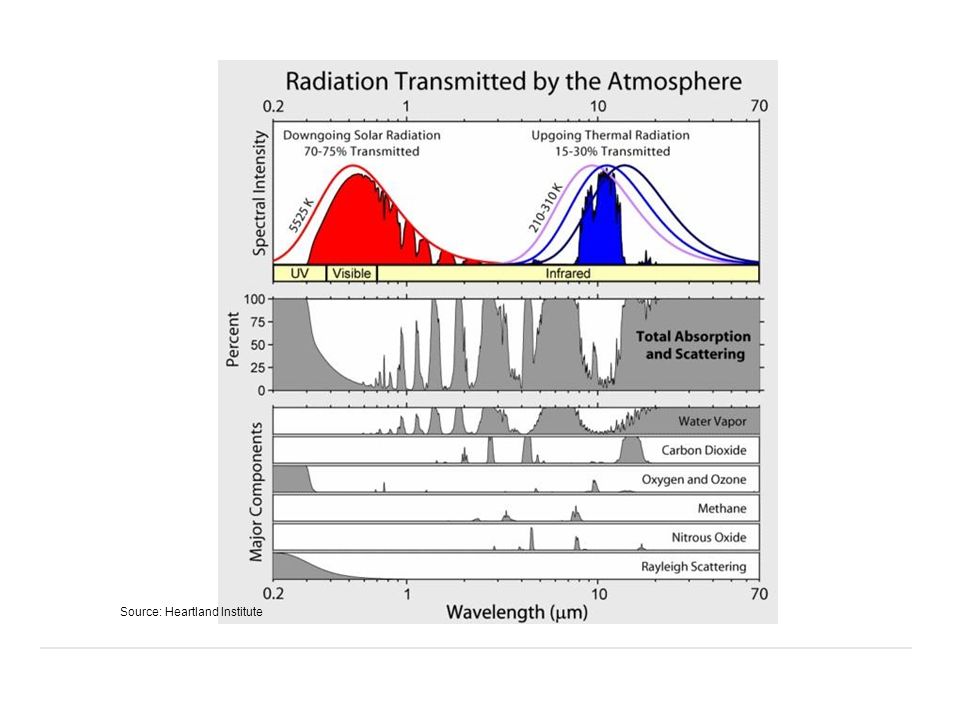
Source: Heartland Institute

33
AB Wind Generation Source: MSA

34
GHG - Federal target GHG 20% reduction from 2006 levels by 2020 60% to 70% reduction from 2006 levels by 2050 18% intensity reduction from 2006 levels in 2010 2% intensity reduction from 2006 per year thereafter up to 26% intensity reduction in 2015 new facilities: 3 yr grace period, then clean fuel standard and 2%/yr reduction AP absolute caps from 2006 levels to be implemented by 2012 NOx (40%); SO2 (55%), VOCs (45%), PM (20%)
; SO2 (55%), VOCs (45%), PM (20%)")
35
GHG Proposed Compliance Mechanisms GHGs Internal reductions Domestic emissions trading, offsets, limited CDM (10%) Technology Fund contributions $15/tonne (2010- 12) rising to $20/ tonne (2013) + GDP escalator (2014-17) Limited early action credits for (15 MT) 1992 to 2006 verified actions AP Domestic ET and link with US trading systems
 Technology Fund contributions $15/tonne ( ) rising to $20/ tonne (2013) + GDP escalator ( ) Limited early action credits for (15 MT) 1992 to 2006 verified actions AP Domestic ET and link with US trading systems")
Similar presentations


: Diversifying the U.S. Electricity Portfolio Marc Santos 2008 ASME WISE Intern University of Massachusetts.>")


>")

 resulting in increased temperatures of the earth and atmosphere,>")
