Download presentation
Presentation is loading. Please wait.

1
Labor Force... Economics 102, Winter 2009B, E, F: Smitka

2
LF Measurements: U NILF... How to measure: concept – Output (USSR) vs Welfare (work as choice) – U vs NILF How to measure: method – Current Population Survey (CPS)
 vs Welfare (work as choice) – U vs NILF How to measure: method – Current Population Survey (CPS).")
3
Using the measure How to adjust – Hours, Wages, Headcount Labor costs = W x H x LF Current examples: voluntary vs involuntary Other issues & concepts – Frictional, Structural, Cyclical – Participation Rates Trends by gender, age (retirement?!) Age structure of population – What is missed: quality...
 Age structure of population – What is missed: quality...")
10
Select data Labor market BLS seasonally adjusted % of civilian labor force Nov 2007Jul 2008Sep 2008Oct 2008Nov 2008Dec Headline Unemployment4.7 5.76.16.5 6.77.2 discouraged workers.0.20.3 0.4 marginally attached.0.6 0.7 0.80.7 involuntary part-time workers.2.93.73.94.34.75.2 Total Underutilization8.4 10.311.011.8 12.513.5 Unemployed 15+ weeks1.62.02.32.6 2.9 Job losers2.32.93.33.73.94.2

16
Japanese Labor Force Participation by Age & Gender

17
Mean age at first marriage Figure 17 Greece Italy Portugal Spain Japan

18
Old-age (65-) share of population 1990200520202040 US 12% 16%20% Australia 11%13%17%23% UK 16% 19%23% France 14%17%21%26% Germany 15%19%22%29% Italy 15%20%24%35% Japan 12%20%29%36% Figure 18
 share of population US 12% 16%20% Australia 11%13%17%23% UK 16% 19%23% France 14%17%21%26% Germany 15%19%22%29% Italy 15%20%24%35% Japan 12%20%29%36% Figure 18")
19
Figure 19

20
Figure 20

21
Figure 21

22
Figure 22

23
Figure 23

24
International Comparison, Women

25
Figure 25

26
Figure 26

27
Figure 27

28
Figure 28

29
Figure 29

30
Figure 30

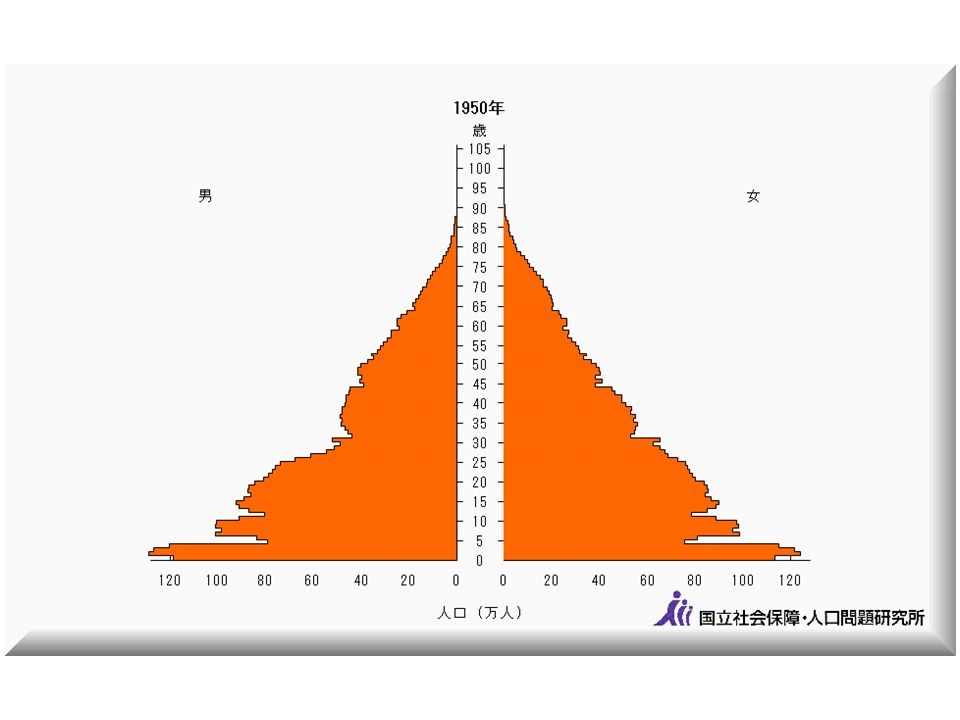
31
Figure 31 Post-WWII baby boom Echo of baby boom as the women of that generation became parents

32
Total Fertility Rate in Japan and Southern Europe Figure 32

33
Fertility in China Figure 33 Peng Xizhe, working paper, Hitotsubashi University, 2006 Fertility Transitions and its Socioeconomic Impacts in China

47
Figure 47

Similar presentations


 survey 60,000 households.>")


