Download presentation
Presentation is loading. Please wait.

1
Steps Continuous Categorical Histogram Scatter Boxplot Child’s Height Linear Regression Dad’s Height Gender Continuous Y X1, X2 X3 Type Variable Mom’s Height

2
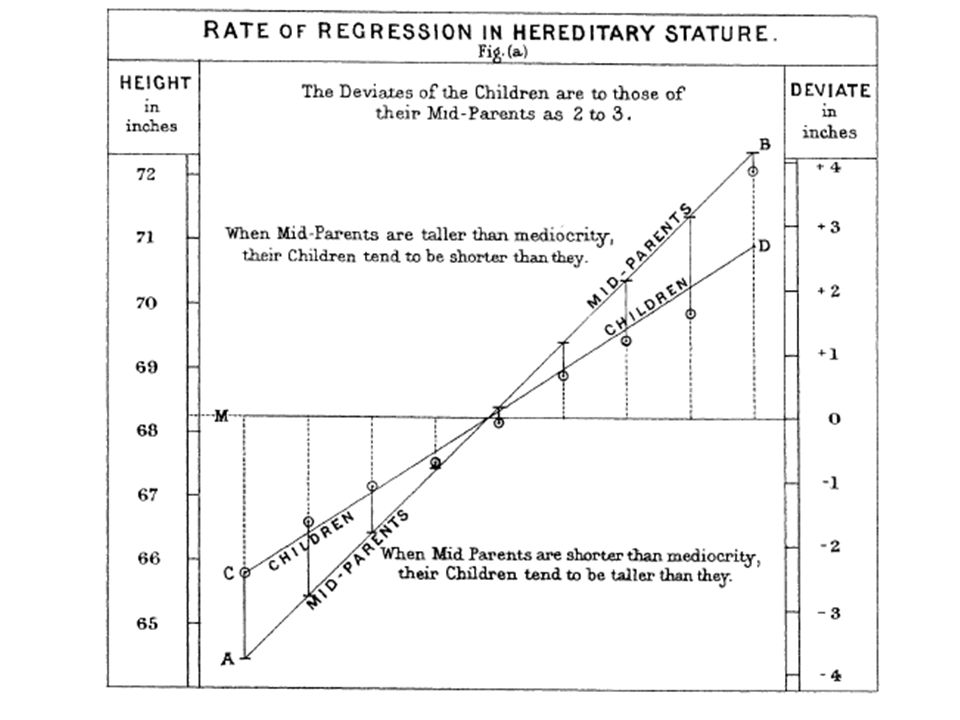
Analytics & History: 1st Regression Line The first “Regression Line”

4
Which line fits the best?

5
Least Squares Regression Sum of Squares

6
Linear Modeling: Regression lm() function – lm stands for ‘linear model’. Model <-lm(outcome ~ predictor(s), data = dataFrame, na.action = an action))
, data = dataFrame, na.action = an action)).")
7
Model 1

8
Compare Models 12345 Father XXX Mom XXX Gender XX R-square r0.270.20.716 R^20.07070.04050.1050.5140.6354 summary(model.1) summary(model.2) summary(model.3) summary(model.4) summary(model.5) model.1 <- lm(childHeight~father, data = h) model.2 <- lm(childHeight~mother, data = h) model.3 <- lm(childHeight~father + mother, data = data =h) model.4 <- lm(childHeight~gender, data = h) model.5 <- lm(childHeight~father + mother + gender, data = h)
 summary(model.2) summary(model.3) summary(model.4) summary(model.5) model.1 <- lm(childHeight~father, data = h) model.2 <- lm(childHeight~mother, data = h) model.3 <- lm(childHeight~father + mother, data = data =h) model.4 <- lm(childHeight~gender, data = h) model.5 <- lm(childHeight~father + mother + gender, data = h)")
9
Model Specification Height = 16.5 + 0.39*father + 0.21mother + 5.21Gender + error Gender: Male: 1 Female: 0

Similar presentations
 measures the strength of the linear relationship.>")


![Project Categories and Questions How to improve [Financial Metric]? Business Science What Determines Height? Government Sports How are School Districts.](/22/6412081/big_thumb.jpg "Project Categories and Questions How to improve [Financial Metric]? Business Science What Determines Height? Government Sports How are School Districts.>")
 Height Outcome, Dependent Variable (Y-Axis)>")


 explain the variability of another variable 2) predict the value of another variable.>")


 Explain prediction error, calculate SSE, and.>")


