Download presentation
Presentation is loading. Please wait.

1
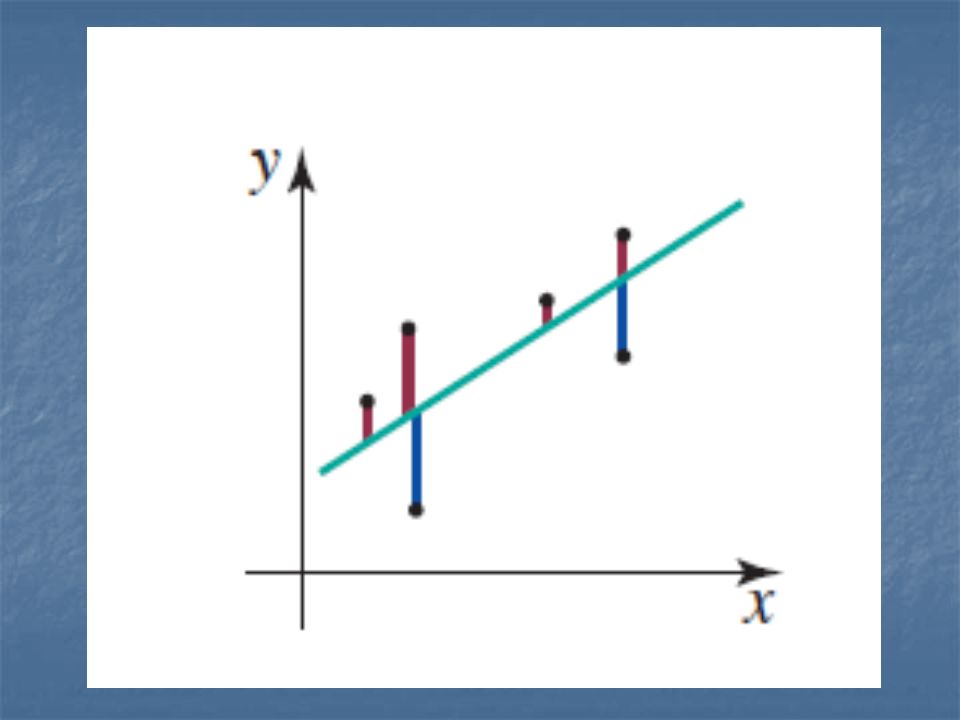
Method 3: Least squares regression

2
Another method for finding the equation of a straight line which is fitted to data is known as the method of least-squares regression. It is used when data show a linear relationship and have no obvious outliers. The least-squares regression equation minimises the average deviation of the points in the data set from the line of best fit.

4
The general form of the least-squares regression line is y = mx + c

6
The following summary details were calculated from a study to find a relationship between mathematics exam marks and English exam marks from the results of 120 Year 10 students. Mean mathematics exam mark = 64% Mean English exam mark = 74% Standard deviation of mathematics exam mark = 14.5% Standard deviation of English exam mark = 9.8% Correlation coefficient, r = 0.64 The form of the least-squares regression line is to be: Mathematics exam mark = m × English exam mark + c a Which variable is the dependent variable (y-variable)? b Calculate the value of m for the least-squares regression line. c Calculate the value of c for the least-squares regression line. d Use the regression line to predict the expected mathematics exam mark if a student scores 85% in an English exam (to the nearest percentage).
. b Calculate the value of m for the least-squares regression line. c Calculate the value of c for the least-squares regression line. d Use the regression line to predict the expected mathematics exam mark if a student scores 85% in an English exam (to the nearest percentage)..")
Similar presentations


 Learning Objective: to create a scatter plot and use the calculator to find the line of best fit and make predictions. (same as.>")