Download presentation
Presentation is loading. Please wait.

1
CHAPTER 15 EXPLORING RELATIONSHIPS 15.1 INTRODUCTION EXPLANATORY VARIABLE

2
The most common data analysis situations in the business arena Response variable is measured Explanatory variable is either attribute or measured

3
15.2 COMMON DATA-ANALYSIS METHODOLOGY STEP 1 Framework for defining a Data-Analysis A clear idea of what is meant by a connection between the response variable and the explanatory variable. STEP 2 Initial Data Analysis (IDA) To use some simple sample descriptive statistics to have a first look at the nature of the link between the variables Strong evidence to support a link No evidence of a link Inconclusive and further more sophisticated data analysis is required.
 To use some simple sample descriptive statistics to have a first look at the nature of the link between the variables Strong evidence to support a link No evidence of a link Inconclusive and further more sophisticated data analysis is required..")
4
STEP 3 Further Data Analysis (FDA) The sample evidence is consistent with there being no link/connection/relationship between the response variable and the explanatory variable. The sample evidence is consistent with there being a link/connection/relationship between the response variable and the explanatory variable STEP 4 Describe Relationship How to undertake and interpret the I.D.A. How to undertake and interpret the Further Data Analysis.

5
No– No evidence of a relationship Yes-- there is evidence of a relationship, in which case the link needs to be described.

6
Example 1 A university investigates the salary of its graduates five years after graduating

7
Example 2 CREDIT Scenario

8
15.3 EXPLORING RELATIONSHIPS 1 MEASURED RESPONSE VARIABLE ---- ATTRIBUTE EXPLANATORY VARIABLE Definition There is a relationship between a measured response and an attribute explanatory variable if the average value of the response is dependent on the level of the attribute explanatory variable.

9
There is no link Given a measured response and an attribute explanatory variable with two levels, 1 & 2. If the statistical distribution of the response variable for attribute level 1 and attribute level 2 are exactly the same then the level of the attribute variable has no influence on the value response

10
There is a link Given a measured response and an attribute explanatory variable with two levels, 1 & 2. If the statistical distribution of the response variable for attribute level 1 and attribute level 2 have different means then the level of the attribute variable does influence the response variable.

11
Illustrative Example Response Variable: Amount Spent on Clothes per month Attribute Explanatory Variable: Gender (Male/Female) Irrespective of the shape/structure of the distributions, Equal means for no connection Unequal means for a connection
 Irrespective of the shape/structure of the distributions, Equal means for no connection Unequal means for a connection")
12
15.4 WORKING WITH SAMPLE DATA The Initial Data Analysis (I.D.A) Calculating the mean value of the response variable for each level of the explanatory attribute variable Constructing the boxplots for each level of the explanatory attribute variable
 Calculating the mean value of the response variable for each level of the explanatory attribute variable Constructing the boxplots for each level of the explanatory attribute variable")
13
Outcome 1 Response Variable: Amount Spent on Clothes per month Attribute Explanatory Variable: Gender (Male/Female) Mean Attribute variable level 1 Mean = 50 Attribute variable level 2 Mean = 50 Boxplot
 Mean Attribute variable level 1 Mean = 50 Attribute variable level 2 Mean = 50 Boxplot")
14
Interpretation: The amount spent on clothes is not gender specific, i.e. gender is not a factor that influences spending on clothes. In this situation there is clearly no connection/relationship.

15
Outcome 2 Response Variable: Amount Spent on Clothes per month Attribute Explanatory Variable: Gender (Male/Female) Mean Attribute variable level 1 Mean = 25 Attribute variable level 2 Mean = 75 Boxplot
 Mean Attribute variable level 1 Mean = 25 Attribute variable level 2 Mean = 75 Boxplot")
16
Interpretation: The amount spent on clothes is gender specific, i.e. gender is a factor that influences spending on clothes. Females spend on average £50 per month more on clothes than Males. In this situation there is clearly a connection/relationship

17
Outcome 3 Response Variable: Amount Spent on Clothes per month Attribute Explanatory Variable: Gender (Male/Female) Mean Attribute variable level 1 Mean = 45 Attribute variable level 2 Mean = 55 Boxplot
 Mean Attribute variable level 1 Mean = 45 Attribute variable level 2 Mean = 55 Boxplot")
18
Interpretation There is not enough evidence to form a clear judgement In this situation the evidence is insufficient to draw a conclusion and further data analysis is required.

19
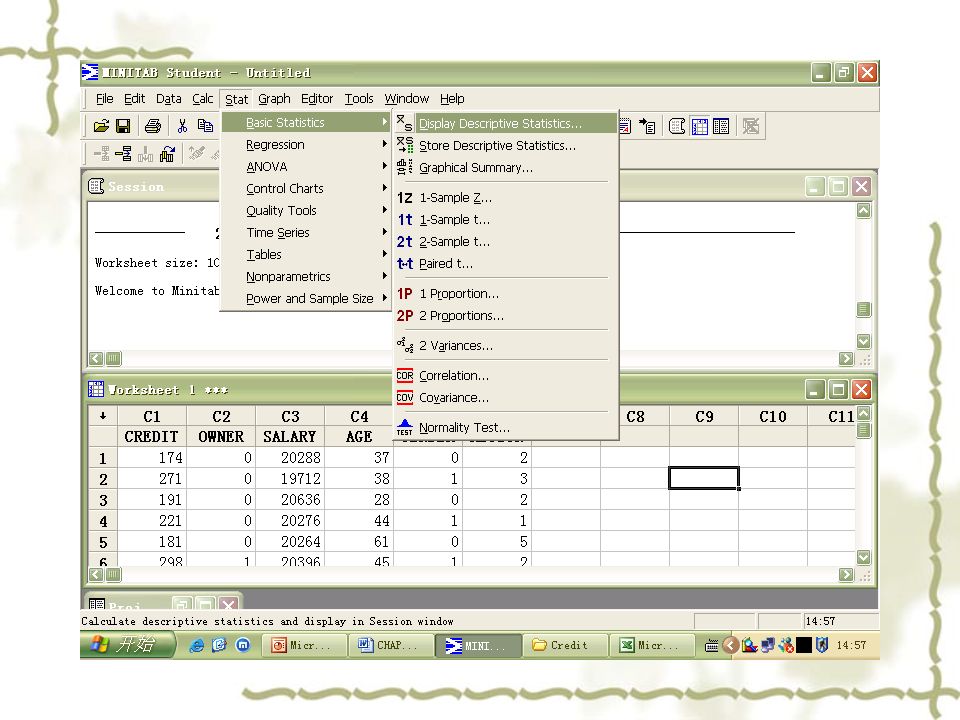
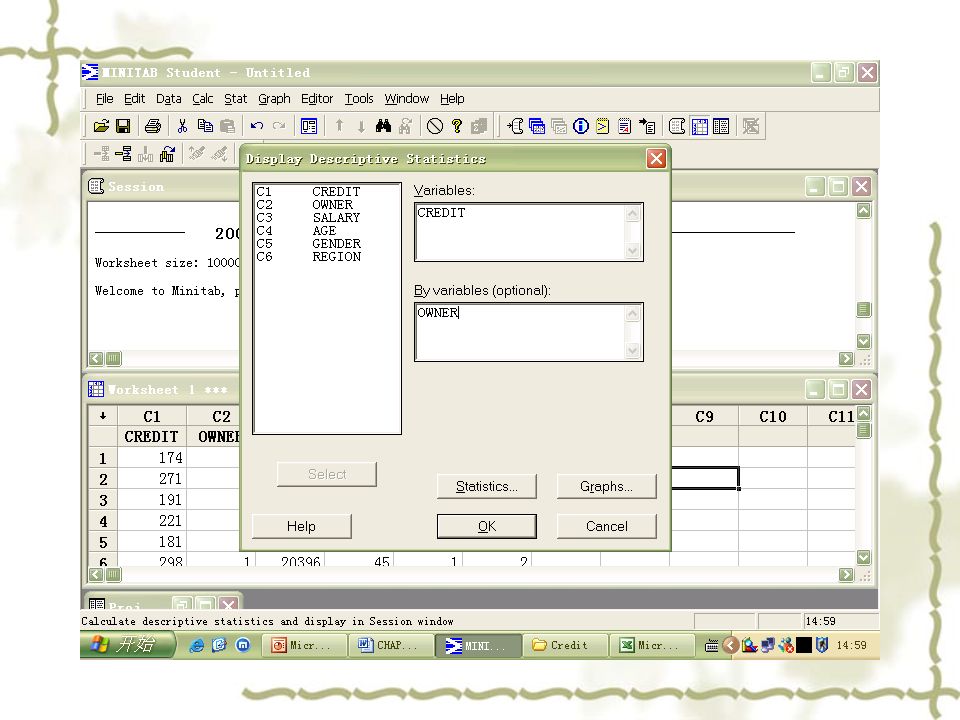
15.5 THE INITIAL DATA ANALYSIS AND MINITAB To investigate the relationship between: 'Amount Borrowed on Credit' and 'Does the customer own their own house?' (Coded 0=Yes; 1=No) CREDIT DATA is loaded Command: Stat-Display Describes Statistics (Following graphs)
 CREDIT DATA is loaded Command: Stat-Display Describes Statistics (Following graphs)")
22
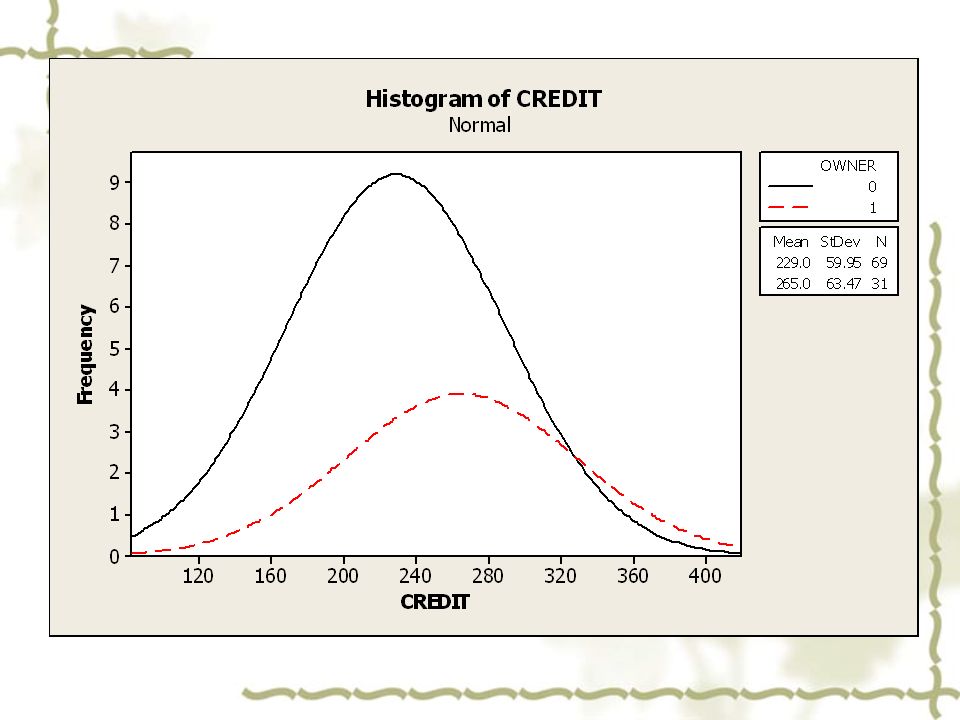
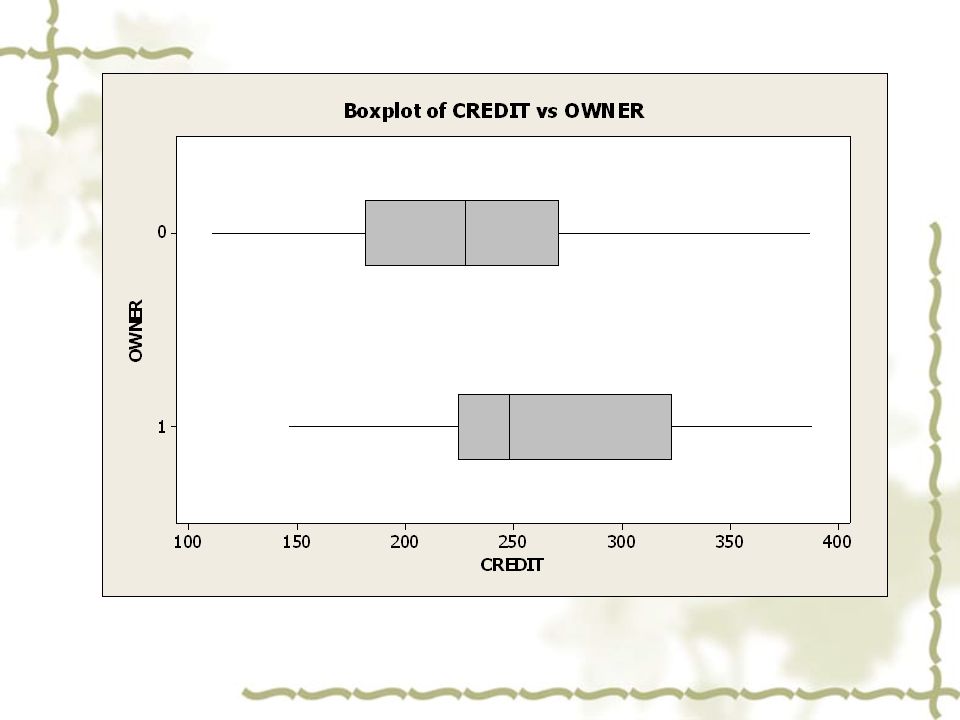
Variable OWNER N Mean StDev Minimum Q1 Median Q3 Maximum CREDIT 0 69 229.04 59.95 111.00 182.00 228.00 271.00 387.00 1 31 265.0 63.5 146.0 225.0 248.0 323.0 388.0

25
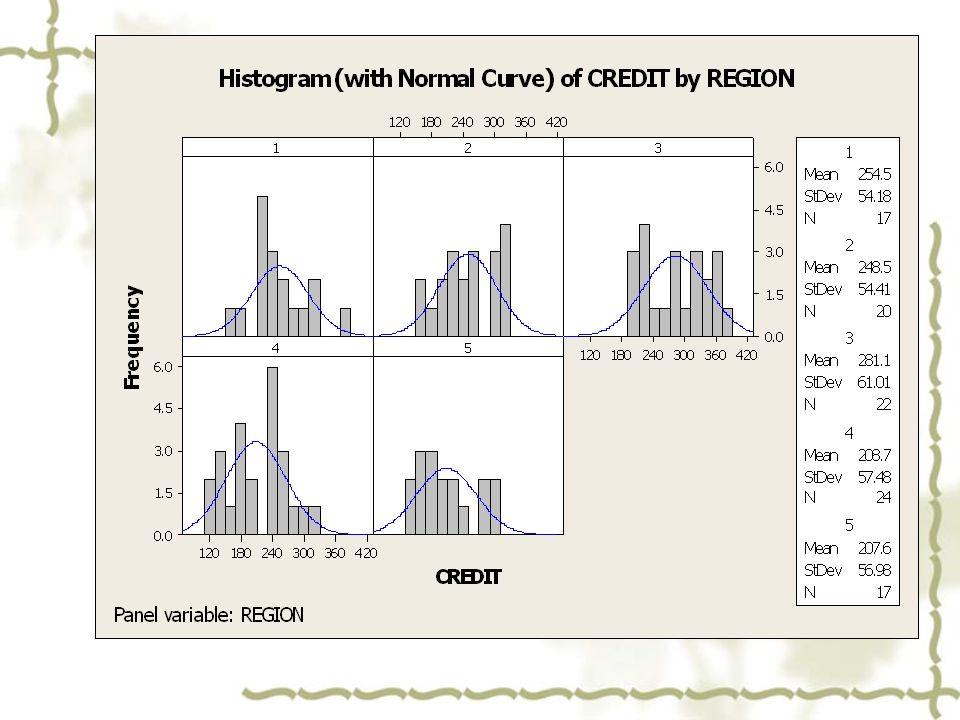
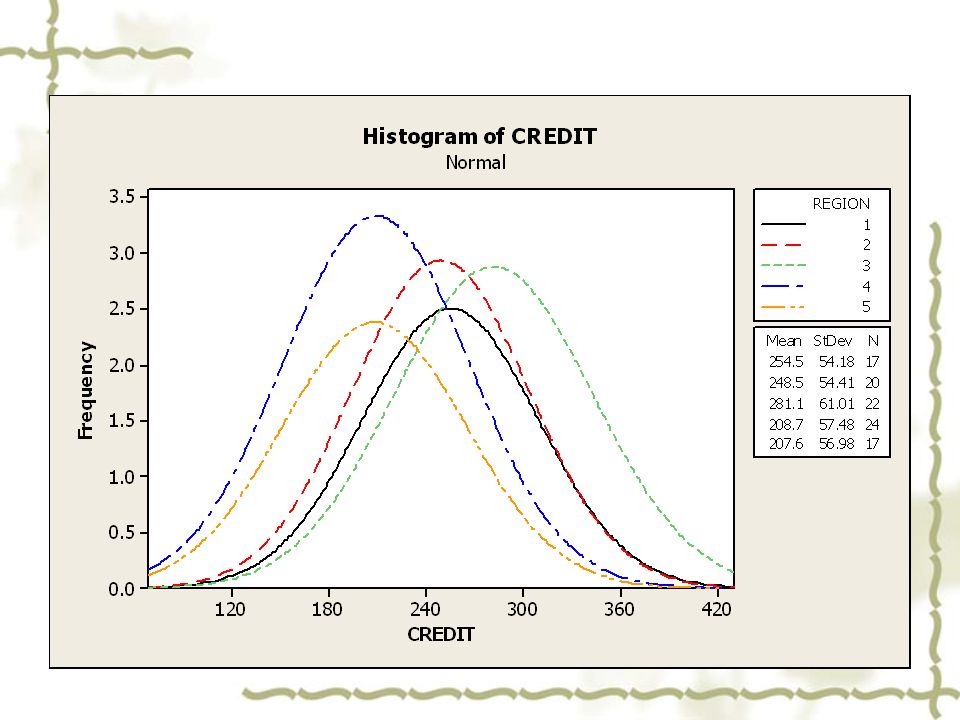
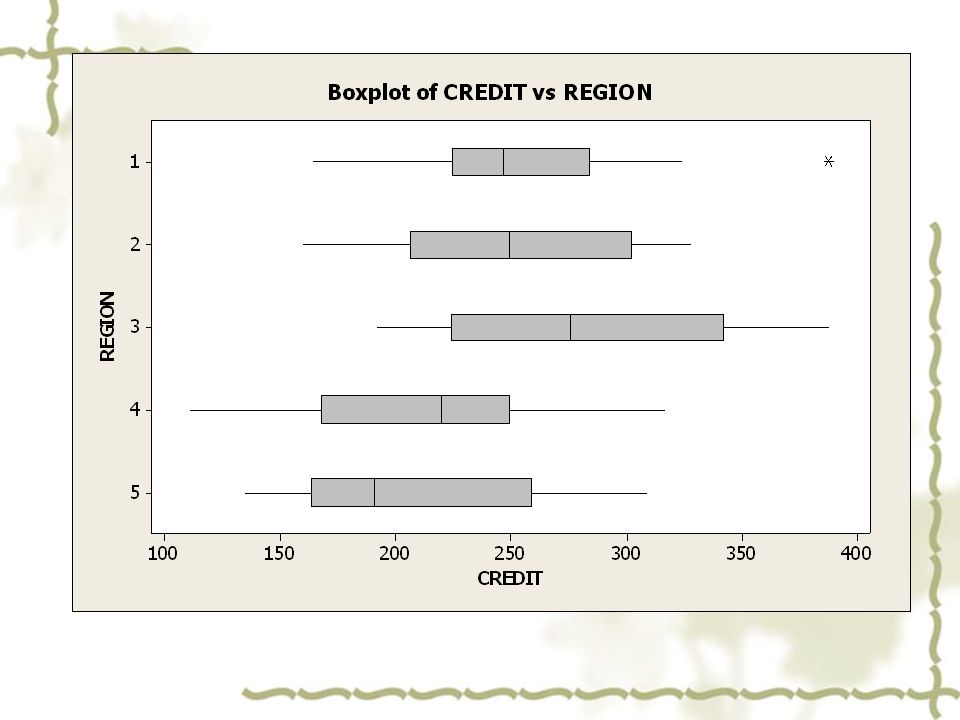
To investigate the connection/link between The response variable 'Amount Borrowed on Credit' and attribute explanatory variable 'Region' which has five levels is illustrated below: Variable REGION N Mean StDev Minimum Q1 Median Q3 Maximum CREDIT 1 17 254.5 54.2 164.0 225.0 247.0 284.0 387.0 2 20 248.5 54.4 160.0 206.5 249.5 302.5 328.0 3 22 281.1 61.0 192.0 224.0 276.0 342.0 388.0 4 24 208.7 57.5 111.0 168.0 219.5 249.3 317.0 5 17 207.6 57.0 135.0 163.5 191.0 259.0 309.0

29
15.6 SUMMARY The Data Analysis Situations Four data analysis situations Only discuss a measured response variable Definition of connection/link/Relationship The formal definition of no link is: If the average value of the response variable is independent of the level of the attribute explanatory variable then the response variable and the attribute explanatory variable are independent (not connected).
.")
30
The formal definition of link is: If the average value of the response variable is dependent on the level of the attribute explanatory variable then the attribute explanatory variable influences the value of the response variable, so the response variable and the attribute explanatory variable are connected. The Data Analysis Methodology (Figure 2 ) The Initial Data Analysis (I.D.A): The Further Data Analysis (FDA), if required: Describe the connection if one exists.
 The Initial Data Analysis (I.D.A): The Further Data Analysis (FDA), if required: Describe the connection if one exists..")
Similar presentations


 For now, approximating.>")


 QSCI 381 – Lecture 5 (Larson and Farber, Sects 2.3 and 2.5)>")


He is in the 90 th percentile for weight 2)He is in the 95 th percentile.>")