Download presentation
Presentation is loading. Please wait.

1
Selecting a Sample

2
outline Difference between sampling in quantitative & qualitative research

3
Sampling in quantitative vs. qualitative research Quantitative Unbiased : Randomness is used to avoid this Represents the population from where it’s drawn Qualitative Ease in accessing the respondents Personal judgment A case that is similar or totally different from rest of the group

4
Sample in Quantitative Research Purpose: To draw inferences about the group from where it’s selected Considerable importance is given to sample size Sample: subgroup of the population you are interested in Sample size: guided by a predetermined sample size that is based on many considerations in addition to the resources available Larger the sample size -- more representative of the population

5
Sampling in quantitative research Concept of sampling: Example 1: Find out the average age of students in a class Consider all students in study to calculate average age Consider only few to estimate average age Example 2: Find out the average income of families living in a city ????

6
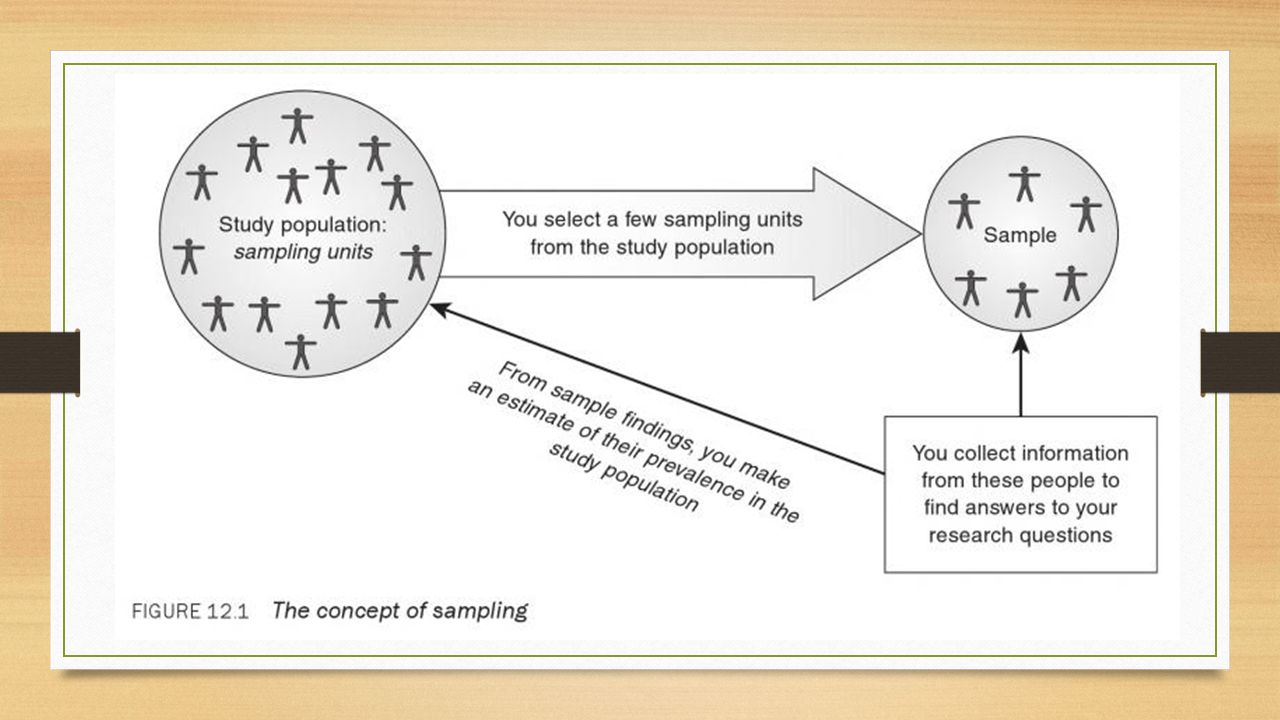
Sampling Process of selecting a few (a sample) from a bigger group (population) to become the basis for estimating or predicting the prevalence of an unknown piece of information, situation, or outcome regarding the bigger group
 from a bigger group (population) to become the basis for estimating or predicting the prevalence of an unknown piece of information, situation, or outcome regarding the bigger group")
8
Advantages and Disadvantages of Sampling Sampling is a trade-off between certain benefits and disadvatages Saves time and resources Does not give information about the population characteristics but only estimates or predictions about it Therefore, possibility of error in the estimation exists – compromising the level of accuracy in your findings

9
Sampling Terminology Study Population A bigger group from you select your sample (N) Sample Small portion of population from which you collect the required information Sample size Total number of candidates/elements in a sample (n) Sampling design or sampling strategy The way you select your sample Sampling unit or element Individuals in the sample Sampling frame A list identifying each element in the sample Sample statistics Findings based on information obtained from sample
 Sample Small portion of population from which you collect the required information Sample size Total number of candidates/elements in a sample (n) Sampling design or sampling strategy The way you select your sample Sampling unit or element Individuals in the sample Sampling frame A list identifying each element in the sample Sample statistics Findings based on information obtained from sample")
10
Radomisation Each unit should have an equal and independent chance of selection in the sample – unbiased sample

11
Principles of Sampling

12
Principle 1 Example: A=18, B=20, C=23, D=25: Mean = 21.5 Now you want sample of two individuals to make an estimate of the population mean The difference between sample statistics and population mean is known as Sampling Error

13
Principle 1 1. In majority of cases of sampling there will be a difference between the sample statistics and the true population mean, which is attributable to the selection of the units in the sample

14
Principle 2 Now you want sample of three individuals to make an estimate of the population mean A+B+C = 18 +20+23 = 61/3 = 20.22 A+B+D = 18+20+25 = 63/3 = 21 A+C+D = 18+23+25 = 66/3 = 22 B+C+D = 20+23+25 = 68/3 = 22.67 Sampling Error

15
Principle 2 1. The greater the sample size, the more accurate the estimate of the true population mean

16
Principle 3 1. The greater the difference in the variable under study in a population for a given sample size, the greater the difference between the sample statistics and the true population mean

17
Factors Effecting the Estimates Size of the sample Extent of variation in the sampling population

18
Aims in selecting a sample To achieve maximum precision in your estimates and to avoid bias in the selection of sample Bias can occur if: Sampling is done by a non-random method Sampling frame does not cover the sampling population accurately and completely A section of a sampling population is impossible to find or refuses to cooperate

19
Types of Sampling

20
Random/Probability Sampling Each element in the population has an equal and independent chance of selection Equal – probability of selection of each element in the population is the same Independent - choice of one element is not dependent upon the choice of another element in the sampling Advantages Inferences drawn can be generalized to the total sampling population Statistical test based on theory of probability can be applied

21
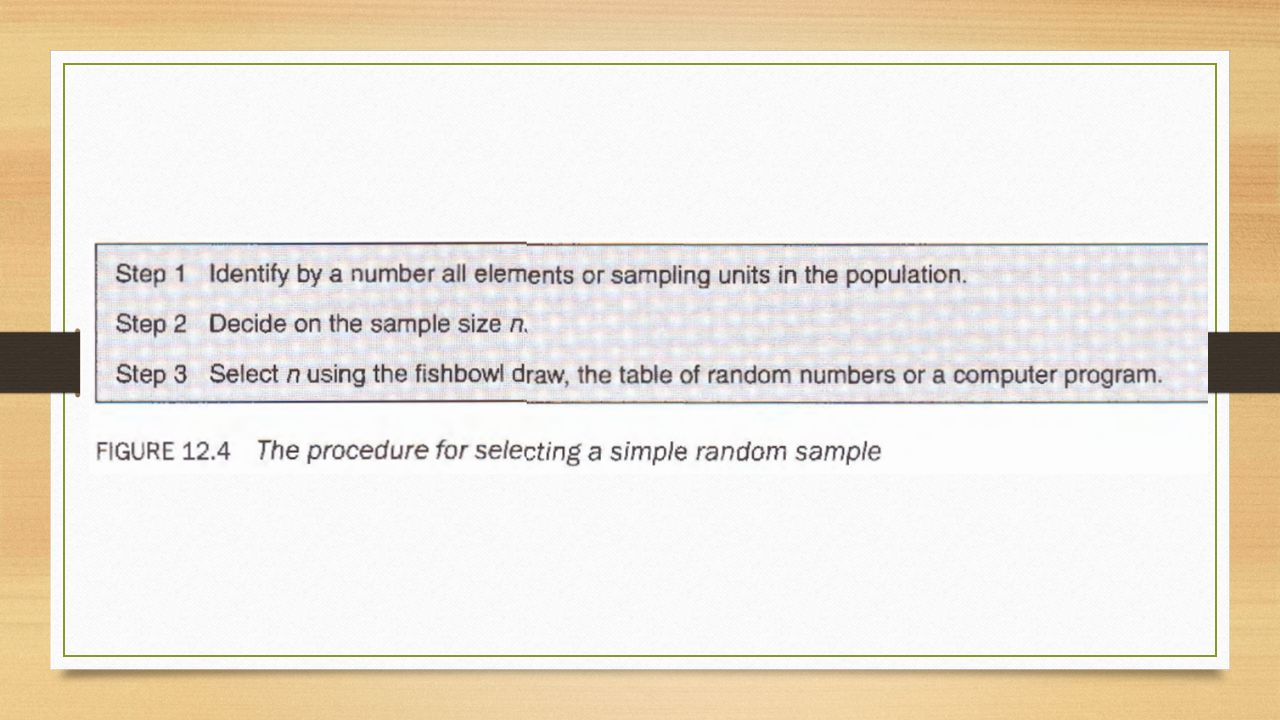
Methods of Drawing Random Samples Fishbowl draw Computer program Random number table Sampling with or without replacement

22
Specific Random Sampling Designs Simple random sampling (SRS) Stratified random sampling Proportionate Disproportionate Cluster Sampling
 Stratified random sampling Proportionate Disproportionate Cluster Sampling")
25
Non-Random sampling designs Does not follow theory of probability in sample selection Used when either the number of elements in a population is either unknown or cannot be individually identified Quota sampling Accidental sampling Judgmental sampling Expert sampling Snowball sampling

26
Mixed/systematic sampling

27
Sample size Larger the sample size, the more accurate your estimates See your text book to know how to calculate sample size.

Similar presentations


 RTI, JAIPUR1 STATISTICAL SAMPLING Presented By RTI, JAIPUR.>")


