Download presentation
Presentation is loading. Please wait.

1
STATISTICAL QUALITY CONTROL (S.Q.C.) PRESENTED BY-: NIKHIL GARG ROLL NO- 0129626
 PRESENTED BY-: NIKHIL GARG ROLL NO")
2
Contents-:Meaning……………. Definitions ………… Characteristics……… Causes of variations………. Methods of S.Q.C……….. Process Control-: Process Control-: Control Chart……….. Control Chart……….. Purpose & uses of control charts………. Purpose & uses of control charts………. Types of control charts……… Types of control charts……… Control charts for variables-: Control charts for variables-: Chart…… Chart…… R Chart …… R Chart …… σ Chart……… σ Chart………

3
Control chart for attributes-: p-chart………… np-chart…...... C-Chart………… Product Control/Acceptance Sampling-: Meaning………….. Definition…………. Risks in Acceptance Sampling-: Producer’s Risk………. Consumer’s Risk………. Types of Sampling Inspection plans-: Single Sampling plan……… Double Sampling Plan…….. Multiple Sampling Plan……. Advantages of S.Q.C…………… Limitations of S.Q.C……………. Control chart for attributes-: p-chart………… np-chart…...... C-Chart………… Product Control/Acceptance Sampling-: Meaning………….. Definition…………. Risks in Acceptance Sampling-: Producer’s Risk………. Consumer’s Risk………. Types of Sampling Inspection plans-: Single Sampling plan……… Double Sampling Plan…….. Multiple Sampling Plan……. Advantages of S.Q.C…………… Limitations of S.Q.C…………….

4
Acknowledgement-: Mrs. Sheenu Khurana our Business Statistics lecturer. Without her guidance & suggestions this work is not possible…..

5
MEANING-: manufactured Refers to the use of statistical techniques in controlling the quality of goods. Means of establishing & achieving quality specification, which requires use of tools & techniques of statistics.

6
DEFINATION-: “Statistical quality control can be simply defined as an economic & effective system of maintaining & improving the quality of outputs throughout the whole operating process of specification, production & inspection based on continuous testing with random samples.” By-: By-: YA LUN CHOU YA LUN CHOU

7
Definition-: “Statistical quality control should be viewed as a kit of tools which may influence decisions to the functions of specification, production or inspection. By-: By-: EUGENE L. GRANT EUGENE L. GRANT

8
CHARACTERISTICS OF S.Q.C.-: Designed to control quality standard of goods produced for marketing. Exercise by the producers during production to assess the quality of goods. Carried out with the help of certain statistical tools like Mean Chart, Range Chart, P-Chart, C-Chart etc. Designed to determine the variations in quality of the goods & limits of tolerance.

9
CAUSES OF VARIATIONS IN QUALITY-: 1. ASSIGNABLE CAUSES-: It refers to those changes in the quality of the products which can be assigned or attributed to any particular causes like defective materials, defective labour, etc. 2. CHANCE CAUSES-: These causes take place as per chance or in a random fashion as a result of the cumulative effect of a multiplicity of several minor causes which cannot be identified. These causes are inherent in every type of production.

10
METHODS OF S.Q.C.-: 1. PROCESS CONTROL-: Under this the quality of the products is controlled while the products are in the process of production. The process control is secured with the technique of control charts. Control charts are also used in the field of advertising, packing etc. They ensures that whether the products confirm to the specified quality standard or not. The process control is secured with the technique of control charts. Control charts are also used in the field of advertising, packing etc. They ensures that whether the products confirm to the specified quality standard or not.

11
A control chart is a time plot of a statistic, such as a sample mean, range, standard deviation, or proportion, with a center line and upper and lower control limits. The limits give the desired range of values for the statistic. When the statistic is outside the bounds, or when its time plot reveals certain patterns, the process may be out of control. A process is considered in statistical control if it has no assignable causes, only natural variation. UCL LCL Center Line Time Value This point is out of the control limits 33 33 Control Chart

12
PURPOSE & USES OF CONTROL CHARTS 1. Helps in determining the quality standard of the products. 2. Helps in detecting the chance & assignable variations in the quality standards by setting two control limits. 3. Reveals variations in the quality standards of the products from the desired level. 4. Indicates whether the production process is in control or not. 5. Ensures less inspection cost & time in the process control.

13
Types-: Types of Control Charts Control Charts for Variables ChartR-Chart σ -Chart Control Charts for Attributes p-Chartnp-ChartC-Chart

14
CONTROL CHATS FOR VARIABLES CHART/ MEAN CHART-: CHART/ MEAN CHART-: This chart is constructed for controlling the variations in the average quality standard of the products in a production process. R-CHART-: This chart is constructed for controlling the variations in the dispersion or variability of the quality standards of the products in a production process.

15
EXAMPLE-: Sample No. Weights 12345 20 15 10 11 14 12 18 10 8 22 21 19 17 10 13 15 12 19 14 20 20 19 26 12 23 Conversion factors for n=5, A 2 =0.577, D 3 =0, D 4 =2.115

16
Solution-: Sample no. Weights (X) Total Weights (ΣX) =(ΣX/5) RangeR=(L-S) 12345K=5 20 15 10 11 14 12 18 10 8 22 21 19 17 10 13 15 12 19 14 20 20 19 26 12 23 707080801001414161620 Σ =80 101411814 ΣR=57
 Total Weights (ΣX) =(ΣX/5) RangeR=(L-S) 12345K= Σ = ΣR=57.")
17
Grand = Σ /K = 80/5=16 Grand Chart Grand = 16 (Central line) Control limits-: UCL = Grand + A 2 = 16 + 0.577 x 11.4 = 16 + 0.577 x 11.4 = 22.577 = 22.577 LCL = Grand - A 2 = 16 – 0.577 x 11.4 = 16 – 0.577 x 11.4 = 9.423 = 9.423
 Control limits-: UCL = Grand + A 2 = x 11.4 = x 11.4 = = LCL = Grand - A 2 = 16 – x 11.4 = 16 – x 11.4 = = 9.423")
18
= Σ R/K = 57/5 = 11.4 Range Chart = 11.4 (Central line) Control limits-: UCL = D 4. UCL = D 4. = 2.115 x 11.4 = 2.115 x 11.4 = 24.09 = 24.09 LCL = D 3. LCL = D 3. = 0 x 11.4 = 0 x 11.4 = 0 = 0

19
σ Chart-: This chart is constructed to get a better picture of the variations in the quality standard in a process than that is obtained from the range chart provided the standard deviation(σ) of the various samples are readily available. Example-: Quality control is maintained in a factory with the help of standard deviation chart. Ten items are chosen in every sample. 18 samples in all were chosen whose ΣS was 8.28. Determine the three sigma limits of σ- chart. You may use the following-: n = 10, B 3 = 0.28, B 4 = 1.72, K = 18. Solution-: = ΣS/K = 8.28/18 = 0.46 UCL = B 4. LCL = B 3. = 1.72 x 0.46 = 0.28 x 0.46 = 1.72 x 0.46 = 0.28 x 0.46 = 0.7912 = 0.1288 = 0.7912 = 0.1288

20
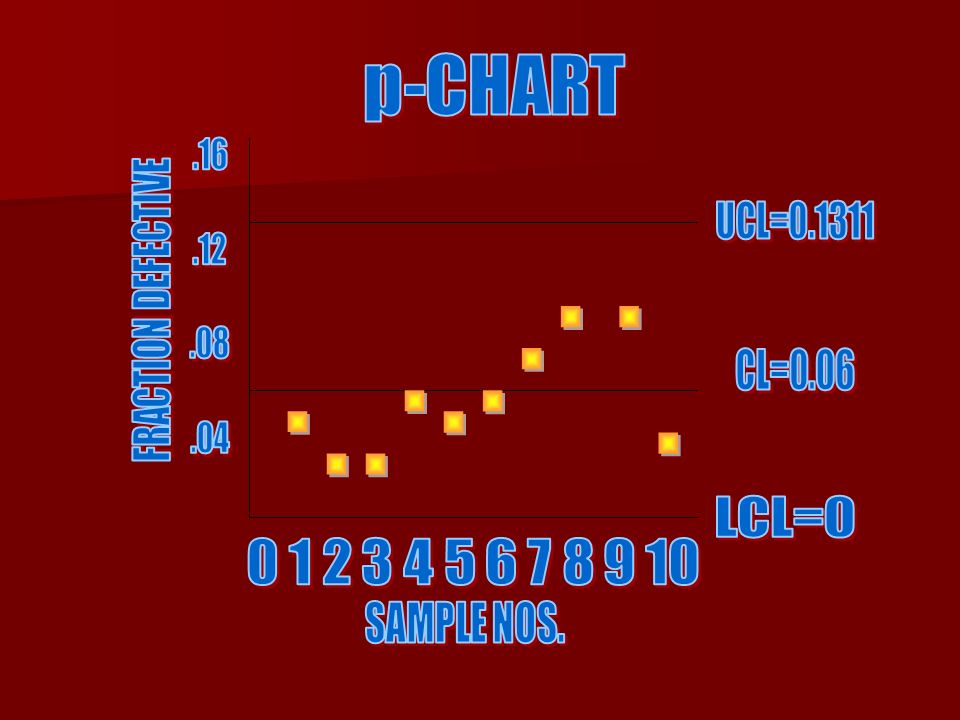
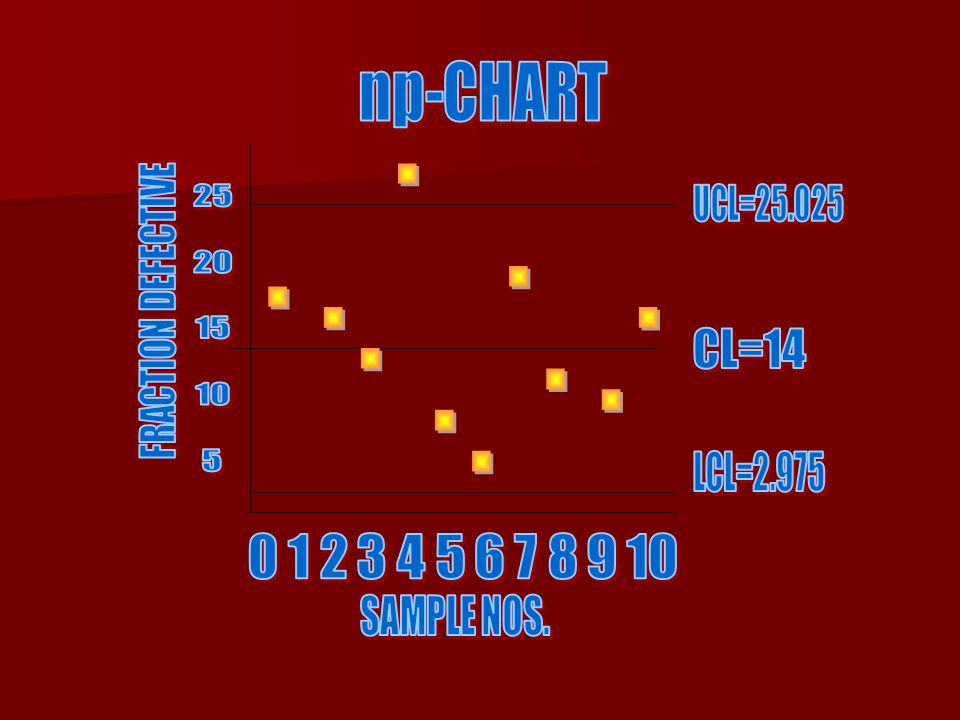
Control Charts for Attributes-: p-chart-: This chart is constructed for controlling the quality standard in the average fraction defective of the products in a process when the observed sample items are classified into defectives & non- defectives. np-chart-: This chart is constructed for controlling the quality standard of attributes in a process where the sample size is equal & it is required to plot the no. of defectives (np) in samples instead of fraction defectives (p).
 in samples instead of fraction defectives (p)..")
21
Example-: Sample No. Size of sample (n) No. of defectives (d) Fraction defectives (d/n) 123456789101001001001001001001001001001005336568101040.050.030.030.060.050.060.080.10.10.04 K = 10 Σd = 60
 Fraction defectives (d/n) K = 10 Σd = 60.")
22
= Total no. of defectives/Total no. of units = 60/1000 = 0.06 »q ̅ = 1- = 1- 0.06 = 0.94 = 0.06 (central line) UCL = + 3 √ . q ̅ /n = 0.06 + 3√0.06x0.94/100 = 0.1311 LCL = - 3 √ . q ̅ /n = 0.06 - 3 √ 0.06x0.94/100 = -0.0111 = 0
 UCL = + 3 √ . q ̅ /n = √0.06x0.94/100 = LCL = - 3 √ . q ̅ /n = √ 0.06x0.94/100 = = 0.")
24
Example-: An inspection of 10 samples of size 400 each from 10 lots reveal the following number of defectives: 17, 15, 14, 26, 9, 4, 19, 12, 9, 15 Calculate control limits for the no. of defective units. Solution-: n = 400, k (No. of samples) = 10, Σd (total no. of defectives) = 140 n = Σd/k = 140/10 = 14 Now, = n /n = 14/400 = 0.035, »q ̅ = 1- = 1- 0.035 = 0.965 n = 14 (central line) UCL= n + 3 √ n q ̅ LCL= n - 3 √ n q ̅ = 14 + 3 √400x0.035x0.965 = 14 - 3 √400x0.035x0.965 = 25.025 = 2.975 = 25.025 = 2.975
 = 10, Σd (total no. of defectives) = 140 n = Σd/k = 140/10 = 14 Now, = n /n = 14/400 = 0.035, »q ̅ = 1- = = n = 14 (central line) UCL= n + 3 √ n q ̅ LCL= n - 3 √ n q ̅ = √400x0.035x0.965 = √400x0.035x0.965 = = = =")
26
C-Chart-: This chart is used for the control of no. of defects per unit say a piece of cloth/glass/paper/bottle which may contain more than one defect. The inspection unit in this chart will be a single unit of product. The probability of occurrence of each defect tends to remain very small.

27
USES-: The following are the field of application of C-Chart-: Number of defects of all kinds of aircraft final assembly. Number of defects of all kinds of aircraft final assembly. Number of defects counted in a roll of coated paper, sheet of photographic film, bale of cloth etc. Number of defects counted in a roll of coated paper, sheet of photographic film, bale of cloth etc.

28
ACCEPTANCE SAMPLING Meaning-: Another major area of S.Q.C. is “Product Control” or “Acceptance Sampling”. It is concerned with the inspection of manufactured products. The items are inspected to know whether to accept a lot of items conforming to standards of quality or reject a lot as non- conforming.

29
DEFINATION-: “ Acceptance Sampling is concerned with the decision to accept a mass of manufactured items as conforming to standards of quality or to reject the mass as non-conforming to quality. The decision is reached through sampling.” By-: By-: SIMPSON AND KAFKA SIMPSON AND KAFKA

30
Risks in Acceptance sampling 1. Producer’s risk-: Sometimes inspite of good quality, the sample taken may show defective units as such the lot will be rejected, such type of risk is known as producer’s risk. 2. Consumer’s Risk-: Sometimes the quality of the lot is not good but the sample results show good quality units as such the consumer has to accept a defective lot, such a risk is known as consumer’s risk.

31
Types of Sampling Inspection Plan Single Sampling Plan-: Under single sampling plan, a sample of ‘n’ items is first chosen at random from a lot of N items. If the sample contains, say, ‘c’ or few defectives, the lot is accepted, while if it contains more than ‘c’ defectives, the lot is rejected (‘c’ is known as ‘acceptance number’).
..")
32
Single Sampling Plan Count the no. of defectives, ‘d’ in the sample of size ‘n’ Is ‘d’ ≤ ‘c’ If yes, than accept the lot If no, then reject the lot

33
Double Sampling Plan-: Under this sampling plan, a sample of ‘n 1 ’ items is first chosen at random from the lot of size ‘N’. If the sample contains, say, ‘c 1 ’ or few defectives, the lot is accepted; if it contains more than ‘c 2 ’ defectives, the lot is rejected. If however, the number of defectives in the sample exceeds ‘c 1 ’, but is not more than ‘c 2 ’, a second sample of ‘n 2 ’ items is take from the same lot. If now, the total no. of defectives in the two samples together does not exceed ‘c 2 ’, the lot is accepted; otherwise it is rejected. (‘c 1 ’ is known as acceptance no. for the first sample & ‘c 2 ’ is the acceptance no. of both the samples taken together)
.")
34
Double Sampling Plan-: Count the no. of defectives, d1in the first sample of size n1 Is d1 ≤ c1 ? If No, then check If c1 ≤ d1 ≥ c 2 ? Draw another sample of size n2 Count the no. of defectives d2 in this sample Is d1 + d2 ≤ c 2 If No, reject the lot If yes, then accept the lot. If yes, accept the lot

35
Multiple Sampling Plan-: Under this sampling plan, a decision to accept or reject a lot is taken after inspecting more than two samples of small size each. In this plan, units are examined one at a time & after examining each unit decision is taken. “However, such plan are very complicated & hence rarely used in practice.”

36
ADVANTAGES OF S.Q.C.-: Helpful in controlling quality of a product Eliminate Assignable causes of variation Better quality at lower inspection cost Useful to both consumers & producers It makes workers quality conscious Helps in earn goodwill

37
LIMITATIONS-: Does not serve as a ‘PANACEA’ for all quality evils. It cannot be used to all production process. It involves mathematical & statistical problems in the process of analysis & interpretation of variations in quality. Provides only an information services.

38
THE END

Similar presentations


>")


