Download presentation
Presentation is loading. Please wait.

1
6.3 Graphing Sine and Cosine Functions Objective: Use the graphs of the sine and cosine functions.

2
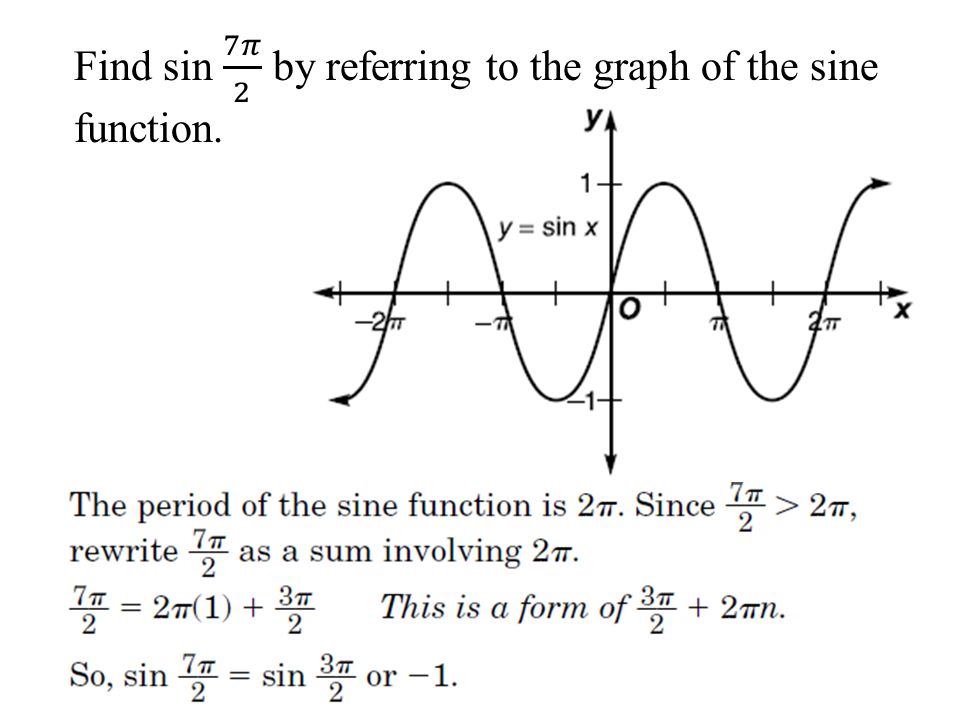
If the values of a function are the same for each given interval of the domain, the function is said to periodic. Consider the graphs of y = sin x and y = cos x shown here. Notice that for both graphs the period is 2π and the range is from -1 to 1, inclusive. y = sin x y = cos x

3
Properties of the Graph of y = sin x

4
Properties of the Graph of y = cos x

6
Find the values of Θ for which cos = 0 is true.

7
Graph y = sin x for 6π ≤ x ≤ 8π.

8
Graph y = cos x for -6π ≤ x ≤ -4π.

9
Assignment 6.3 Practice Worksheet 6.3 pg 363: #13-15, 19-24, 27, 28, 31, 32, 37, 38

Similar presentations


 = f(x) for every x in the domain of f, every integer n, and some positive number p.>")

 00 π /6½ π /21 5 π /6½ π 0 7 π /6-½-½ 3 π /2 11 π /6-½-½ 2π2π 0.>")


 1.What is the domain and range of ? 2.True or False: The graph of is decreasing on the.>")


