Download presentation
Presentation is loading. Please wait.

1
Statistics and Probability IGCSE Cambridge

2
Learning Outcomes Construct and read bar charts, histograms, scatter diagrams and cumulative frequency diagrams, calculate the mean, median and mode. Calculate the probability of a single event, and simple combined events. Leveel Sindy - SUIS

3
10.1 Data display How could we represent data? Leveel Sindy - SUIS

4
10.1 Data Display Bar Chart Pie Chart Frequency polygons Histograms Leveel Sindy - SUIS

5
Bar Chart A graph drawn using rectangular bars to show how large each value is. The bars can be horizontal or vertical. Leveel Sindy - SUIS

6
Pie Chart A pie chart is a circular chart divided into sectors, each sector shows the relative size of each value. Leveel Sindy - SUIS

7
Pie Chart Construction Leveel Sindy - SUIS

8
Worked example Leveel Sindy - SUIS

9
Solutions Leveel Sindy - SUIS

10
Frequency Polygons Definition: A graph made by joining the middle- top points of the bars on a frequency chart. Example: The Last IB scores for the Maths Studies SL at Heaven International School are: 1 1 2 2 2 2 2 3 3 3 3 4 4 5 Leveel Sindy - SUIS

11
Worked Example. The Last IB scores for the Maths Studies SL at Heaven International School are: 1 1 2 2 2 2 2 3 3 3 3 4 4 5 Leveel Sindy - SUIS

12
Histograms A graphical display of data. The data is grouped into ranges ( such as 30 to 39) and then plotted as bars. Similar to a bar graph but each bar represents a range of data. Leveel Sindy - SUIS
 and then plotted as bars. Similar to a bar graph but each bar represents a range of data. Leveel Sindy - SUIS.")
13
Worked Example. The following table shows the age of 25 children on a school bus. Leveel Sindy - SUIS

14
Remember that in a bar chart, the height of the bar represents the frequency. It is therefore correct to label the vertical axis – frequency- However, as in a histogram, it is the area which represents the frequency. It would be therefore be incorrect to label the vertical axis frequency and the label should be -frequency density-.

15
Frequency density So we know that Area = frequency denstity times class width Frequency density = frequency divided by class width. Leveel Sindy - SUIS

16
Worked example Leveel Sindy - SUIS

17
10.2 Mean, median and mode. What is the difference between Mean, Median and Mode? Leveel Sindy - SUIS

18
Mean the mean of a series of numbers is obtained by adding the number together and dividing the result by the number of numbers. Worked example: The last scores of the G10 at the test are: 78%, 65%, 63%, 98%, 23%. What is the mean? Mean = (78+65+63+98+23)/5 = 65.4% Leveel Sindy - SUIS
/5 = 65.4% Leveel Sindy - SUIS.")
19
Median The median is the middle number in a sorted list ( from smallest to biggest value). To find the median, place the numbers you are given in order and find the middle number. If there are 2 middle numbers, you average them. Leveel Sindy - SUIS

20
Worked example Find the median of the following set: A- 15, 14, 16, 18, 13, 15, 17. B- 12, 16, 15, 19, 20, 21 Leveel Sindy - SUIS

21
Solutions A- 15, 14, 16, 18, 13, 15, 17. We list all numbers up from smallest to biggest. 13, 14, 15, 15, 16, 17, 18. the middle number is 15. Leveel Sindy - SUIS

22
Solutions B- 12, 16, 15, 19, 20, 23 We list all numbers up from smallest to biggest 12, 15, 16, 19, 20, 23. The 2 middle numbers are 16 and 19, then the middle number is: (16+19)/2 = 17.5 Leveel Sindy - SUIS
/2 = 17.5 Leveel Sindy - SUIS.")
23
Mode The mode is the number that occurs the most often in a set of numbers. You can have 2 modes, it is called, bimodal. You can have more than one mode, it is called multimodal. Leveel Sindy - SUIS

24
Worked example Find the mode(s): A- 3, 7, 5, 13, 20, 23, 39, 23, 40, 23, 14, 12, 56, 23, 29 B- 19, 8, 29, 35, 19, 28, 15 Leveel Sindy - SUIS
: A- 3, 7, 5, 13, 20, 23, 39, 23, 40, 23, 14, 12, 56, 23, 29 B- 19, 8, 29, 35, 19, 28, 15 Leveel Sindy - SUIS")
25
Solutions A- in this case, the mode is 23, it occurs 4 times B- 19 appears twice, all the rest appear only once, so 19 is the mode. Leveel Sindy - SUIS

26
Frequency Tables A frequency table is constructed by arranging collected data values in ascending order of magnitude with their corresponding frequencies. Leveel Sindy - SUIS

27
Construction of a frequency table Step 1: Construct a table with 3 columns. Then in the 1st column, write down all of the data values in ascending order of magnitude. Step 2: Go through the list of data values and place one tally mark at the appropriate place in the second column for every data value. We continue this process until all data in the list are tallied. Step 3: Count the number of tally marks for each data value and write it in the 3rd column. Leveel Sindy - SUIS

28
Worked example The marks awarded for an assignment set for G10 of 20 students were as follows. 6,7,5,7,7,8,7,6,9,7,4,10,6,8,8, 9,5,6,4,8 Present this information in a frequency table. Leveel Sindy - SUIS

29
Worked example Leveel Sindy - SUIS Draw the frequency table:

30
Solution Leveel Sindy - SUIS

31
Data in groups Leveel Sindy - SUIS

32
Scatter Graphs A graph of plotted points that show the relationship between 2 sets of data. Example: each dot represents one person’s weight versus their height. Leveel Sindy - SUIS

33
Correlation Leveel Sindy - SUIS

34
Line best of fit A line of best fit ( or trend line) is a straight line that best represents the data on a scatter plot. The line may pass through some of the points, none of the points or all the points. Leveel Sindy - SUIS

35
Worked example Is there a relationship between the fat grams and the total calories in fast food? Leveel Sindy - SUIS

36
Solution Leveel Sindy - SUIS

37
10.3 Cumulative frequency Cumulative frequency is the total frequency up to a given point. It is the running total of frequencies. Leveel Sindy - SUIS

38
Worked example Leveel Sindy - SUIS

39
Worked example Leveel Sindy - SUIS

40
Solution Leveel Sindy - SUIS

41
Inter-quartile range (IQR) A cumulative frequency curve shows the median at the 50th percentile of the cumulative frequency. The value at the 25th percentile is known as the lower quartile, and that the 75th percentile as the upper quartile. A measure of the spread or dispersion of the data is given by the inter-quartile range where: Inter-quartile range = upper quartile – lower quartile Leveel Sindy - SUIS

42
Worked example See page 346 from the textbook. Leveel Sindy - SUIS

43
10.4 Simple Probability Probability is the chance that something will happen- how likely it is that some event will happen. Probability to have 5 when you roll a die is 1/6. Probability to have tail when you toss a coin is ½. Leveel Sindy - SUIS

44
Properties If an even CANNOT happen, the probability of it occurs is 0. If an event is CERTAIN to happen, the probability of it occurs is 1. All probabilities lie between 0 and 1. You write probabilities using fractions or decimals. Leveel Sindy - SUIS

45
10.5 Exclusive and independant events 2 events are EXCLUSIVE if they cannot occur at the same time. For exclusive events A and B, p(A or B)=p(A) + p(B). Leveel Sindy - SUIS
=p(A) + p(B). Leveel Sindy - SUIS.")
46
Worked example One ball is selected at random from a bag containing 5 red balls 2 white and 4 yellow. The probability of selecting a red ball or a white ball is P(R or W) = P(R) + P(W) = 5/11 + 2/11 = 7/11. Leveel Sindy - SUIS
 = P(R) + P(W) = 5/11 + 2/11 = 7/11. Leveel Sindy - SUIS.")
47
Independent events 2 events are INDEPENDENT if the occurrence of one event is unaffected by the occurrence of the other. For independent events A and B P( A and B)= P(A) x P(B) Leveel Sindy - SUIS
= P(A) x P(B) Leveel Sindy - SUIS.")
48
Worked example A fair coin is tossed and a fair die is rolled. Find the probability of obtaining a head and a 6. The 2 events are independent, P(H and 6) = P(H) x P(6) = ½ x 1/6 = 1/12. Leveel Sindy - SUIS
 = P(H) x P(6) = ½ x 1/6 = 1/12. Leveel Sindy - SUIS.")
49
10.5 Tree Diagrams A tree diagram shows all the possible outcomes of an event. Example: you toss twice a coin, the possible outcomes are: Leveel Sindy - SUIS

50
Worked example If you toss a coin, twice in a row. And the game is FAIR ( same probability to get Tail or Head), you have the following tree diagram. Leveel Sindy - SUIS
, you have the following tree diagram. Leveel Sindy - SUIS.")
51
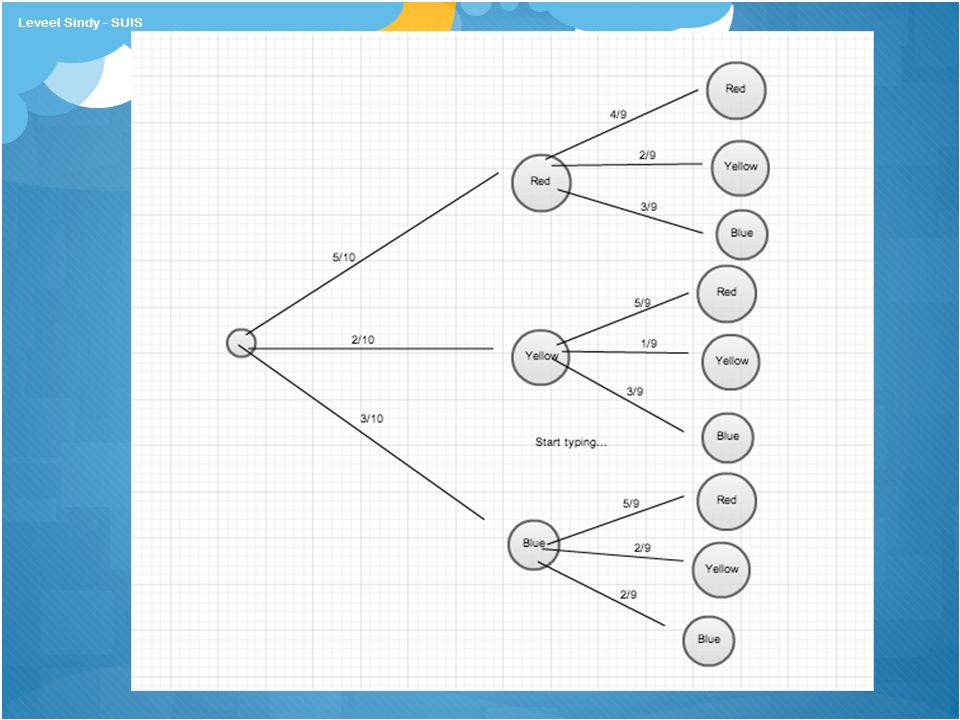
Worked example A bag contain 5 red balls, 3 blue and 2 yellow. A ball is drawn and NOT REPLACED, then a second ball is drawn. Find the probability of drawing 2 red balls One blue and one yellow 2 yellow balls 2 balls of the same colour. Leveel Sindy - SUIS

53
Solution 2 red balls: Red ball on the 1st drawn, red ball on the 2 nd drawn. P(Red,Red) = 5/10 x 4/9 = 2/9 1 blue and 1 yellow = P(B,Y) + P(Y,B)= 3/10 x2/9 + 2/10 x 3/9 = 6/90 + 6/90 = 12/90 = 2/15 2 yellow balls = P(Y,Y) = 2/10 + 1/9 = 2/90 = 1/45 2 balls of the same colour = P(R,R) + P(B,B) +P(Y,Y) = 2/9 + 3/10 x2/9 + 1/45 = 20/90+6/90 + 2/90 = 28/90 = 14/45 Leveel Sindy - SUIS
 = 5/10 x 4/9 = 2/9 1 blue and 1 yellow = P(B,Y) + P(Y,B)= 3/10 x2/9 + 2/10 x 3/9 = 6/90 + 6/90 = 12/90 = 2/15 2 yellow balls = P(Y,Y) = 2/10 + 1/9 = 2/90 = 1/45 2 balls of the same colour = P(R,R) + P(B,B) +P(Y,Y) = 2/9 + 3/10 x2/9 + 1/45 = 20/90+6/90 + 2/90 = 28/90 = 14/45 Leveel Sindy - SUIS.")
Similar presentations


 Chapter 5 Probability Distributions.>")


 Collect, organise and interpret univariate numerical data in order to determine measures of dispersion,>")


