Download presentation
Presentation is loading. Please wait.

1
Our purpose of well studies Compute the decline in the water level, or drawdown, around a pumping well whose hydraulic properties are known. Determine the hydraulic properties of an aquifer by performing an aquifer test in which a well is pumped at a constant rate and either the stabilized drawdown or the change in drawdown over time is measured.

2
Drawdown T = Q/ 4 (h 0 -h)G(u) G(u) = W(u) - completely confined. W(u,r/B) – leaky, confined, no storage. H(u, ) – leaky, confined, with storage. W(u A,u B, ) - unconfined.
 – leaky, confined, no storage. H(u, ) – leaky, confined, with storage. W(u A,u B, ) - unconfined..")
4
Aquifer test Steady-state conditions. Cone of depression stabilizes. Nonequilibrium flow conditions. Cone of depression changes. Needs a pumping well and at least one observational well.

5
Aquifer tests T = Q/ 4 (h 0 -h)G(u) G(u) = W(u) - completely confined. W(u,r/B) – leaky, confined, no storage. H(u, ) – leaky, confined, with storage. W(u A,u B, ) - unconfined.
 – leaky, confined, no storage. H(u, ) – leaky, confined, with storage. W(u A,u B, ) - unconfined..")
9
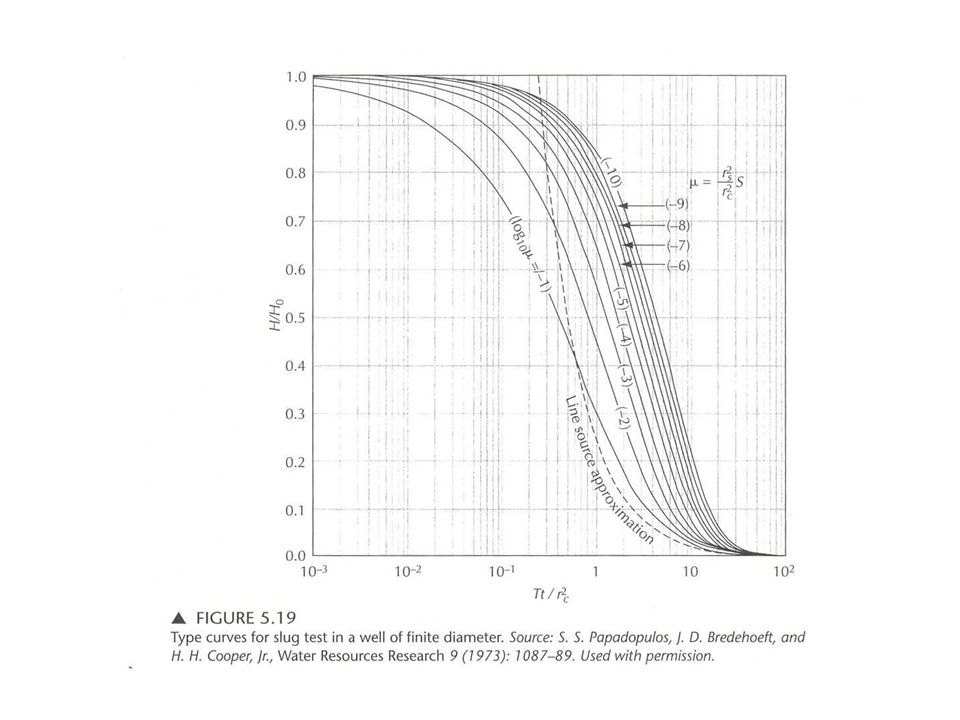
Slug test Overdamped – water level recovers to the initial static level in a smooth manner that is approximately exponential. Underdamped – water level oscillates about the static water level with the magnitude of oscillation decreasing with time until the oscillations cease.

10
Cooper-Bredehoeft-Papadopulos Method (confined aquifer) H/H 0 = F( , ) H – head at time t. H 0 – head at time t = 0. = T t/r c 2 = r s 2 S/r c 2

12
Underdamped Response Slug Test Van der Kamp Method – confined aquifer and well fully penetrating. H(t) = H 0 e - t cos t H(t) - hydraulic head (L) at time t (T) H 0 - the instantaneous change in head (L) - damping constant (T -1 ) - an angular frequency (T -1 )
 = H 0 e - t cos t H(t) - hydraulic head (L) at time t (T) H 0 - the instantaneous change in head (L) - damping constant (T -1 ) - an angular frequency (T -1 ).")
13
= ln[H(t 1 )/H(t 2 )]/ (t 2 – t 1 ) = 2 /(t 2 -t 1 )
![ = ln[H(t 1 )/H(t 2 )]/ (t 2 – t 1 ) = 2 /(t 2 -t 1 )](http://images.slideplayer.com/32/9819449/slides/slide_13.jpg " = ln[H(t 1 )/H(t 2 )]/ (t 2 – t 1 ) = 2 /(t 2 -t 1 )")
14
Underdamped Response Slug Test (cont.) T = c + a ln T c = -a ln[0.79 r s 2 S(g/L) 1/2 ] a = [r c 2 (g/L) 1/2 ] / (8d) d = /(g/L) 1/2 L = g / ( 2 + 2 )
![Underdamped Response Slug Test (cont.) T = c + a ln T c = -a ln[0.79 r s 2 S(g/L) 1/2 ] a = [r c 2 (g/L) 1/2 ] / (8d) d = /(g/L) 1/2 L = g / ( 2 + 2 )](http://images.slideplayer.com/32/9819449/slides/slide_14.jpg "Underdamped Response Slug Test (cont.) T = c + a ln T c = -a ln[0.79 r s 2 S(g/L) 1/2 ] a = [r c 2 (g/L) 1/2 ] / (8d) d = /(g/L) 1/2 L = g / ( 2 + 2 )")
15
x = -y/tan(2 Kbiy/Q) Q - pumping rate K - conductivity b – initial thickness i – initial h gradient x 0 = -Q/tan(2 Kbi) y max = Q/(2Kbi) Confined
 Q - pumping rate K - conductivity b – initial thickness i – initial h gradient x 0 = -Q/tan(2 Kbi) y max = Q/(2Kbi) Confined")
16
Capture Zone Analysis (unconfined aquifer) x = -y / tan[ K[h 1 2 -h 2 2 )y/QL] x 0 = -QL/[ K(h 1 2 -h 2 2 )] y max = QL/[K (h 1 2 -h 2 2 )]
![Capture Zone Analysis (unconfined aquifer) x = -y / tan[ K[h 1 2 -h 2 2 )y/QL] x 0 = -QL/[ K(h 1 2 -h 2 2 )] y max = QL/[K (h 1 2 -h 2 2 )]](http://images.slideplayer.com/32/9819449/slides/slide_16.jpg "Capture Zone Analysis (unconfined aquifer) x = -y / tan[ K[h 1 2 -h 2 2 )y/QL] x 0 = -QL/[ K(h 1 2 -h 2 2 )] y max = QL/[K (h 1 2 -h 2 2 )]")
17
Static fresh and slat water Ghyben-Herzberg principle

19
Total Dissolved Solids (TDS) Total dissolved solids (TDS) is the total amount of solids, in milligrams per liter, that remain when a water sample is evaporated to dryness.
 Total dissolved solids (TDS) is the total amount of solids, in milligrams per liter, that remain when a water sample is evaporated to dryness.")
21
Solid Constituents Major constituents: Calcium, magnesium, sodium, and potassium (cations); Chloride, sulfate, carbonate, and bicarbonate (anions). Minor constituents: iron, manganese, fluoride, nitrate, strontium, and Boron. Trace elements: arsenic, lead, cadmium, and Chromium.

22
Dissolved Gases Oxygen. Carbon dioxide. Nitrogen. Hydrogen sulfide Methane.

23
Mass transport of solutes Diffusion – both ionic and molecular species dissolved in water move from area of higher concentration (chemical activity) to areas of lower concentration. Advection – moving water carries it dissolved solutes.

24
Diffusion – Fick’s laws Fick’s first law F = -D dC/dx F = mass flux of solute per unit area per unit time. D = diffusion coefficient (area/time) C = solute concentration (mass/volume) dC/dx = concentration gradient (mass/volume/distance). D ranges from 1 x 10 -9 to 2 x 10 -9 m 2 /s, for the major cations and anions.
 C = solute concentration (mass/volume) dC/dx = concentration gradient (mass/volume/distance). D ranges from 1 x to 2 x m 2 /s, for the major cations and anions..")
25
Diffusion – Fick’s laws (cont.) Fick’s second law C/ t = D 2 C/ x 2 D = diffusion coefficient (area/time) C = solute concentration (mass/volume) t = time
 Fick’s second law C/ t = D 2 C/ x 2 D = diffusion coefficient (area/time) C = solute concentration (mass/volume) t = time")
26
Effective diffusion coefficient D* = wD. D* = effective diffusion coefficient. w = empirical coefficient.

27
Advection Advecting contaminants travel at the same rate as the average linear velocity of ground water v x = -(K/n e ) dh/dl v x = average linear velocity K = hydraulic conductivity n e = effective porosity dh/dl = hydraulic gradient
 dh/dl v x = average linear velocity K = hydraulic conductivity n e = effective porosity dh/dl = hydraulic gradient")
28
Mechanical Dispersion Dispersion is a process that a contaminated fluid dilutes as it mixs with noncontaminated water when passing through a porous medium.

29
Mechanical Dispersion Longitudinal dispersion: the mixing occurs along the pathway of fluid flow

30
Mechanical Dispersion Longitudinal dispersion: if the mixing occurs along the pathway of fluid flow - it moves faster through the center of the pore; - some of the fluid will travel in longer pathways; - fluid travels faster through larger pore. Transverse or lateral dispersion: if the mixing occurs normal to the pathway of fluid flow. - flow paths can split and branch out to the side.

32
Mechanical Dispersion Mechanical dispersion = a L v x a L = dynamic dispersivity v x = average linear velocity

33
Hydrodynamic Dispersion Hydrodynamic dispersion: D L = D* + a L v x D L = longitudinal coefficient of hydrodynamic dispersion D* = effective molecular diffusion coefficient a L = dynamic dispersivity v x = average linear ground-water velocity

35
Advection-dispersion Equation D L 2 C/ x 2 – v x C/ x = C/ t D L 2 C/ x 2 – dispersion (diffusion + dispersivity). v x C/ x – Advection

36
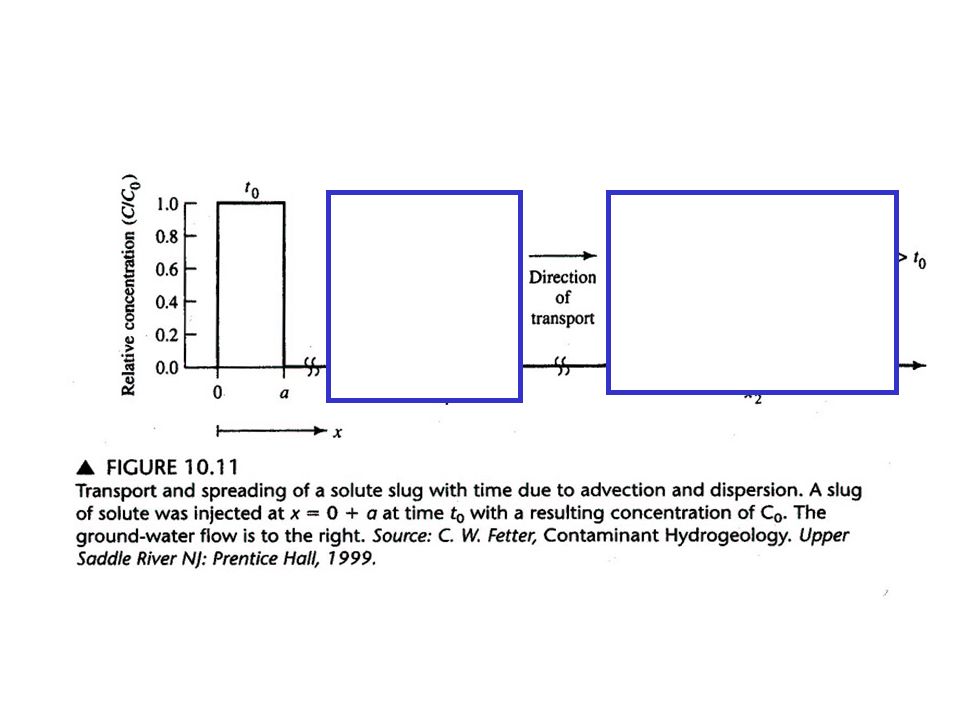
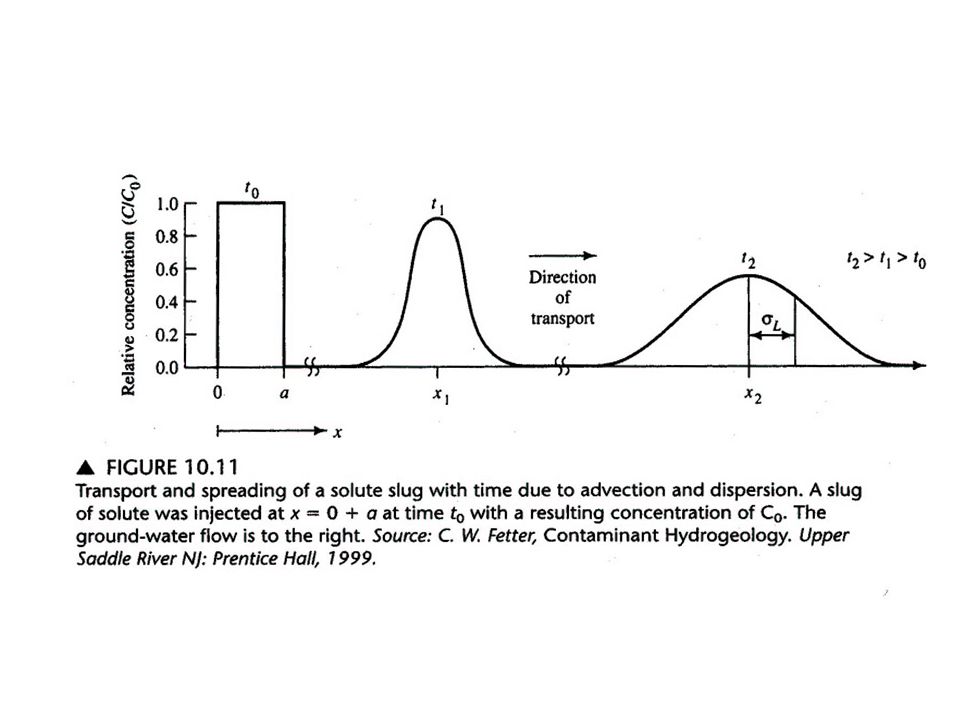
Solute Transport by Advection- Dispersion C = C 0 /2{erfc[(L-v x t)/2(D L t) 1/2 ] + exp(v x L/D L )erfc[(L-v x t)/2(D L t) 1/2 ] } C = solute concentration (M/L 3, mg/L) C 0 = initial concentration (M/L 3, mg/L) L = flow path length (L; ft/m) v x = average ground velocity (L/T) t = time since release of the solute (T) D L = longitudinal dispersion coefficient (L 2 /T)
![Solute Transport by Advection- Dispersion C = C 0 /2{erfc[(L-v x t)/2(D L t) 1/2 ] + exp(v x L/D L )erfc[(L-v x t)/2(D L t) 1/2 ] } C = solute concentration (M/L 3, mg/L) C 0 = initial concentration (M/L 3, mg/L) L = flow path length (L; ft/m) v x = average ground velocity (L/T) t = time since release of the solute (T) D L = longitudinal dispersion coefficient (L 2 /T)](http://images.slideplayer.com/32/9819449/slides/slide_36.jpg "Solute Transport by Advection- Dispersion C = C 0 /2{erfc[(L-v x t)/2(D L t) 1/2 ] + exp(v x L/D L )erfc[(L-v x t)/2(D L t) 1/2 ] } C = solute concentration (M/L 3, mg/L) C 0 = initial concentration (M/L 3, mg/L) L = flow path length (L; ft/m) v x = average ground velocity (L/T) t = time since release of the solute (T) D L = longitudinal dispersion coefficient (L 2 /T)")
40
Apparent longitudinal dynamic dispersivity a L = 0.83(log L) 2.414 a L = apparent longitudinal dynamic dispersivity (L; ft/m) L = length of the flow path (L; ft or m).
 a L = apparent longitudinal dynamic dispersivity (L; ft/m) L = length of the flow path (L; ft or m).")
41
Ground water flow Continuous source

42
Ground water flow Continuous source

43
Retardation Adsorption is a process for a negative (positive) charge to adsorbing a charged cation (ion).
 charge to adsorbing a charged cation (ion).")
44
Retardation – adsorption isotherm A graphic plot of C as a function of C* C = mass of solute adsorbed per bulk unit dry mass of soil C* = equilibrium solute concentration

45
Retardation - Freundlich equation log C* = j log C + log K f or C* = K f C j C = mass of solute adsorbed per bulk unit dry mass of soil C* = equilibrium solute concentration K f, j = coefficients If C vs C* is a straight line: K d = dC*/dC (distribution coefficient)
")
46
C* mass adsorbed per unit weight of soil C equilibrium concentration of solute remaining in solution Adsorption isotherm

47
Langmuir Adsorption Isotherm If C/C* vs. C is a straight line: C/C* = 1/( 1 2 ) + C/ 2 C = equilibrium concentration of the ion in contact with the soil (mg/L) C* = amount of the ion adsorbed perl unit weight of soil (mg/g) 1 = an adsorption constant related to the binding energy 2 = an adsorption maximum for the soil.
 + C/ 2 C = equilibrium concentration of the ion in contact with the soil (mg/L) C* = amount of the ion adsorbed perl unit weight of soil (mg/g) 1 = an adsorption constant related to the binding energy 2 = an adsorption maximum for the soil..")
49
Retardation Factor Retardation factor = 1 + ( b / )(K d ) b = dry bulk mass density of the soil (M/L 3 ; gm/cm 3 ) = volumetric moisture content of the soil (dimensionless). K d = distribution coefficient for solute with the soil (L 3 /M; mL/g)
.")
50
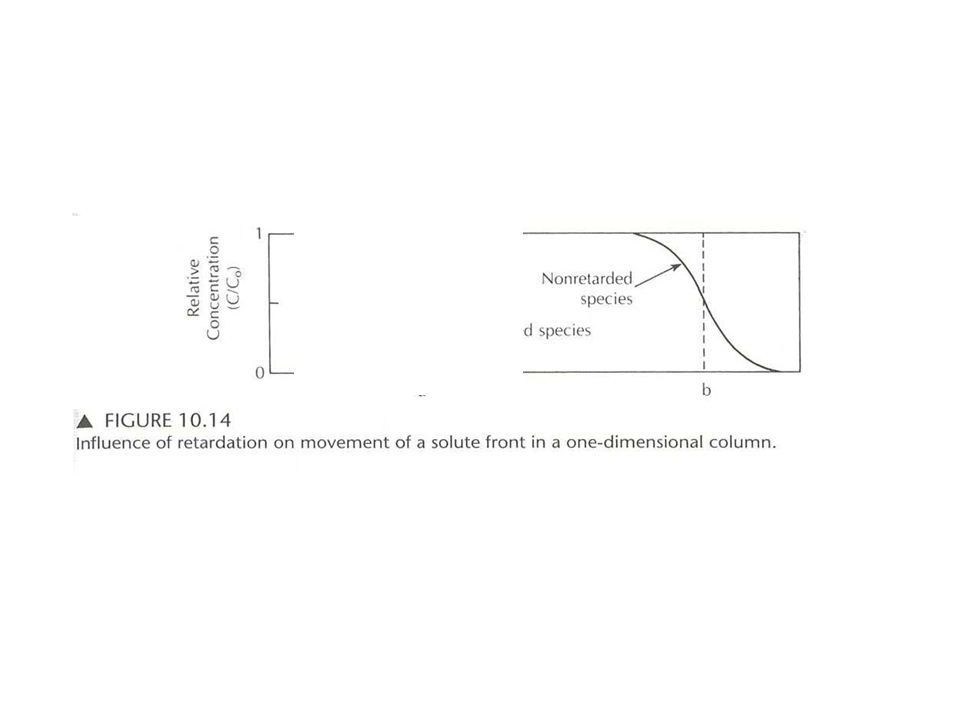
Solute Movement with Retardation v c = v x /[1+ ( b / )(K d )] v c = velocity of the solute front. In one- dimensional column the solute concentration is one-half of the original value (L/T; ft/day or m/day). v x = average linear velocity (L/T; ft/day or m/day).
![Solute Movement with Retardation v c = v x /[1+ ( b / )(K d )] v c = velocity of the solute front.](http://images.slideplayer.com/32/9819449/slides/slide_50.jpg "In one- dimensional column the solute concentration is one-half of the original value (L/T; ft/day or m/day). v x = average linear velocity (L/T; ft/day or m/day)..")
55
Mass transport of solutes Diffusion – both ionic and molecular species dissolved in water move from area of higher concentration (chemical activity) to areas of lower concentration. Advection – moving water carries it dissolved solutes.

56
Retardation Factor Retardation factor = 1 + ( b / )(K d ) b = dry bulk mass density of the soil (M/L 3 ; gm/cm 3 ) = volumetric moisture content of the soil (dimensionless). K d = distribution coefficient for solute with the soil (L 3 /M; mL/g)
.")
Similar presentations


 modelling 6(i)>")


