Download presentation
Presentation is loading. Please wait.

1
NEPA, Noise and the Super Hornet Fred Pierson Navy East Coast AICUZ/RAICUZ Center of Excellence Center of Excellence NAVFAC Atlantic Division 7 April 2004

10
Latest version of the Hornet aircraft with state of the art mission capabilityLatest version of the Hornet aircraft with state of the art mission capability West Coast Super Hornets are stationed in California at NAS LemooreWest Coast Super Hornets are stationed in California at NAS Lemoore The Super Hornet

11
Timeline Draft EIS (DEIS) made available for public reviewDraft EIS (DEIS) made available for public review DEIS Comment Period and Public HearingsDEIS Comment Period and Public Hearings Final EIS (FEIS) releasedFinal EIS (FEIS) released Record of DecisionRecord of Decision Lawsuits filedLawsuits filed2002 July2003 Sept2003 Jan2004
 made available for public reviewDraft EIS (DEIS) made available for public review DEIS Comment Period and Public HearingsDEIS Comment Period and Public Hearings Final EIS (FEIS) releasedFinal EIS (FEIS) released Record of DecisionRecord of Decision Lawsuits filedLawsuits filed2002 July2003 Sept2003 Jan2004")
12
Proposed Action Provide facilities and functions to support the homebasing and operation of 10 Super Hornet fleet squadrons (120 aircraft) and the Fleet Replacement Squadron (24 aircraft)Provide facilities and functions to support the homebasing and operation of 10 Super Hornet fleet squadrons (120 aircraft) and the Fleet Replacement Squadron (24 aircraft)
 and the Fleet Replacement Squadron (24 aircraft)Provide facilities and functions to support the homebasing and operation of 10 Super Hornet fleet squadrons (120 aircraft) and the Fleet Replacement Squadron (24 aircraft)")
13
The Decision – Alternative 6 Majority of fleet aircraft based at NAS OceanaMajority of fleet aircraft based at NAS Oceana –Optimizes readiness –Utilize excess capacity Provides some noise and air quality mitigationProvides some noise and air quality mitigation Build an OLF in Washington County, NCBuild an OLF in Washington County, NC NAS Oceana MCAS Cherry Point Washington County

14
Trains pilots for landing on aircraft carriersTrains pilots for landing on aircraft carriers FCLP operations are conducted on a runway that simulates the aircraft carrier deckFCLP operations are conducted on a runway that simulates the aircraft carrier deck Field Carrier Landing Practice - FCLP

15
Proposed OLF in Washington County 8,000’ Runway 3000 acre core area Total of about 30,000 acres within 60db DNL noise contours Rural County of 13,700 people 30,000 Field Carrier Landing Practice patterns (FCLPs) Per Year
 Per Year")
16
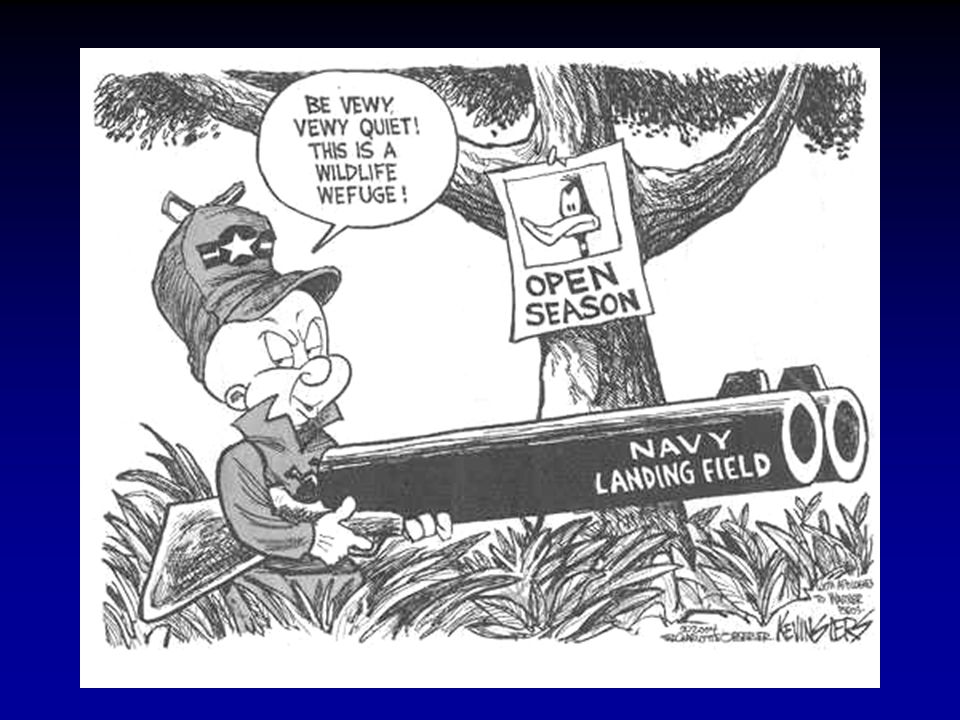
Easily accessible from NAS Oceana and MCAS Cherry PointEasily accessible from NAS Oceana and MCAS Cherry Point Operationally idealOperationally ideal Low population densityLow population density Compatible land useCompatible land use Lack of encroachment pressureLack of encroachment pressure Operational temp will be cyclicOperational temp will be cyclic Wildlife refuge 5 miles awayWildlife refuge 5 miles away Washington County NC OLF Site

17
How to Present Noise Impacts? Day-night average (DNL) noise contoursDay-night average (DNL) noise contours Different resources impactedDifferent resources impacted –Sometimes DNL is just not enough Augmented DNL with:Augmented DNL with: –Noise equivalent sound level (Leq) for school days –Specific DNL for locations of interest –Sound Exposure Level (SEL) data –Onset-Rate Adjusted DNL (or Ldnmr) Detailed Noise Discussion and AppendixDetailed Noise Discussion and Appendix –Noise Science –Impacts of Noise –Additional backup data
 noise contoursDay-night average (DNL) noise contours Different resources impactedDifferent resources impacted –Sometimes DNL is just not enough Augmented DNL with:Augmented DNL with: –Noise equivalent sound level (Leq) for school days –Specific DNL for locations of interest –Sound Exposure Level (SEL) data –Onset-Rate Adjusted DNL (or Ldnmr) Detailed Noise Discussion and AppendixDetailed Noise Discussion and Appendix –Noise Science –Impacts of Noise –Additional backup data.")
18
Noise Impacts NAS Oceana - Increases population within the 65+ DNL contour by:NAS Oceana - Increases population within the 65+ DNL contour by: –10,031 (11% increase from 2000 baseline) MCAS Cherry Point - Increases population within the 65+ DNL contour by:MCAS Cherry Point - Increases population within the 65+ DNL contour by: –202 (2% increase from 2000 baseline)
 MCAS Cherry Point - Increases population within the 65+ DNL contour by:MCAS Cherry Point - Increases population within the 65+ DNL contour by: –202 (2% increase from 2000 baseline)")
19
Oceana/Fentress Alt 6 Noise Contours (w/ OLF)
")
20
Table 4-9 Off-Station Area (Acres) and Estimated Population within Projected Noise Zones at NAS Oceana and NALF Fentress under Dual-Siting Alternatives 4A and 4B ExistingALT 4A without OLF ALT 4A with OLF ALT 4B without OLF ALT 4B with OLF Area Pop. AreaPop.AreaPop.AreaPop.AreaPop. 65 to 70 dB13,07637,42814,95037,21614,18534,39115,41138,88714,729 35,571 70 to 75 dB9,15126,7529,98029,0359,69828,89910,19229,3969,809 29,435 75 dB or greater 12,46223,34915,91632,86310,21231,55216,33133,98711,158 32,917 Total 34,68987,52940,84699,11434,09594,84241,934 102,270 35,696 97,923 Net Change 6,15711,585(594)7,3137,24514,7411,007 10,394 Percent Net Change 18%13%(2%)8%21%17%3%12% Source: Wyle Laboratories, Inc., 2003.
7,3137,24514,7411,007 10,394 Percent Net Change 18%13%(2%)8%21%17%3%12% Source: Wyle Laboratories, Inc.,")
21
Noise Zones – Site C (Washington County, NC) –Flight Operations 32,000 ops/year32,000 ops/year –Noise Zones 24,000 acres24,000 acres –Population 141 people141 people
 –Flight Operations 32,000 ops/year32,000 ops/year –Noise Zones 24,000 acres24,000 acres –Population 141 people141 people")
22
Population Within the 60 DNL Contour at the OLF Sites

23
Site Analysis - Noise Impacts Increase or decrease in percentage of population within 65 DNL contour

24
Site Specific DNL Locations of interestLocations of interest –Worked with local community to help identify –All public schools were included if in noise contours Presented DNL value for each locationPresented DNL value for each location Most people lived near a site chosenMost people lived near a site chosen –Able to get a good feel for how loud at their house CriticismCriticism –It’s an average

25
Table 4-18 Average Noise Levels Projected at Representative Other Locations of Interest Near NAS Oceana and NALF Fentress under Dual-Siting Alternatives 5A and 6 a Identification Number b /Name ExistingALT 5AALT 6 without OLF ALT 6 with OLF DNL (dB) L eq (dB) DNL (dB ) L eq (dB) DNL (dB) L eq (dB) DNL (dB) L eq (dB) Virginia Beach VB1Virginia Beach Sentara Hospital 65 63 66 VB2Virginia Beach Pavilion 76 757479787978 VB3Verizon/Virginia Beach Amphitheater 5957 5661596058 VB4Lynnhaven Mall Shopping Center 7977797682808280 VB5Cavalier Hotel 63 616264 6564
 L eq (dB) DNL (dB ) L eq (dB) DNL (dB) L eq (dB) DNL (dB) L eq (dB) Virginia Beach VB1Virginia Beach Sentara Hospital VB2Virginia Beach Pavilion VB3Verizon/Virginia Beach Amphitheater VB4Lynnhaven Mall Shopping Center VB5Cavalier Hotel")
26
Sound Exposure Level (SEL) Sound exposure represents both intensity and duration of a soundSound exposure represents both intensity and duration of a sound –Net impact of an entire acoustic event Better represents what people will actually hearBetter represents what people will actually hear EIS provided SEL data for generic events and for top five events at each location of interestEIS provided SEL data for generic events and for top five events at each location of interest CriticismsCriticisms –Very few
 Sound exposure represents both intensity and duration of a soundSound exposure represents both intensity and duration of a sound –Net impact of an entire acoustic event Better represents what people will actually hearBetter represents what people will actually hear EIS provided SEL data for generic events and for top five events at each location of interestEIS provided SEL data for generic events and for top five events at each location of interest CriticismsCriticisms –Very few")
27
Comparison of Representative SEL Values (dB) for Aircraft on Approach, Departure, and in the FCLP or Touch-and-Go Pattern Operation Alt. (AGL) F-14 A F-14 B/D F/A-18 C/D F/A-18 E/F AV- 8B EA- 6B Approach 1,0009387109114103107 Departure 1,000 800 600 110 93 96 99 108 95 97 99 117 108 109 111 117 113 115 117 113 - 103 107 114 - 103 106 FCLP
 F-14 A F-14 B/D F/A-18 C/D F/A-18 E/F AV- 8B EA- 6B Approach 1, Departure 1, FCLP.")
28
Summary – Lessons Learned DNL is a good metric and should be usedDNL is a good metric and should be used Should consider augmenting DNL with other metrics such as Leq and SELShould consider augmenting DNL with other metrics such as Leq and SEL –Reader friendly –Go the extra mile Use good maps!Use good maps! Keep it simpleKeep it simple

29
The Way Ahead First squadron Stands upFirst squadron Stands up Construction of OLF beginsConstruction of OLF begins OLF completeOLF complete Homebasing completeHomebasing complete2004 200520072010

30
Fred Pierson Navy East Coast AICUZ/RAICUZ Center of Excellence (757) 322-6450 fred.pierson@navy.mil Fred Pierson Navy East Coast AICUZ/RAICUZ Center of Excellence (757) 322-6450 fred.pierson@navy.mil
 Fred Pierson Navy East Coast AICUZ/RAICUZ Center of Excellence (757)")
Similar presentations


 was that there was no information included about your.>")


 Co-authors: Dan Cecchini, DoN, Atlantic.>")
 Meeting July 23, 2003.>")


.ppt 1030 Federal Aviation Administration Presentation of System Airport.>")


