Download presentation
Presentation is loading. Please wait.

1
3.3 Break-even analysis Check your portfolios at Howthemarketworks.com

2
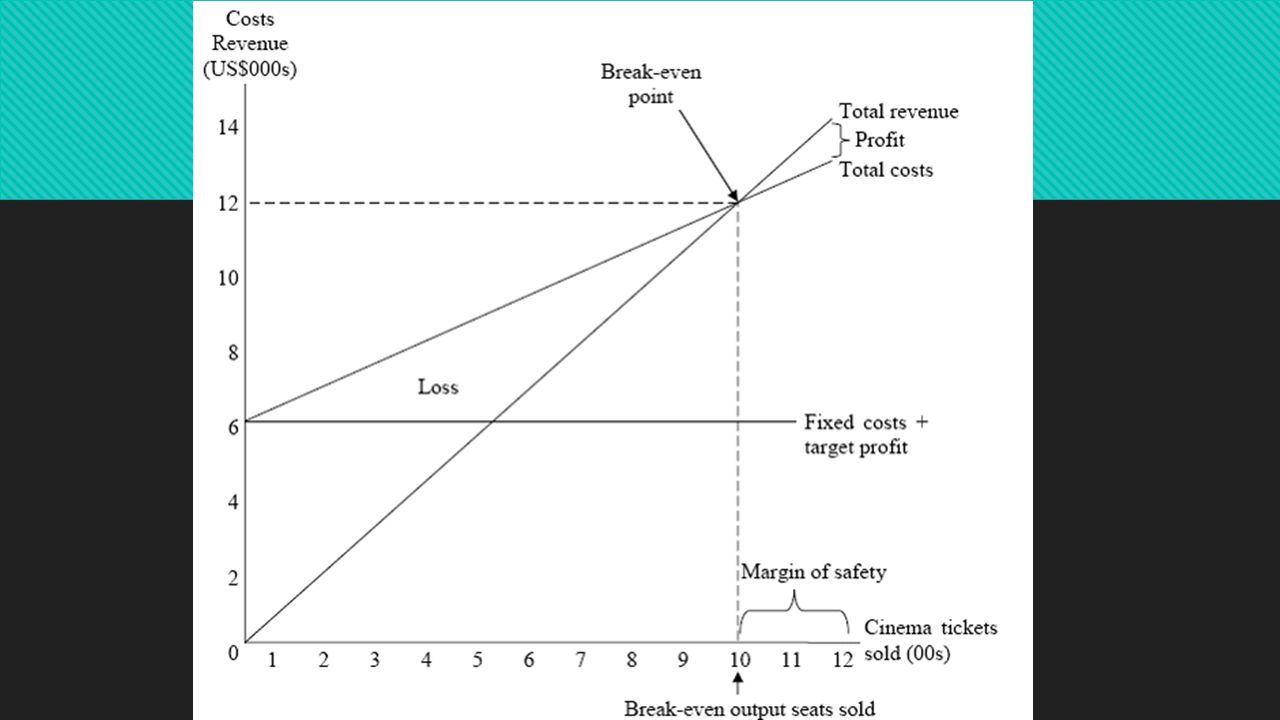
Warm Up: Break Even Analysis How would you identify profit/loss on this graph? At what point is the company just covering it’s fixed costs? At what point is the company covering all of it’s costs (i.e. profit is zero)?
 .")
3
Definitions Break-even chart – a graphical method that measures the value of a firm’s costs and revenues against a given level of output Break-even quantity – a measure of output where total revenue equals total costs Margin of safety – the output amount that exceeds the break-even quantity Break-even chart – a graphical method that measures the value of a firm’s costs and revenues against a given level of output Break-even quantity – a measure of output where total revenue equals total costs Margin of safety – the output amount that exceeds the break-even quantity

4
Calculations/Formulas Contribution per unit = price per unit – variable cost per unit Total contribution = total revenue – total variable cost Total contribution = contribution per unit x number of units sold Break even output or quantity = fixed costs/contribution per unit Margin of safety = current output – break even output Contribution per unit = price per unit – variable cost per unit Total contribution = total revenue – total variable cost Total contribution = contribution per unit x number of units sold Break even output or quantity = fixed costs/contribution per unit Margin of safety = current output – break even output

6
Question: Tommy the Baker

7
Calculating Profit and Target Profit Profit = Total Revenue – Total Cost Profit = (P x Q) – (TFC + TVC) Target Profit Output = Fixed Costs + Target Profit Contribution Per Unit Profit = Total Revenue – Total Cost Profit = (P x Q) – (TFC + TVC) Target Profit Output = Fixed Costs + Target Profit Contribution Per Unit
 – (TFC + TVC) Target Profit Output = Fixed Costs + Target Profit Contribution Per Unit Profit = Total Revenue – Total Cost Profit = (P x Q) – (TFC + TVC) Target Profit Output = Fixed Costs + Target Profit Contribution Per Unit")
8
Benefits of Break-Even Analysis Easy and visual analysis Ability to determine profit, break even level, margin of safety all in one chart Changes in price and costs can be compared Used as a strategic tool to decide on key investment projects or decisions to relocate or merge with another company Easy and visual analysis Ability to determine profit, break even level, margin of safety all in one chart Changes in price and costs can be compared Used as a strategic tool to decide on key investment projects or decisions to relocate or merge with another company

9
Drawbacks of Break-Even Analysis Assumes all of the output being produced is sold Assumes all revenues and costs are linear Semi variable costs are not represented Is not useful in changing or dynamic business environments Unreliable or inaccurate data may influence conclusions reached Fixed costs may change at different levels of activity Assumes all of the output being produced is sold Assumes all revenues and costs are linear Semi variable costs are not represented Is not useful in changing or dynamic business environments Unreliable or inaccurate data may influence conclusions reached Fixed costs may change at different levels of activity

10
Formative: Paolo’s Pasta

Similar presentations


 Analysis Contribution margin (CM) is the difference between sales revenue and variable expenses. Next Page Click.>")


 Business & Management for the IB Diploma Program. Stimpson & Smith, 2012, p338-340.>")


