Download presentation
Presentation is loading. Please wait.

1
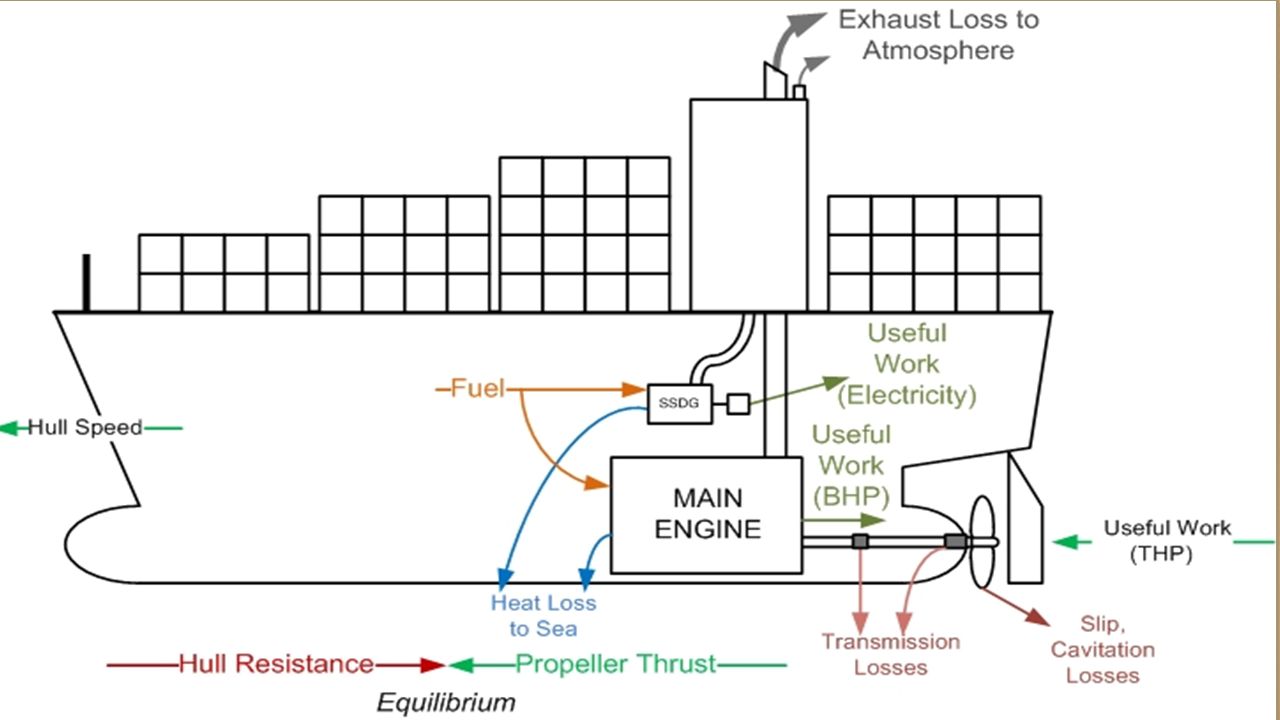
Vessel Energy Use Overview Alaska Fisheries Development Foundation University of Alaska Sea Grant Marine Advisory Alaska Longline Fishermen’s Association Alaris Companies

3
Engine Fuel Efficiency Brake Specific Fuel Consumption (BSFC) The engine efficiency measure of converting fuel into useful work Lb of Fuel / HP-hr produced Kg of Fuel/ kW-hr produced HP-hr/gal fuel Factors Effecting BSFC Load on Engine (rpm under load) Air Temperature Condition of Engine
 The engine efficiency measure of converting fuel into useful work Lb of Fuel / HP-hr produced Kg of Fuel/ kW-hr produced HP-hr/gal fuel Factors Effecting BSFC Load on Engine (rpm under load) Air Temperature Condition of Engine")
4
A fundamental principal of diesel engine efficiency is that it varies with load. An engine is relatively inefficient at low loads (torque and speed). Efficiency improves as it approaches 30% rated load and is optimal at around 70-80% load, and then drops off again as it approaches full throttle. In this project we did not test any engines at the higher load, because we were using actual operation conditions and the skippers don’t normally operate in that range. Most of the boats were operating in the 10-50% range so that is what data we have.
. Efficiency improves as it approaches 30% rated load and is optimal at around 70-80% load, and then drops off again as it approaches full throttle. In this project we did not test any engines at the higher load, because we were using actual operation conditions and the skippers don’t normally operate in that range. Most of the boats were operating in the 10-50% range so that is what data we have..")
5
Engine and Vessel Performance Curves Note that engine efficiency and propulsion efficiency are not the same.

6
Propulsion efficiency can be expressed as amount of fuel used per output of power (e.g. g/kW/hr or gal/hp/hr. That tells how much fuel the engine is consuming per hp produced but tells us nothing about how much it costs to push the boat. Another measure is gal/nm traveled, or dollars/cents per nm, either of which then has to take into account vessel speed.

7
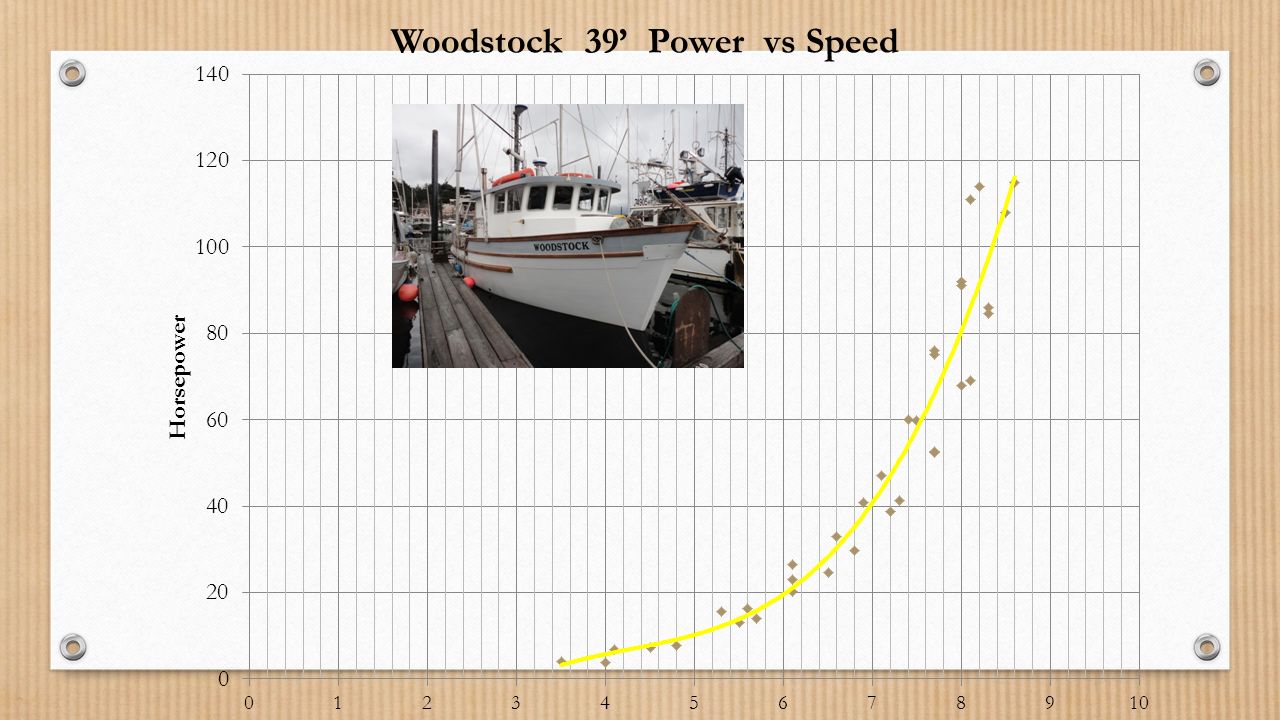
Woodstock

8
Many factors influence vessel (propulsion) efficiency besides engine efficiency. Most important in displacement-hull vessels is wave-making. The faster a hull passes through the water the bigger the bow and stern waves and the farther apart they are. This wave making requires large amounts of energy, and the increase becomes steeper the faster the hull goes. A one-knot increase at very low speed increases propulsion energy demand a small amount, a one-knot increase at around theoretical “hull speed” increases demand by a great deal. None of the curves in this show illustrate speeds at the high end of hull speed because the skippers didn’t operate at those speeds in the test, and generally Southeast Alaska boats don’t. In fisheries such as Bristol Bay boats routinely exceed hull speed and fuel per nm costs are very high. Other factors influencing propulsion efficiency include hull shape, underwater protrusions, and hull skin friction.

9
Savage: Optimal Speed Minimal Propulsion Fuel Consumption

12
The following slide illustrates the difference between engine efficiency and propulsion efficiency.

13
F/V Myriad Speed Efficiency vs. Engine Efficiency

14
A common form of drag that reduces propulsion efficiency is stabilizers. When you read the following graph do not compare the space between the two curves; Go horizontally from blue to red to read the speed penalty at the same fuel consumption, or go vertically from red to blue to see the fuel penalty at the same speed. What you will see is that at 6 kt fuel consumption jumps from.25 gal/nm to.4 gal/nm., a 60% increase.

16
One way to view efficiency is in terms of total operating costs, which includes maintenance and replacement.. Since many maintenance actions (e.g. oil changes) are done on the basis of engine hours, logic suggests that traveling very slowly could actually increase maintenance costs because more cycles would be required in a given season or lifetime of the engine. On the other hand, some maintenance is done on an annual basis or other measure. These maintenance costs would not be influenced by travel speed. Furthermore, real world experience with engines indicates that running very slowly (under-loading the engine) can actually be detrimental, causing increased maintenance costs and more frequent replacement. The following two slides show some maintenance costs, and how including maintenance in the fuel/speed calculation can shift the curve. Total costs are greater when maintenance is included but the gap gets smaller as speed increases.
 are done on the basis of engine hours, logic suggests that traveling very slowly could actually increase maintenance costs because more cycles would be required in a given season or lifetime of the engine. On the other hand, some maintenance is done on an annual basis or other measure. These maintenance costs would not be influenced by travel speed. Furthermore, real world experience with engines indicates that running very slowly (under-loading the engine) can actually be detrimental, causing increased maintenance costs and more frequent replacement. The following two slides show some maintenance costs, and how including maintenance in the fuel/speed calculation can shift the curve. Total costs are greater when maintenance is included but the gap gets smaller as speed increases..")
17
Energy Analysis Tool Main Engine Maintenance Input Page #1 Main Engine Maintenance Interval (hrs.) Cost ($) Hourly Cost $/hr. Oil Change300$200.00$0.67 Minor Overhaul5,000$1,500.00$0.30 Major Overhaul30,000$25,000.00$0.83 Annual Misc. Repair1,200$500.00$0.42 Other0$0#DIV/0! Other0$0#DIV/0! Total $2.22 F/V Myriad

18
F/V Myriad : Most Economical Speed Main Engine Fuel Cost vs. Total Cost

19
Questions?

Similar presentations


 cost of production of electrical energy is known as economics.>")


