Download presentation
Presentation is loading. Please wait.

1
Overview of Lecture Series Dermot O’Dwyer

2
Material to be Covered Identify factors that Influence bridge response Identifying the types of problems that structural engineers have to address Identify suitable analysis methods for the different types of analysis Review structural dynamics

3
Resources Lectures on disk –Railway bridge dynamics –Dynamics primer Prototype analysis programs –Moving vehicle programs

4
What Will You Be Able to Do? Perhaps nothing new initialy, but hopefully these sessions will clarify the origin of some of the code requirements Will be able to give feedback on what you would like an analysis package to deliver

5
Lecture 1 Overview of Railway Bridge Dynamics

6
Factors that affect the dynamic response of a railway bridge 1.Bridge stiffness 2.Bridge mass 3.Train mass 4.Train speed 5.Rail and wheel irregularities and the presence of track irregularities 6.Train suspension characteristics

7
Multiple problems Longitudinal Response Response of Transverse members Liquefaction of ballast due to high vertical accelerations Critical speeds Fatigue Resonance

8
What is Required of a Dynamic Analysis? Dynamic Impact factors Peak Deflections Maximum Moments Peak Stresses Bending Moment Envelopes Fatigue analysis

9
Knowing your loading

10
What Vehicle Data is Available? Vehicle characteristics available –Suspension characteristics, new and old –Tare and fully laden weights –Sprung and unsprung masses –Wheel flats –History of train movements

11
What Track Data is Available? Track geometry –Vertical Alignment –Magnitude of dipped joints –Variation in track stiffness –Cant irregularities –Corrugation

12
What Bridge Data is Available? Bridge Data –Material characteristics Yield Strength Fatigue Strength Residual stress –Condition of bearings –Settlement of supports –Loading History –Repair History

13
Lecture 2 Qualitative Response of Longitudinal Members

14
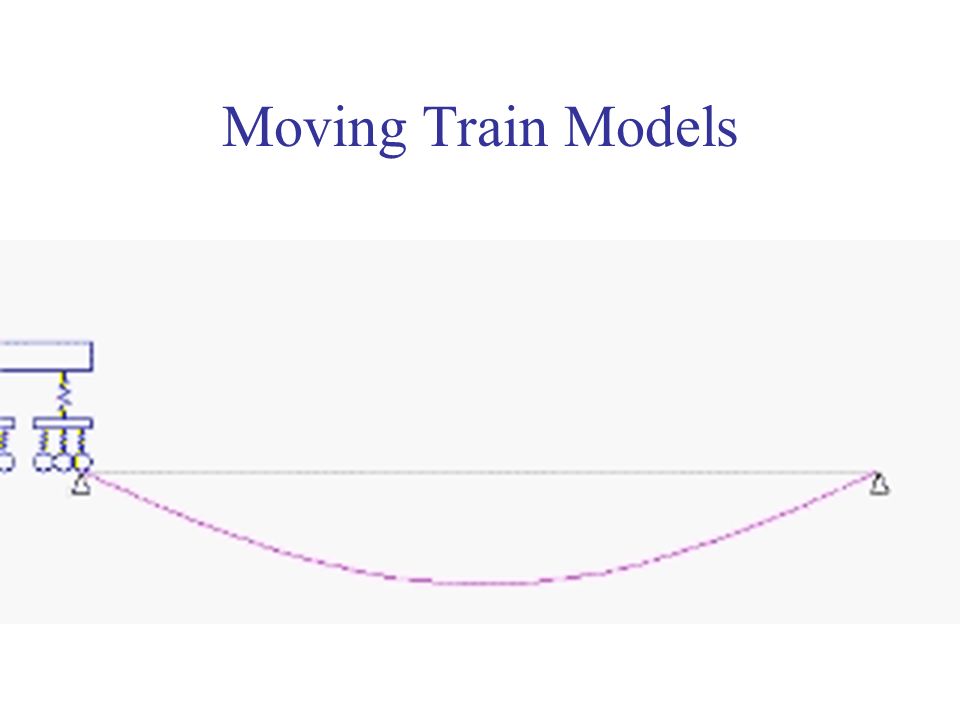
Key to Dynamic Diagrams Blue is the dynamic deflected shape Red is the static deflected shape Magenta is the maximum static deflection at a location at any time

15
Qualitative Response of Longitudinal members

16
The rolling load moves at a slow rate across the bridge

17
If the load is moving slowly then the response of the bridge at any time is equal to the static deflection. If you need to ensure that there are no dynamic effects then by reducing the speed of the train the dynamic effects can be removed How slow is slow? Depends Static response can be used to check a dynamic program

18
Rolling load moves instantaneously to mid-span

19
This case shows that dynamic effects can be significant Classic dynamic case of suddenly applied to a spring Deflection is twice the static deflection for this case

20
Rolling load moves rapidly from mid-span to end

21
Rolling load must climb out of the dip – this requires a vertical movement The faster the load moves the greater the vertical acceleration required The lower the bridge stiffness the greater the dip and hence the greater the vertical acceleration required The contact force will be dependent on the vertical acceleration and the mass of the load The faster the load moves the less time the contact force acts on the bridge

22
Rolling load traverses the bridge rapidly

23
Complex response Non-linear Response depends on –Mass of moving load –Mass of bridge –Velocity of moving load –Stiffness of bridge

24
Assumptions Contact between the wheel and the rail is perfectly smooth Vertical velocity and acceleration are zero when the wheel begins to cross the bridge

25
Lecture 3 Quantitative Response of Longitudinal Members

26
Mathematical Models Mathematical models involve some simplification. Generally, analysts attempt to identify the simplest models capable of predicting the system response with sufficient accuracy It is vitally important that the analyst understands the implications of the various simplifications

27
Hirearcy of Models Moving forces model Moving mass model Moving train model –Include non-linear contact spring –Include track –Include track and wheel irregularities –Include initial vertical velocities and accelerations

28
Moving Force Model The moving force model replaces the moving masses (i.e. the train) as a series of constant vertical forces that move across the bridge Advantages –Significant simplification – linearises problem –Reduced requirement for vehicle data
 as a series of constant vertical forces that move across the bridge Advantages –Significant simplification – linearises problem –Reduced requirement for vehicle data.")
29
Ladislav Fryba’s Solution Response of a simply supported beam subjected to a moving force

30
What is so great about Fryba’s solution? Why linear is important –Superposition Analyse respons to a single moving load Separate analysis required for each speed but not each train Ideal for a fatigue analysis Useful check on other techniques

31
Fryba - Free Response The closed form solution is only valid for the period while the load is on the bridge The solution is to model the free response of the bridge after the load has left Use the velocity and displacement of the bridge at the instant the load leaves the bridge Requires a modal approach

32
Limitations of Fryba Formula Theoretical limitations –Ignores vehicle characteristics More complex bridge forms would require different closed form solutions –Multiple spans –Variable sections Can’t incorporate track and wheel irregularities

33
Lecture 4 Numerical Modelling – Time-Stepping

34
Advantages of Numerical Approach Bridges of all types can be modelled Track irregularites can be incorporated Wheel irregularities can be incorporated Vehicle response can be incorporated But! –Each run is unique and if track and wheel irregularities are incorporated a large amount of data is required

35
General Moving Force Model Simple Boyne program example Has the advantages of Fryba’s analysis –Linear – therefore superposition is valid –Simple Has disadvantages –Ignores variation in contact forces –Potential problems for cross member analysis –Finite Element limitations

36
Moving Mass Models Potentially less accurate than moving force because the sprung mass will be lumbed with the unsprung mass

37
Moving Mass Term Moving mass terms show the errors involved in using moving forces

38
Moving Train Models Model train separately –Each wagon may constitute a separate model –Wagons defined by their degrees of freedom Calculate interaction forces at each time- step –Must identify the location of each axle Can include track model as part of the bridge model

39
Moving Train Models

41
Modal Analysis Using a modal analysis to model the response of a bridge has advantages –Reduces model size and increases speed significantly –May highlight resonance effects –Could identify peak response Coice of modes is potentially very important.

42
Modeling everything – pros & cons Everything can be included –Detailed structural model –Detailed track model –Detailed vehicle model Disadvantages –Accuracy dependant on large amounts of data –Generates enormous quantities of data –Results are specific to input data

43
Cross Members – Local Effects Lecture V

44
When do local effects become important? This is not a simple question Crossmembers Short span structures Dynamic interaction may influence the response of local members to a very large degree Must understand impulse response!

45
Rail – Wheel Irregularities A useful example

46
Contact Forces Variance increases with speed

47
Wheel – Rail – Track Irregularities Potential sources

48
Time Domain Approach Track irregularities can be modelled in the time domain –Dipped joints –Variable track stiffness Potential Problem for certain types of load effect –Fatigue –Rail loading

49
Frequency Domain Approach Examine the behaviour of a dynamic system in terms of its frequency response Potential advantages for certain stochastic effects Provides insight into the behaviour of a system Can provide peak loads

Similar presentations


>")

>")


