Download presentation
Presentation is loading. Please wait.

1
Anthropometric Assessment Systems BPK 303

2
Anthropometric Assessments Comparison of Anthropometric measures to normative data. Measures intended to reflect growth and/or body composition. Reliable measurement of standardized techniques essential. Appropriate norms?

3
C.F.S. - Canada Fitness Survey 1981 Canadian Fitness and Lifestyle Research Institute Canadian Fitness and Lifestyle Research Institute The 1981 Canada Fitness Survey was the first nationally representative study of the physical recreation habits, physical fitness, and health status of an entire population. More than 23,000 Canadians aged 7 and older participated in this historic survey, providing baseline data representing all Canadians except the 3% not living in households. The anthropometric and performance data was then used as the normative data for the Canadian Standardized Test of Fitness

4
C.S.T.F. Canadian Standardized Test of Fitness Performance Tests Step test, grip strength, push ups, sit ups, sit and reach. Anthropometric Assessment consisted of: % body Fat determined by the Durnin & Womersley equations based upon the sum of 4 skinfolds (Triceps, Subscapular, Biceps, and Iliac Crest)
.")
5
Durnin & Womersley (1974) Density = a (log 10 Sum 4 SF) + c ◦ Sum of Triceps, Subscapular, Biceps, and Iliac Crest Skinfolds ◦ a & c dependent upon age and gender specific equations ◦ British sample measured on the left side of the body % Fat = (4.95/Density)-4.5) x 100 Problems encountered by C.S.T.F. ◦ Overpredicts by 3 - 5% Fat ◦ Upper body sites

6
C.S.T.F. Canadian Standardized Test of Fitness Revised Anthropometric Assessment included: Body Mass Index Sum 5 Skinfolds Sum Trunk Skinfolds Waist to hip girth ratio

7
C.P.A.F.L.A. The Canadian Physical Activity, Fitness & Lifestyle Approach Modification of the C.S.T.F. ◦ Change in style – Rather than using Health Risk Zones, Health Benefit Zones were identified Anthropometric Assessment includes: ◦ Body Mass Index (BMI) ◦ Sum of Five Skinfolds (mm) (SO5S) ◦ Waist Girth (cm) (WG) ◦ Sum of Two Trunk Skinfolds (mm) (SO2S) C.P.A.F.L.A. was taught in BPK 343 now it is C.S.E.P. PATH
 ◦ Sum of Five Skinfolds (mm) (SO5S) ◦ Waist Girth (cm) (WG) ◦ Sum of Two Trunk Skinfolds (mm) (SO2S) C.P.A.F.L.A. was taught in BPK 343 now it is C.S.E.P. PATH.")
8
CSEP-PATH 2013 P hysical A ctivity T raining for H ealth Skinfolds removed Subject embarrassment Measurer training Waist Girth definition changed Girth at the level of the top of the iliac crests Justified as more reliably located and better related to health consequences Requires landmarks

9
Advanced O-SCALE System for individual physique assessment

10
Developed to fill a need % body fat predictions have unacceptably high S.E.E.’s Individual assessments vs group validation Designed with the expectation of becoming obsolete very soon

11
Components Anthropometric measures Height, Weight, Skinfolds, Girths, Humerus and Femur width Geometric scaling Maintain shape and composition General appraisal of physique A and W ratings Detailed appraisal Size and Proportionality Profiles

12
STANINE chosen for O-SCALE system based upon number of categories and equal width of categories Stanine Category 123456789 Percentage of Normal Distribution within Category 4%7%12%17%20%17%12%7%4% Boundary Z-Scores -1.75-1.25-0.75-0.25+0.25+0.75+1.25+1.75 Boundary Percentiles 411234060778996

13
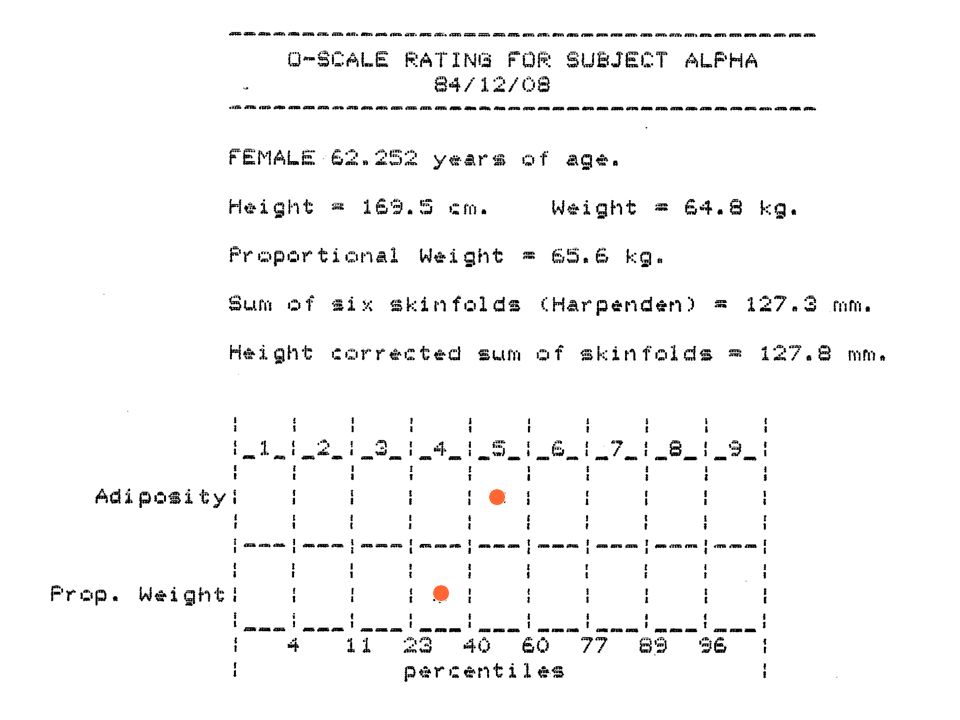
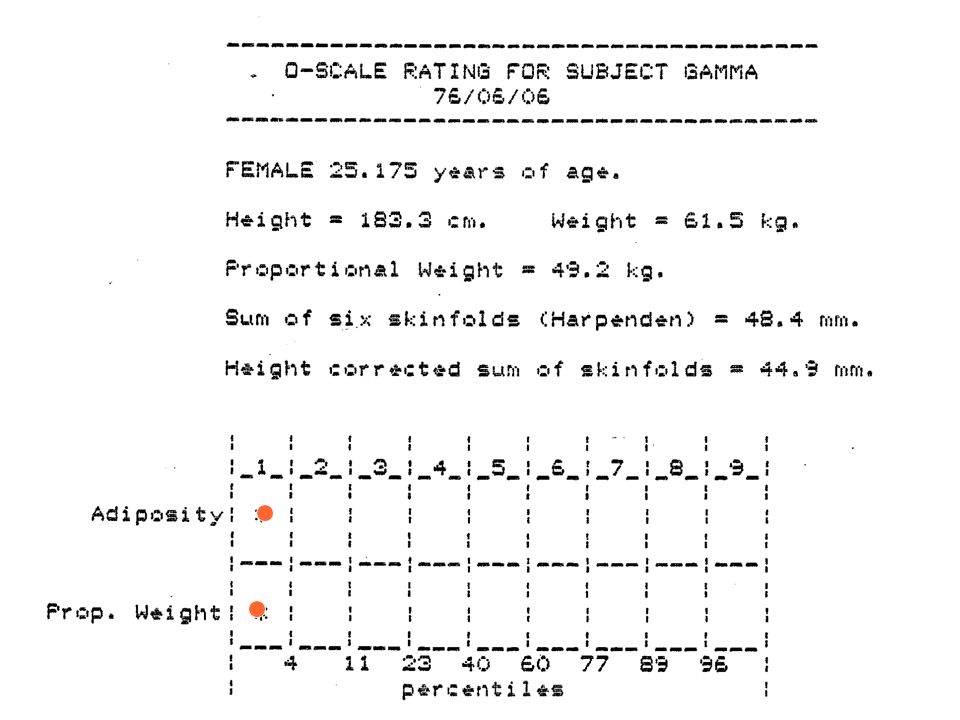
General description of physique Adiposity rating based on skinfolds Proportional weight rating Stanine scores equal width of categories nine categories seemed appropriate

14
Adiposity Rating Proportional Sum of six skinfolds Sum 6 SF * (170.18/Ht) Comparison to age and sex specific norms via stanine scale
 Comparison to age and sex specific norms via stanine scale")
15
Females 23 year old female Prop. Sum of 6 skinfolds = 79.4 Adiposity (A) rating = 3
 rating = 3")
16
Proportional Weight Rating Proportional Weight WT * (170.18/HT) 3 Comparison to age and sex specific norms via stanine scale
 3 Comparison to age and sex specific norms via stanine scale")
17
Females

18
A & W Ratings A = 7, W = 7, - Balanced physique A = 7, W = 5, - Adiposity dominant A = 5, W = 7, - Weight dominant

20
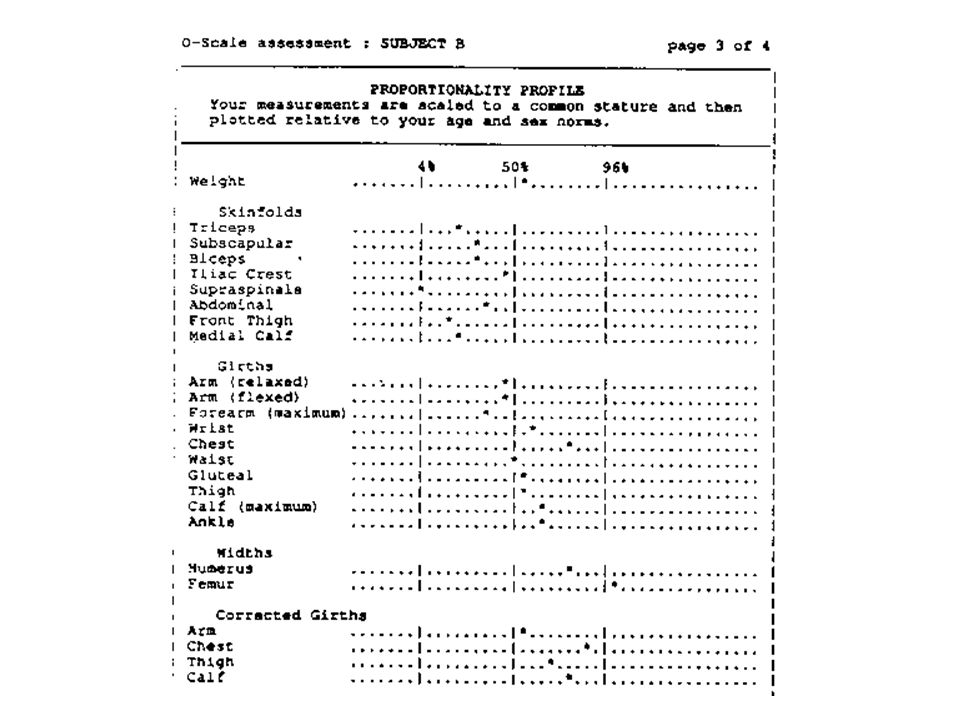
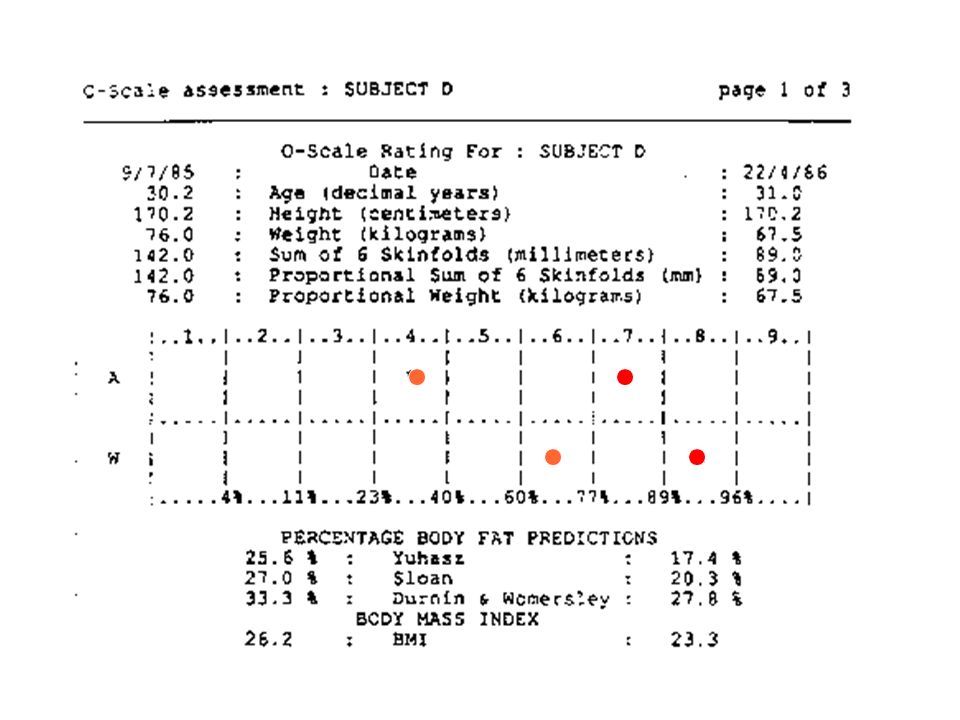
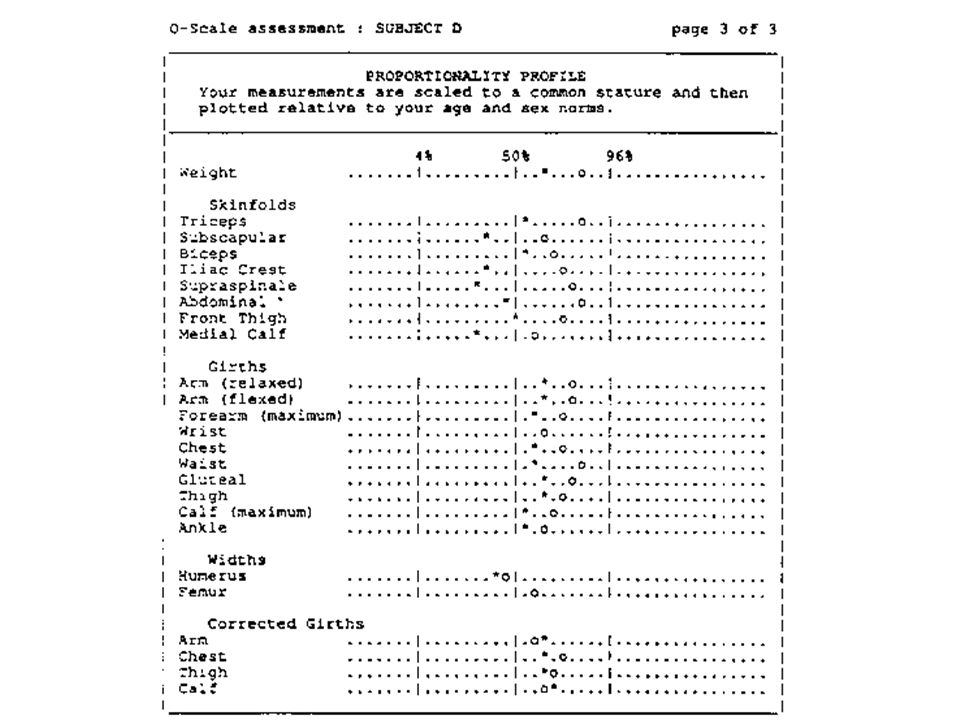
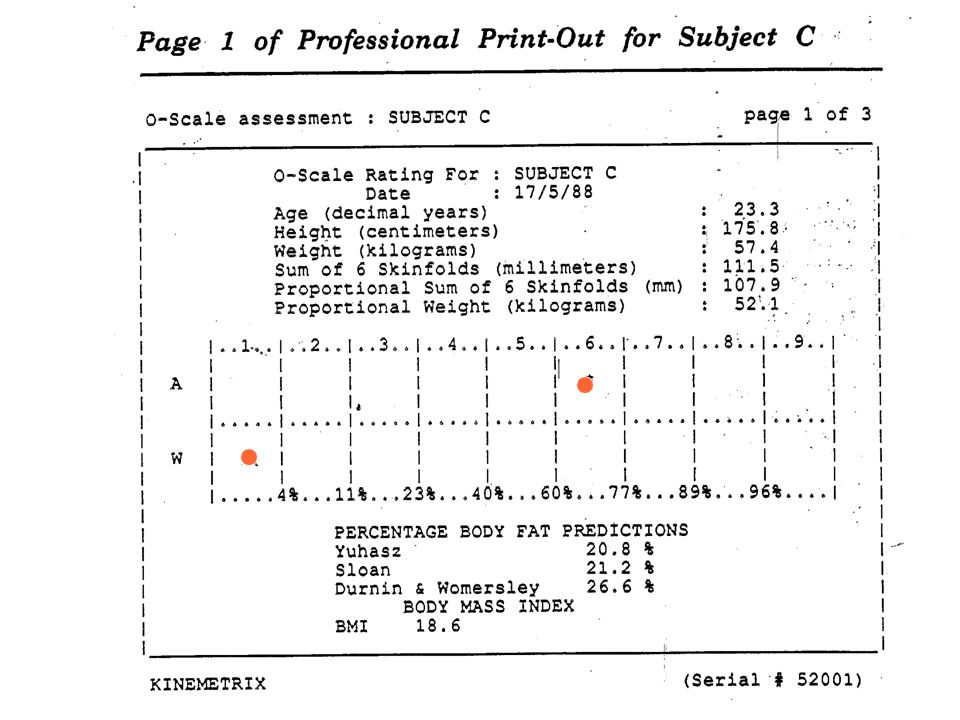
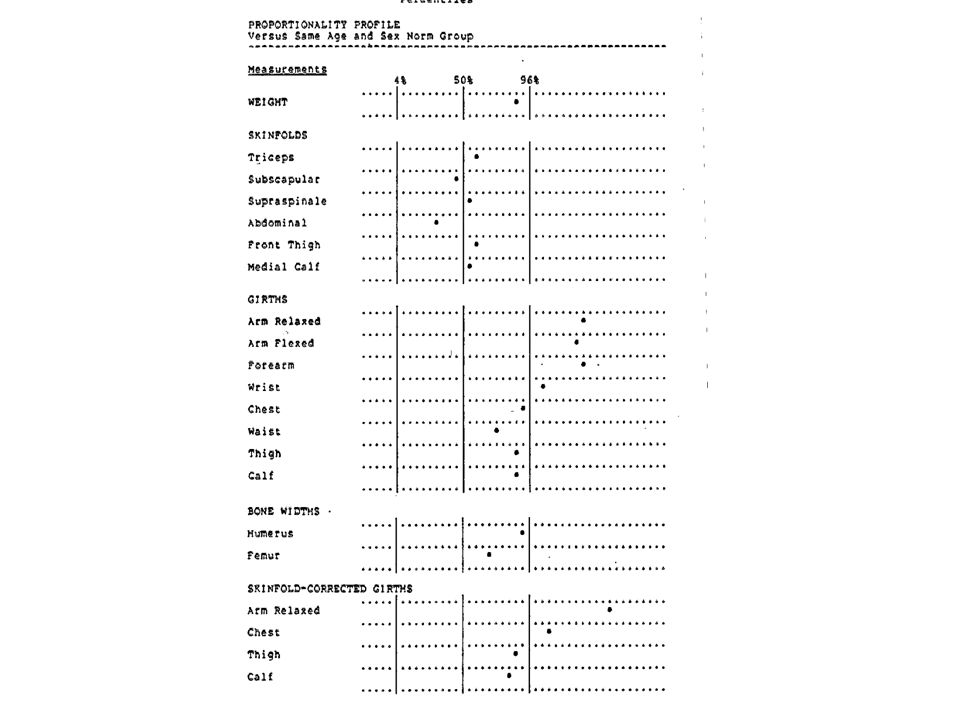
Detailed Description of Physique Listing of all measures with 4th, 50th & 96th percentiles Proportionality profiles z-values plotted vs similarly scaled norm values

23
Active 303 Student

31
MALE

34
GAMMA

35
THETA

37
Differences from O-SCALE system Normative Database: Proportional Values rather than z-values: Skinfold-adjusted Forearm Girth: Scaling Height is 170cm rather than 170.18cm: Detailed Description of Physique does not require Computer Software: C.P.A.F.L.A. Indices shown as percentile charts based upon KIN-Scale norms 37

38
Fall 2012 students 38 W Rating Total 123456789 % A Rating 1123 3.6 2224210 11.9 311114 4.8 41136331119 22.6 5113373119 22.6 6335213 15.5 71126111 13.1 811 1.2 9314 4.8 Total35718152294184 %3.66.08.321.417.926.210.74.81.2 Balanced20 (23.8%) Weight Dominant 33 (39.3%) Adiposity Dominant 31 (36.9%)
 Weight Dominant 33 (39.3%) Adiposity Dominant 31 (36.9%)")
39
A – W Difference indicates relative Musculo-Skeletal Development 5 - 2 4 - 2 4 -8

40
Geometric Similarity Scaling

41
41 Muscularity Upper Arm 19.4 19.119.619.920.420.821.021.521.922.222.322.623.023.223.423.624.224.825.526.8 Forearm 19.4 19.119.720.020.220.520.821.021.221.421.521.621.822.022.222.422.723.023.423.9 Thigh 42.0 43.244.445.746.847.448.048.549.049.349.950.551.151.752.253.053.754.755.757.9 Calf 29.0 28.229.029.429.730.130.531.031.331.632.032.532.633.033.233.634.234.735.336.5 Muscularity Upper Arm 23.8 19.119.619.920.420.821.021.521.922.222.322.623.023.223.423.624.224.825.526.8 Forearm 23.6 19.119.720.020.220.520.821.021.221.421.521.621.822.022.222.422.723.023.423.9 Thigh 60.8 43.244.445.746.847.448.048.549.049.349.950.551.151.752.253.053.754.755.757.9 Calf 39.8 28.229.029.429.730.130.531.031.331.632.032.532.633.033.233.634.234.735.336.5 Muscularity Upper Arm 22.4 19.119.619.920.420.821.021.521.922.222.322.623.023.223.423.624.224.825.526.8 Forearm 21.1 19.119.720.020.220.520.821.021.221.421.521.621.822.022.222.422.723.023.423.9 Thigh 45.2 43.244.445.746.847.448.048.549.049.349.950.551.151.752.253.053.754.755.757.9 Calf 30.8 28.229.029.429.730.130.531.031.331.632.032.532.633.033.233.634.234.735.336.5 5 - 2 4 - 2 4 - 8

42
Anthropometric Assessment of Special Populations bpk 303

43
What is a Special Population? One that can not be assessed by orthodox methodology Body Composition % Fat estimates tend to be very sample specific Anthropometric Assessment Are standardized techniques still valid in special groups

44
Which Measures are OK? Validity & Feasibility Can the standardized measurement position be achieved Recumbent or seated subjects Can other conditions of standardization be achieved Deformities or Contractures

45
Seniors who can not stand Estimated required caloric intake based upon age, height & weight Predicting Height from Knee Height Men 64.19 - (0.04 x age) + (2.02 x Knee Height) Women 84.88 - (0.24 x age) + (1.83 x Knee Height) Predicting Weight from Girths & Skinfolds Men 1.92 (arm girth) + 1.44 (calf girth) + 0.25 (subscapular skinfold) - 39.97 Women 0.92 (arm girth) + 1.50 (calf girth) + 0.42 (subscapular skinfold) - 26.19
 + (2.02 x Knee Height) Women (0.24 x age) + (1.83 x Knee Height) Predicting Weight from Girths & Skinfolds Men 1.92 (arm girth) (calf girth) (subscapular skinfold) Women 0.92 (arm girth) (calf girth) (subscapular skinfold)")
46
Norms Available? Cerebral Palsy vs Down’s Syndrome Which groups warrant their own norms

47
Treatment and Rehabilitation of Children with cerebral palsy, brain injuries and other neuromotor problems

49
Pediatric Anthropometry Assessment of Nutritional Status of Children Children with developmental disabilities are at increased nutritional risk because of: feeding problems, abnormal levels of physical activity and altered weight and growth patterns.

50
Cerebral Palsy Two main problems: Presence of muscular contractures, spasms and scoliosis often lead to inaccuracy for measurements of height or recumbent length Body part splints, braces or wheelchair accessories do not permit easy access for anthropometric measures.

51
S.H.A.P.E.S. Anthropometric Techniques: Stretch Stature, Weight Upper Arm Length, Tibial Length Triceps, Abdominal, Medial Calf Skinfolds Relaxed Arm and Maximum Calf Girths

52
S.H.A.P.E.S. custom computer software serial plotting anthropometric profile

Similar presentations


, and varies with gender and age. Extra metabolic energy is consumed.>")


