Download presentation
Presentation is loading. Please wait.

1
Spatial variation of worst dust days (number shows the mean dust conc for WDD)
")
2
Seasonal variation of worst dust days (# of WDD per season)
")
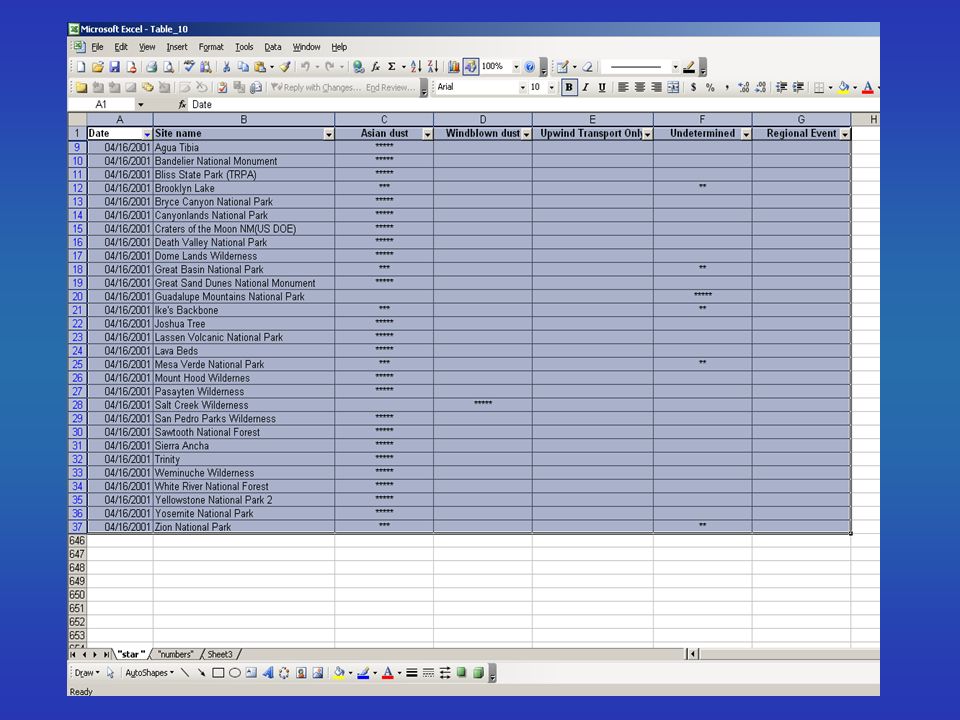
3
April 16, 2001

5
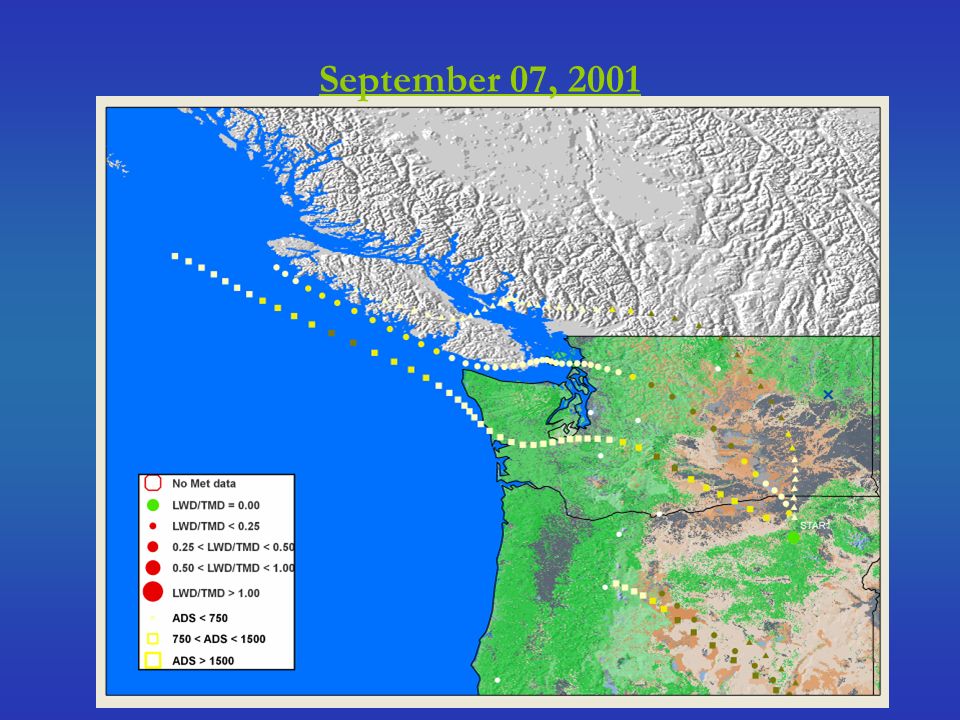
September 07, 2001

9
October 16, 2001

11
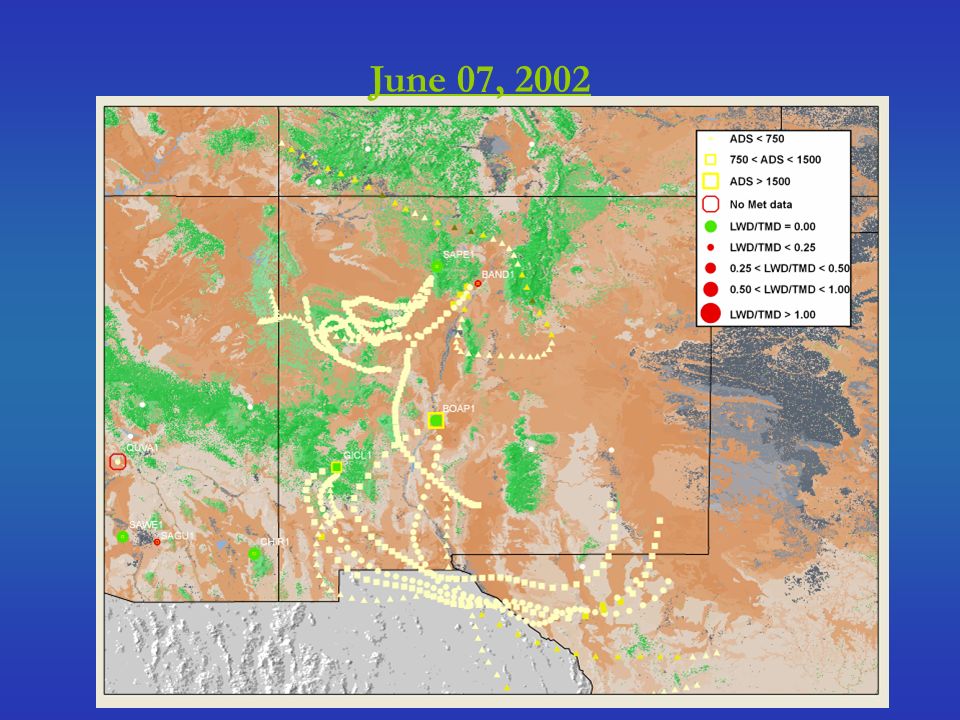
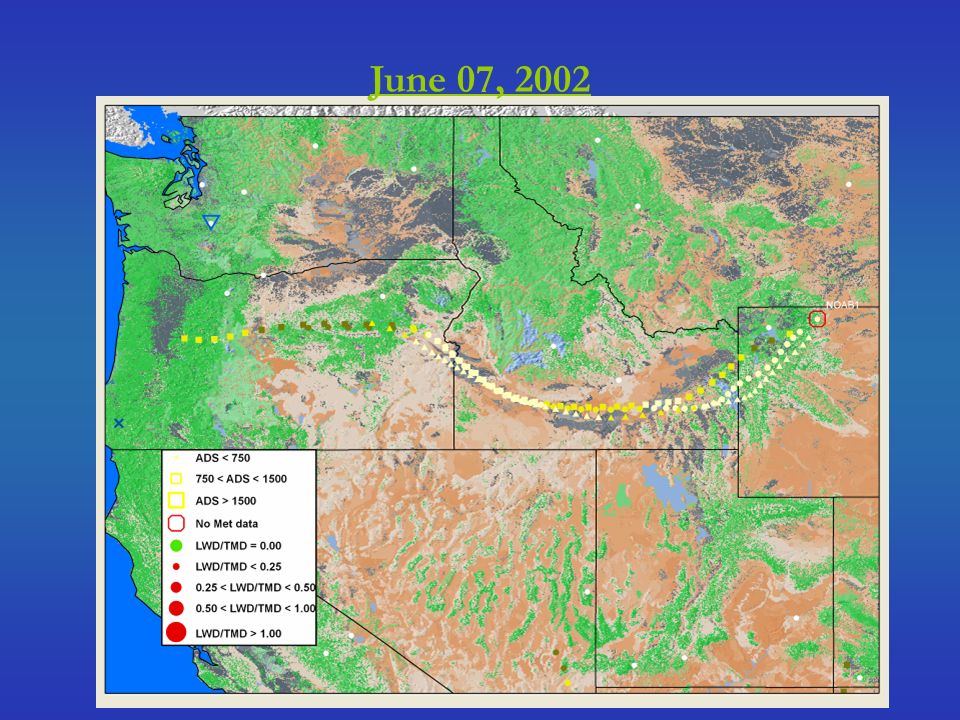
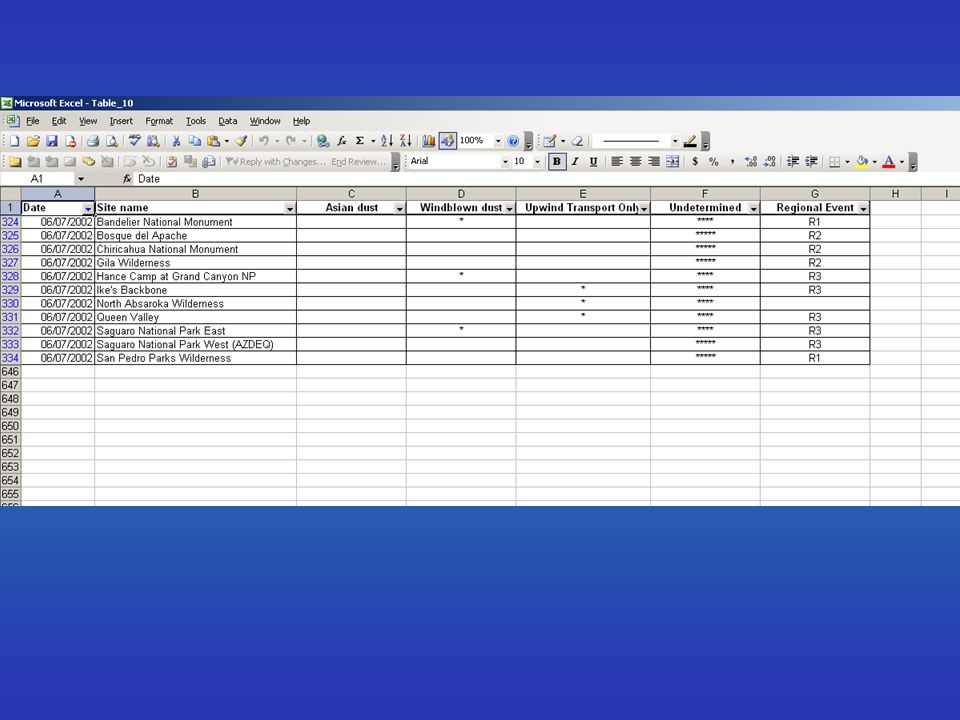
June 07, 2002

15
September 17, 2002

17
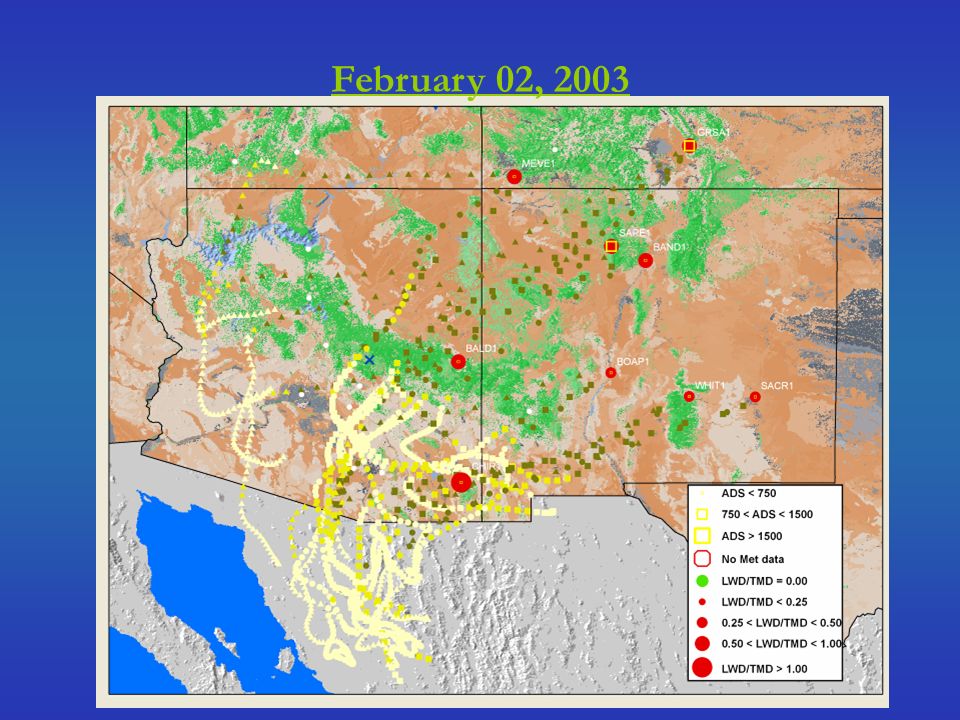
February 02, 2003

20
Worst dust days attributed to events

21
Sources of worst dust days

22
Alaska

23
Idaho, Montana, Wyoming, North and South Dakota

24
New Mexico

25
Colorado, Nevada and Utah

26
Arizona

27
Arizona: Undetermined case

28
California

29
Seasonal variation of determined and undetermined worst dust days

30
Seasonal variation of determined and undetermined worst dust days for AZ and CA Arizona California

31
Seasonal variation

32
WEB site development On the basis of conceptual models for each site: Question 1: Is there a statistically significant relationship between dust mass and wind conditions ? (MLRA results) Question 2: What are the major events/sources of dust? (A table for each site and maps) Question 3: Are there, and to what extent, other undetermined sources? (A table for each site) Question 4: Are there any seasonal trends in the events/sources of dust? (maps) Description of the methodology Episode analysis: Choose episodes based on a combination of season, month, year site, state event/source confidence level A table and relevant maps for each episode
 Question 2: What are the major events/sources of dust. (A table for each site and maps) Question 3: Are there, and to what extent, other undetermined sources. (A table for each site) Question 4: Are there any seasonal trends in the events/sources of dust. (maps) Description of the methodology Episode analysis: Choose episodes based on a combination of season, month, year site, state event/source confidence level A table and relevant maps for each episode.")
33
Future tasks Characterize event types and scales of the events Look at specific “regions” and analyze EHA results in context of season, regional-scale meteorology, topography Utilize chemistry to differentiate between source types and regions (using EHA results) Obtain activity data for agricultural activities and determine relationship with EHA results (e.g. if unexplained days in CA are due to almond harvesting) Expand windblown dust analysis by using trajectory data where surface meteorological data are unavailable Perform area source identification E.g. New Mexico Pilot Study (next presentation) Verify the outcomes of EHA Select specific WDD and obtain supplemental data (e.g. satellite, urban air monitoring, etc) to confirm/support EHA results
 Expand windblown dust analysis by using trajectory data where surface meteorological data are unavailable Perform area source identification E.g. New Mexico Pilot Study (next presentation) Verify the outcomes of EHA Select specific WDD and obtain supplemental data (e.g. satellite, urban air monitoring, etc) to confirm/support EHA results.")
Similar presentations


 program Go to one of over 140 Colleges for.>")


44% b)53%>")


 San Diego, California1.>")
