Download presentation
Presentation is loading. Please wait.

1
Using the life table to construct a population growth model with age structure: The Leslie matrix

2
1) Need an N for every age class: N 0, N 1, N 2, N 3 2) Next rates that govern the addition and subtraction of individuals by age class: Individuals are added by birth or by aging. Individuals are subtracted by death or by aging. N 4 (t+1) = 0 xl(x)g(x)b(x) 010.80 1 0.52 20.40.253 30.101 4000 p i : probability of surviving from age i to age i+1: N 0 (t+1) = b 1 N 1 (t)+b 2 N 2 (t)+b 3 N 3 (t) N 3 (t+1) = p 2 *N 2 (t) p 2 =0.25 N 2 (t+1) = p 1 *N 1 (t) p 1 =0.50 N 1 (t+1) = p 0 *N 0 (t) p 0 =0.80
 = 0 xl(x)g(x)b(x) p i : probability of surviving from age i to age i+1: N 0 (t+1) = b 1 N 1 (t)+b 2 N 2 (t)+b 3 N 3 (t) N 3 (t+1) = p 2 *N 2 (t) p 2 =0.25 N 2 (t+1) = p 1 *N 1 (t) p 1 =0.50 N 1 (t+1) = p 0 *N 0 (t) p 0 =0.80.")
3
N 0 (t+1) = b 1 N 1 (t)+b 2 N 2 (t)+b 3 N 3 (t) N 3 (t+1) = p 2 *N 2 (t) N 2 (t+1) = p 1 *N 1 (t) N 1 (t+1) = p 0 *N 0 (t) One model, four equations: Another way to write these equations is in “matrix form”: N 0 (t+1) N 1 (t+1) N 2 (t+1) N 3 (t+1) b 0 b 1 b 2 b 3 p 0 0 0 0 0 p 1 0 0 0 0 p 2 0 N 0 (t) N 1 (t) N 2 (t) N 3 (t) = Leslie Matrix
 = b 1 N 1 (t)+b 2 N 2 (t)+b 3 N 3 (t) N 3 (t+1) = p 2 *N 2 (t) N 2 (t+1) = p 1 *N 1 (t) N 1 (t+1) = p 0 *N 0 (t) One model, four equations: Another way to write these equations is in matrix form : N 0 (t+1) N 1 (t+1) N 2 (t+1) N 3 (t+1) b 0 b 1 b 2 b 3 p p p 2 0 N 0 (t) N 1 (t) N 2 (t) N 3 (t) = Leslie Matrix")
4
Age class 32103210 No of individuals 100 50 15 20 Time 0:Time 1: N 0 (t+1) = 2*N 1 (t)+3*N 2 (t)+N 3 (t) N 3 (t+1) = 0.25*N 2 (t) N 2 (t+1) = 0.5*N 1 (t) N 1 (t+1) = 0.8*N 0 (t) Age class 32103210 No of individuals 100+60+15 80 5 25 For: b 1 =2, b 2 = 3, b 3 =1 and p 0 =0.8, p 1 =0.5, p 2 =0.25
 = 2*N 1 (t)+3*N 2 (t)+N 3 (t) N 3 (t+1) = 0.25*N 2 (t) N 2 (t+1) = 0.5*N 1 (t) N 1 (t+1) = 0.8*N 0 (t) Age class No of individuals For: b 1 =2, b 2 = 3, b 3 =1 and p 0 =0.8, p 1 =0.5, p 2 =0.25")
5
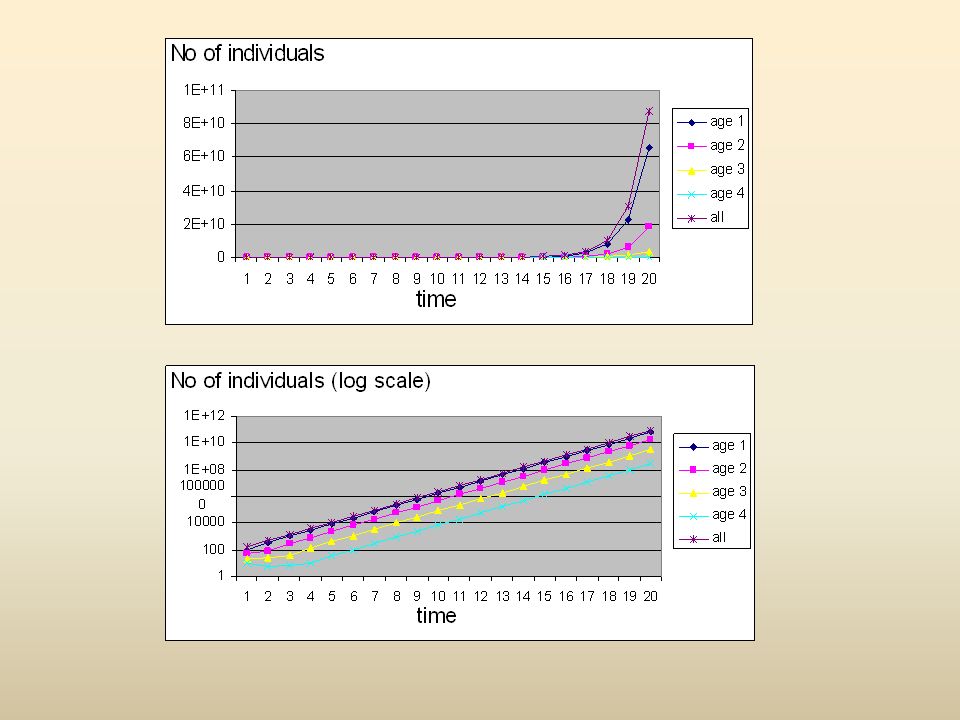
Plug & Play Excel Worksheets: Leslie Matrix

8
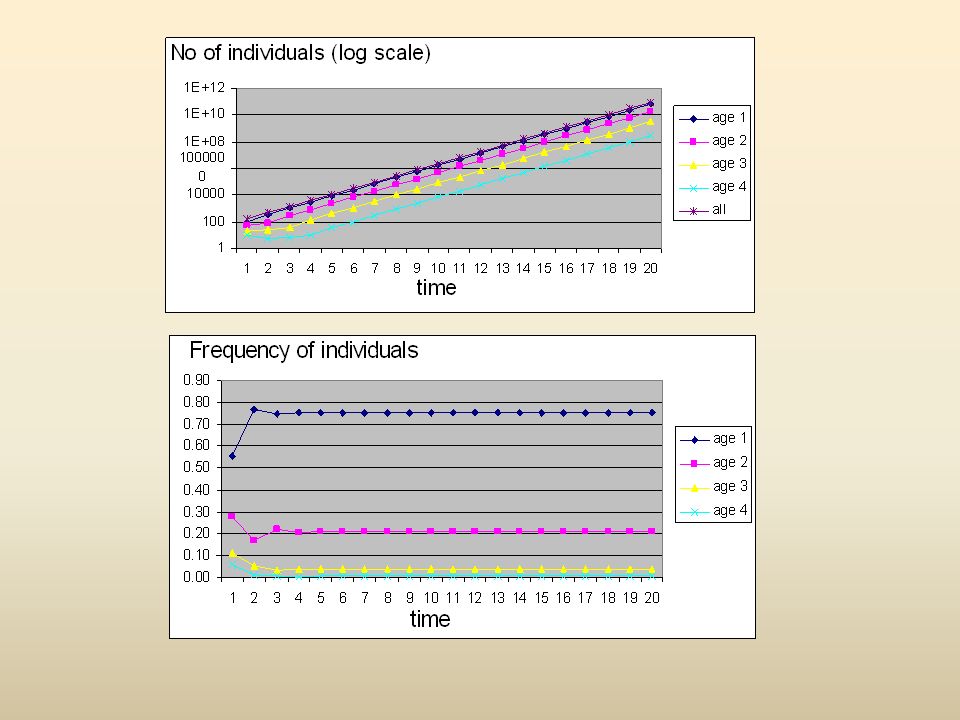
STABLE AGE STRUCTURE: A condition wherein the proportions of individuals of certain ages do not change as the population as whole increases or declines. In age-structured population models (Leslie), the stable age structure is dictated by the model parameters (age-specific birth rates and survivorships), and it often (but not always) develops spontaneously.
, the stable age structure is dictated by the model parameters (age-specific birth rates and survivorships), and it often (but not always) develops spontaneously..")
9
N 1 (t+1) = N 1 (t) N 4 (t+1) = N 4 (t) N 3 (t+1) = N 3 (t) N 2 (t+1) = N 2 (t) At stable age structure, the Leslie Matrix model can be simplified: equivalent to: N 1 (t+1) N 2 (t+1) N 3 (t+1) N 4 (t+1) N 1 (t) N 2 (t) N 3 (t) N 4 (t) = r = ln(R 0 )/G r = ln( )/
 = N 1 (t) N 4 (t+1) = N 4 (t) N 3 (t+1) = N 3 (t) N 2 (t+1) = N 2 (t) At stable age structure, the Leslie Matrix model can be simplified: equivalent to: N 1 (t+1) N 2 (t+1) N 3 (t+1) N 4 (t+1) N 1 (t) N 2 (t) N 3 (t) N 4 (t) = r = ln(R 0 )/G r = ln( )/ ")
10
Summary: 1.Life table information can be used to write a population growth model for populations with overlapping generations. 2.Leslie Matrix models are density-independent, giving rise only to either exponential growth, zero growth, or exponential decay. 3.These models predict that often, but not always, populations approach a stable age distribution. 4.At that stable age distribution, all age classes grow or decline with equal rate.

11
Even though the Malthusian model can approach the output of age-structure models, responses to perturbation are very different: Define: Demographic Inertia = the resistance of a population to change growth rate, due to the population’s age structure.

12
Plug & Play Excel Worksheets: Demographic Inertia

13
A population in decline: Japan Transitioning from positive to zero or negative growth has implications for the social organization of society.

14
Even though the Malthusian model can approach the output of age-structure models, responses to perturbation are very different: Structured populations require more time to adjust to new conditions. The results are time-lags between regime change and the attainment of the new steady-state condition.

Similar presentations


/K>")


 rabbits at “plague proportions” in Australia from Wikimedia Commons.>")


