Download presentation
Presentation is loading. Please wait.

1
Working together for clean air Preliminary Analysis of PM 2.5 Speciation Data in Puget Sound Puget Sound Clean Air Agency Mike Gilroy, Erik Saganic Puget Sound Clean Air Agency Mike Gilroy, Erik Saganic

2
Overview Site Introduction Review of Speciation Parameters Aethalometer Introduction Aethalometer Data Analysis Conclusions Site Introduction Review of Speciation Parameters Aethalometer Introduction Aethalometer Data Analysis Conclusions

3
Network “Big Picture” “Almost Pure” Wood Smoke Darrington Site Marysville Wood Smoke North Site Lake Forest Park Wood Smoke North Site Olive Street Freeway Site Duwamish Industrial Site Beacon Hill Urban Background Site South Tacoma Wood Smoke South Site Blue Sites denote Speciation Network Network Scope 110 Miles

4
Duwamish – Industrial Site Olive Street – Highway Site Beacon Hill – Residential Site

5
South Tacoma – Woodsmoke Site

6
Lake Forest Park – Residential Site

7
Olive Street, Seattle – Mobile Source Site

8
Duwamish, Seattle – Industrial Site

9
South Tacoma Site – Wood Smoke/Residential Site

11
Analytes by Site – 2006 IndustrialHighwayWood Smoke

12
IndustrialHighwayWood Smoke

13
IndustrialHighwayWood Smoke

14
Highway Site

15
Industrial Site

16
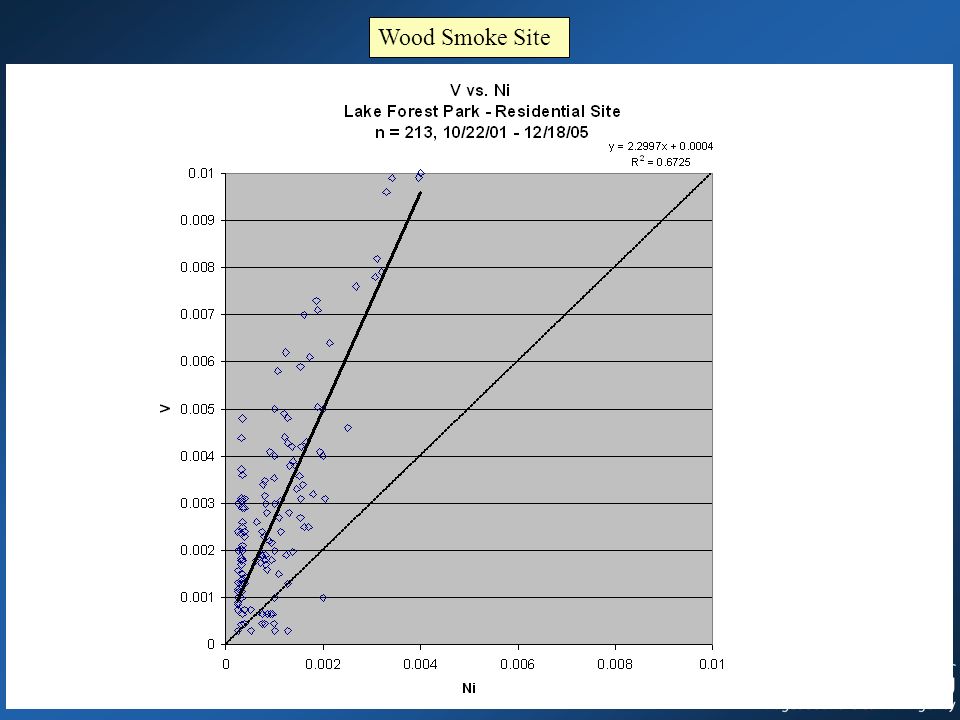
Wood Smoke Site

18
V vs. Ni Correlations SiteAerosol TypeSlopeR2R2 Olive StreetHighway2.130.82 DuwamishIndustrial1.870.54 South TacomaWood smoke2.220.66 Lake Forest ParkWood smoke2.300.67

19
IndustrialHighwayWood Smoke

20
EC/OC Ratio vs. PM 2.5

21
Aethalometer Measurement Magee Scientific BC Channel 880 nm UV Channel 370 nm Magee Scientific BC Channel 880 nm UV Channel 370 nm Sampling Hose PM 2.5 Head @ 5 LPM

22
Industrial Site

23
Wood Smoke Site

24
Industrial Site

25
Wood Smoke Site

26
(UV – BC) vs. OC Industrial Site
 vs. OC Industrial Site")
27
(UV – BC) vs. OC Wood Smoke Site
 vs. OC Wood Smoke Site")
28
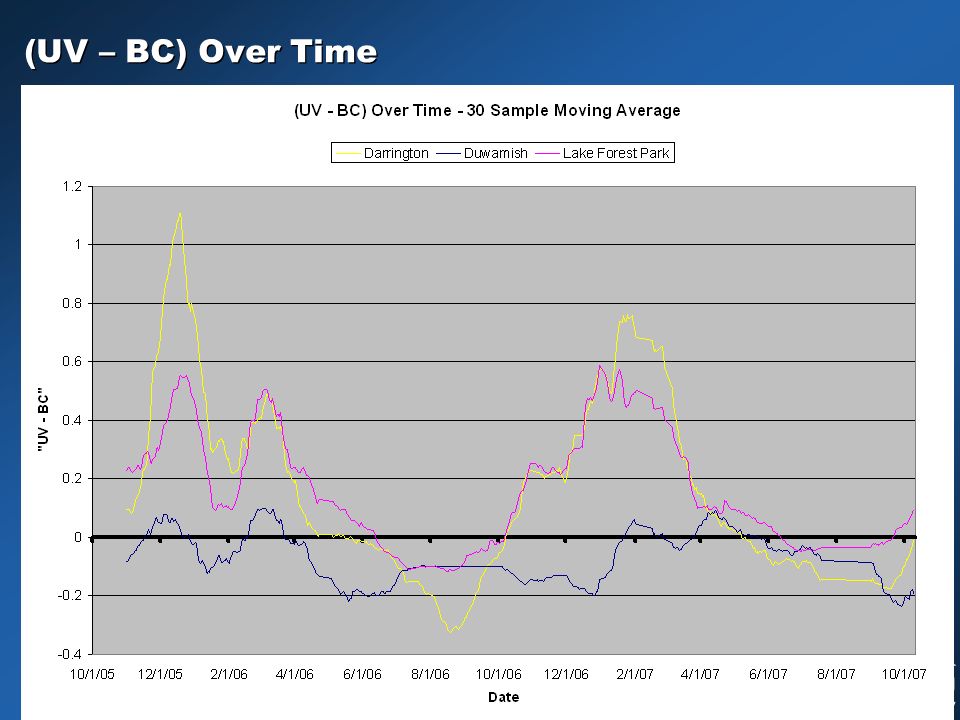
(UV – BC) Over Time
 Over Time")
30
Wind Roses – UV Channel South TacomaDuwamish

31
Conclusions We can use this data to better understand our emission sources Using a suite of continuous monitors (FDMS, nephelometer, aethalometer, etc) is essential to enriching the understanding of the data Rich data sets currently available Continuous monitors like the Aethalometer can provide: Real-time data Cheaper sampling More data Currently packaged in a few of our publicly available products We can use this data to better understand our emission sources Using a suite of continuous monitors (FDMS, nephelometer, aethalometer, etc) is essential to enriching the understanding of the data Rich data sets currently available Continuous monitors like the Aethalometer can provide: Real-time data Cheaper sampling More data Currently packaged in a few of our publicly available products
 is essential to enriching the understanding of the data Rich data sets currently available Continuous monitors like the Aethalometer can provide: Real-time data Cheaper sampling More data Currently packaged in a few of our publicly available products We can use this data to better understand our emission sources Using a suite of continuous monitors (FDMS, nephelometer, aethalometer, etc) is essential to enriching the understanding of the data Rich data sets currently available Continuous monitors like the Aethalometer can provide: Real-time data Cheaper sampling More data Currently packaged in a few of our publicly available products")
Similar presentations
 Mass,>")


 calculated with POLAIR dispersion model using (2004) NO 2 concentrations from.>")

 PM10 – Particulate Matter < 10 microns 2) PM2.5 – Particulate Matter < 2.5 microns - Measured with different.>")


 William C. Malm (NPS) Graham Bench (LLNL) Graham.>")
 Demonstration Puget Sound Clean Air Agency Mike Gilroy, Erik Saganic Puget Sound Clean Air.>")


