Download presentation
Presentation is loading. Please wait.

1
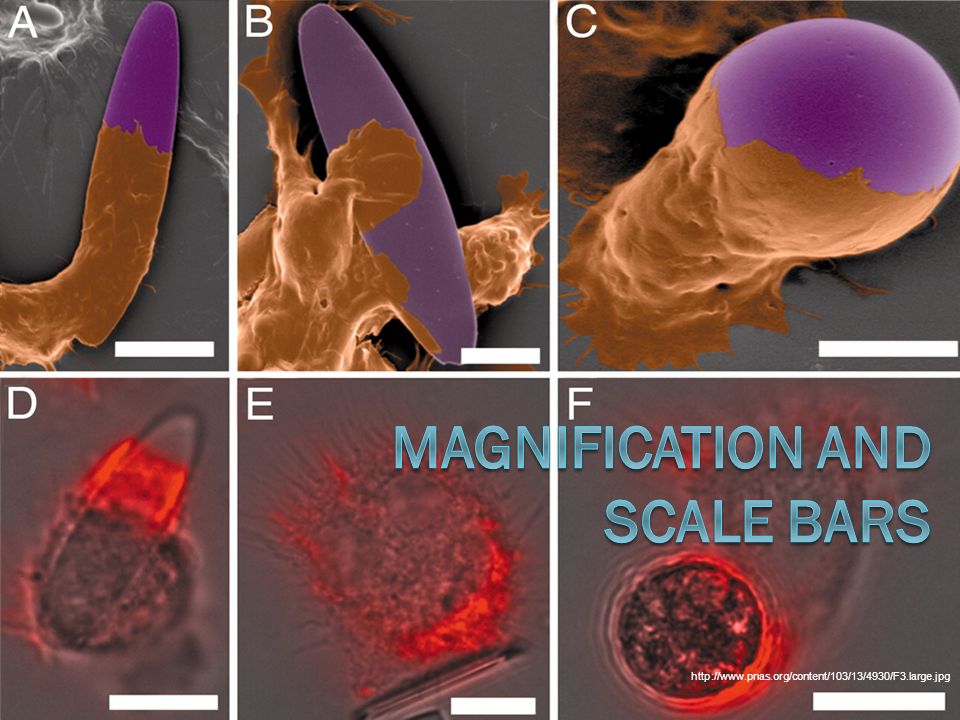
http://www.pnas.org/content/103/13/4930/F3.large.jpg
2
Magnification Often, scientists need to indicate the magnification and the overall size of images and specimens. The size is how large something actually is without drawing it. The magnification is how large something is compared to its actual size. Magnification = size of image___ actual size of specimen www.travismulthaupt.com

3
Magnification The important thing to remember is that when doing these calculations, one must use the same metric prefixes for the sizes of the image and the specimen. Either all in millimeters or all in micrometers. www.travismulthaupt.com

4
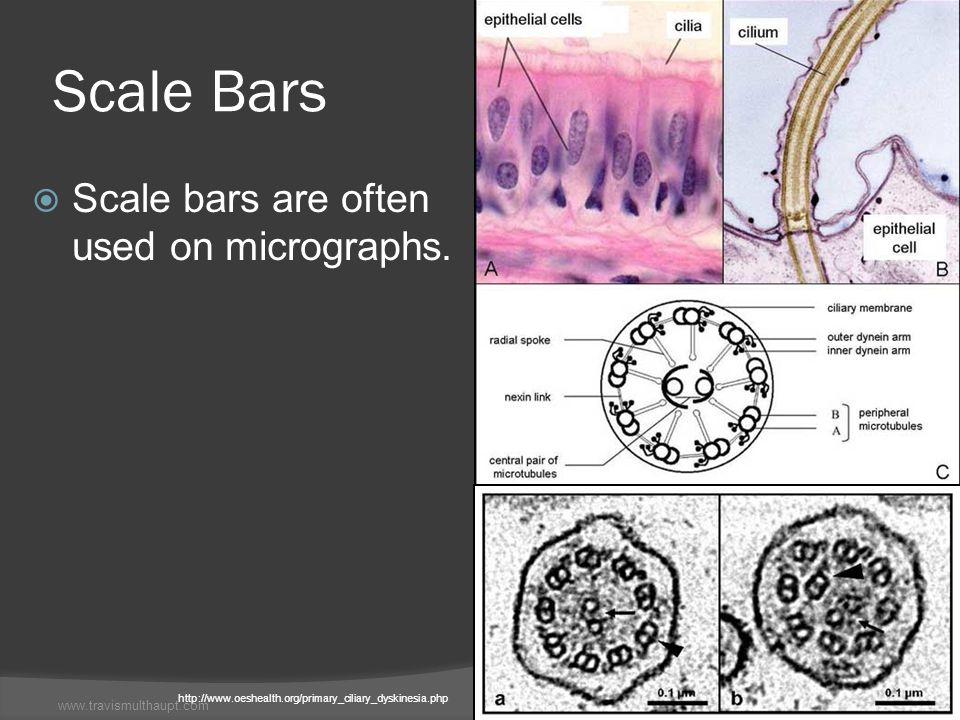
Scale Bars Scale bars are often used on micrographs. http://www.oeshealth.org/primary_ciliary_dyskinesia.php www.travismulthaupt.com
5
Scale Bars They consist of a line, with the actual size that the line represents. For instance, if we have a scale bar 10mm long on a micrograph with a 10,000x magnification, the scale bar would say: 1m1m Magnification = Size you draw the scale- bar ÷ the size the scale bar represents www.travismulthaupt.com

6
Scale Bars 1. Think of a value for your scale bar, e.g. 1 micron ( m) (this should always be a round figure, or reasonable fractions thereof). 2. Multiply this by the final print magnification of the micrograph. If you are only given a magnificaiotn in the drawing, assume it’s the print magnification. 3. This value is the length of the scale bar, in this case in microns, ( m). http://www.biotech.ufl.edu/EM/data/scalebar.html www.travismulthaupt.com
 (this should always be a round figure, or reasonable fractions thereof). 2. Multiply this by the final print magnification of the micrograph. If you are only given a magnificaiotn in the drawing, assume it’s the print magnification. 3. This value is the length of the scale bar, in this case in microns, ( m).")
7
Scale Bars Sometimes you may choose an impractical figure for the scale bar to represent. For example, if you choose 1 m for a magnification of 400x then the scale bar would only be 400 m (0.4mm) long. This is crazy so how about choosing 20 m? The scale bar would then have to be 20 m x 400 = 8000 m = 8mm. http://www.biotech.ufl.edu/EM/data/scalebar.html www.travismulthaupt.com
 long. This is crazy so how about choosing 20 m. The scale bar would then have to be 20 m x 400 = 8000 m = 8mm.")
8
Scale Bars At the other end of the scale, if you have a magnification of 120,000x then a 1 m scale bar would be 120mm - much too long. So how about a 0.1 m (or 100 nm) scale bar? This is much better because then the scale bar would be 0.1 m x 120,000 = 12,000 microns = 12mm. http://www.biotech.ufl.edu/EM/data/scalebar.html www.travismulthaupt.com
 scale bar. This is much better because then the scale bar would be 0.1 m x 120,000 = 12,000 microns = 12mm.")
9
Scale Bars DO NOT fall into the trap of doing it the other way around. Don’t calculate what a bar of given length will represent. This will leave you with all your bars the same length (very neat, yes) but representing crazy figures like 0.23 micron, 66 nm, etc! http://www.biotech.ufl.edu/EM/data/scalebar.html www.travismulthaupt.com
 but representing crazy figures like 0.23 micron, 66 nm, etc.")
10
Scale Bars Okay, so back to what we were discussing earlier: 1. Think of a value for your scale bar, e.g. 1 micron ( m) (this should always be a round figure, or reasonable fractions thereof). Let’s choose 50 m. http://www.biotech.ufl.edu/EM/data/scalebar.html www.travismulthaupt.com
 (this should always be a round figure, or reasonable fractions thereof). Let’s choose 50 m.")
11
Scale Bars 2. Now, multiply this by the final print magnification of the micrograph. How do we get this? The final print magnification is 8.5x. What it is.What we see. What we draw. @ 40x X 8.5 4.6mm 39mm 39mm ÷ 4.6mm = 8.5 www.travismulthaupt.com

12
Scale Bars 3. This value is the length of the scale bar, in this case in microns, ( m). We’ve determined our print magnification to be 8.5x. So we’ve chosen our scale bar size to represent 50 m, so just plug into the equation from earlier. Magnification = measured value actual value 8.5x =Measured value ÷ 50 mMeasured value is 425 m or 0.425mm www.travismulthaupt.com

13
Scale Bars So, let’s try again. Let’s chose 1250 m this time and use 8.5x as the magnification of our drawing compared to the actual size we see and plug into the equation. 8.5x = measured value ÷ 1250 m Now we get a measured value for our error bar of 10.6mm, or 1.1cm—much more meaningful. www.travismulthaupt.com

14
Calculate the Magnification of “Q” and “R”. For “Q,” the scale bar represents 25 m. 320x For “R,” the scale bar represents 10 m. 600x www.travismulthaupt.com

20
Questions? www.travismulthaupt.com

Similar presentations


>")

