Download presentation
Presentation is loading. Please wait.

1
RB-Explorer M7a –Water Quality and Ecology Workgroup WFD-Explorer model wrapup

2
Agenda Setup of the model Calibration Show results Implementation of the PUNN model in the WFD Explorer Extending the model (future improvements) Use of the model
 Use of the model")
3
WFD Explorer schematization Hydrology (Ribasim) DomesticIndustrialDiffuse Emissions Model results Monitoring data Calibrate, validate 1 2 3 Import flows 4 5 6 Retention Ecological Module 7 8 Ecological Key Factors 8 Measures 9 Status: Today
 DomesticIndustrialDiffuse Emissions Model results Monitoring data Calibrate, validate Import flows Retention Ecological Module 7 8 Ecological Key Factors 8 Measures 9 Status: Today")
4
1. Schematization Consists of: Water bodies (river and lakes/reservoirs) Surface Water Units Districts Basin Nodes Based on: GIS maps Coupled to the RIBASIM schematisation
 Surface Water Units Districts Basin Nodes Based on: GIS maps Coupled to the RIBASIM schematisation.")
5
2 & 3. RIBASIM – WFD-Explorer coupling

6
2 & 3. Final update of RIBASIM Problem: Zero flows in some stretches when no runoff is available Domestic waste water flows were not included in the model Added: Flow rate per capita Municipalities connected to RIBASIM infow nodes

7
4. Emission Data SourceTypeQualityLoads DiffuseDiffuse, based on districts Best available dataRiver basin protection action plan DomesticPointModerate, based on factors Estimates based on factors and removal efficiency IndustrialPointModerate, probably incomplete Based on legislation

8
4. Diffuse Sources to Basins Based on districts (67)
")
9
4. Domestic Waste Water Communities (185) population Emission factor (per inh.) X = Load per community Communities (185) Sewer system Septic tank Surface water WWTP
 population Emission factor (per inh.) X = Load per community Communities (185) Sewer system Septic tank Surface water WWTP.")
10
4. Industrial loads 47 locations known 39 with discharge data Loads computed based on tables:

11
6. Monitoring locations for validation/calibration

12
5 & 7. Data availability for modeled substances Number of WQ samples of selected stations per year RIBASIM output for complete years Dom. loads based on population number and factors for 2010 Diffuse sources based on TUBITAK data for 2009 no SS source Industrial loads based on permits (2011) Emission data applied for all RIBASIM years Data type Par.200320042005200620072008200920102011201220132014 monitoring COD54 5649732554 58476836 SS58 56558260554859586846 TN 33584746 TP 53585546 RIBASIM FLOWS model Domestic loads COD Factors SS Factors TN Factors TP Factors Diffuse sources TN TUBITAK TP TUBITAK Industrial loads COD permits SS permits TN permits TP permits
 Emission data applied for all RIBASIM years Data type Par monitoring COD SS TN TP RIBASIM FLOWS model Domestic loads COD Factors SS Factors TN Factors TP Factors Diffuse sources TN TUBITAK TP TUBITAK Industrial loads COD permits SS permits TN permits TP permits.")
13
7. Calibration process (1): 1.Hydrological analysis: Add flows per capita in RIBASIM Minimal outflow of Cine reservoir
: 1.Hydrological analysis: Add flows per capita in RIBASIM Minimal outflow of Cine reservoir.")
14
7. Calibration process (2): 2. Time dependent diffuse sources They come with the runoff of the land Peak in winter season

15
7. Calibration process (3): 3. Add decay: First order decay for TN, TP and COD (k =0.01 d -1 ) Related to residence time
 Related to residence time.")
16
7. Calibration process (4): 4. Add temperature: Decay is dependent on water temperature: k = k 20 * theta (T-20) with theta = 1.047
 with theta =")
17
5. Downstream near Soke

18
5. Downstream, near Nazilli

19
5. Downstream, near Nazilli (2) Effect of decay is minimal Overal TN to low underestimate loads?
 Effect of decay is minimal Overal TN to low underestimate loads")
20
5. Downstream of confluence Denizli trib.

21
5. Downstream of confluence Denizli trib. (2) Effect of decay is minimal COD loads missing
 Effect of decay is minimal COD loads missing")
22
5. Cindere reservoir

23
5. Banaz Creek

24
5. Banaz Creek (2) No effect of decay low residence time Big gap between simulated and modelled missing loads
 No effect of decay low residence time Big gap between simulated and modelled missing loads.")
25
5. Downstream Isikli lake

26
5. Model results (1): WQ and emissions Overall picture: COD: Industrial loads might not be complete. Actual industrial loads might be higher than permitted SS Model will underestimate SS load in most locations No SS from diffuse sources runoff TN, TP: Right order of magnitude Recommendations for future projects: Add SS to diffuse sources Re-asses the industrial loads
: WQ and emissions Overall picture: COD: Industrial loads might not be complete. Actual industrial loads might be higher than permitted SS Model will underestimate SS load in most locations No SS from diffuse sources runoff TN, TP: Right order of magnitude Recommendations for future projects: Add SS to diffuse sources Re-asses the industrial loads.")
27
Model results (2): Hydrology Hydrology: Reservoir operation will cause very low flow conditions Model seems to be very sensitive to low flow conditions resulting in high concentrations RIBASIM does not have effluent discharges of industries and WWTP/sewer systems Recommendations: Add industrial and WWTP/sewer discharges to the RIBASIM model Add more detail in catchment inflows (Onur is working on that one) Both recommendations are for future development!
: Hydrology Hydrology: Reservoir operation will cause very low flow conditions Model seems to be very sensitive to low flow conditions resulting in high concentrations RIBASIM does not have effluent discharges of industries and WWTP/sewer systems Recommendations: Add industrial and WWTP/sewer discharges to the RIBASIM model Add more detail in catchment inflows (Onur is working on that one) Both recommendations are for future development!")
28
Baseline - observation 8. Ecological Knowledge rules Ecological monitoring Species EQR WFD guidelines Report Ecological knowledge rule EQR =f(EKF) Ecological Key Factors WQ parameters Hydro-morphological Maintenance EQR ? Hindcast Future evaluation (scenario’s)
 Ecological Key Factors WQ parameters Hydro-morphological Maintenance EQR . Hindcast Future evaluation (scenario’s).")
29
8. Ecological model

33
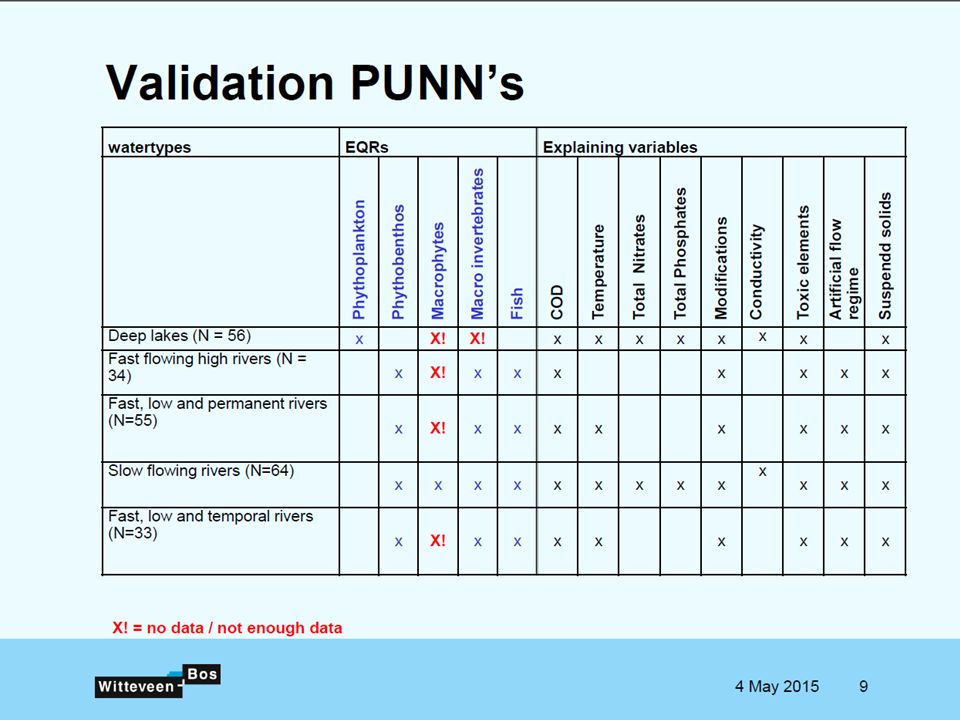
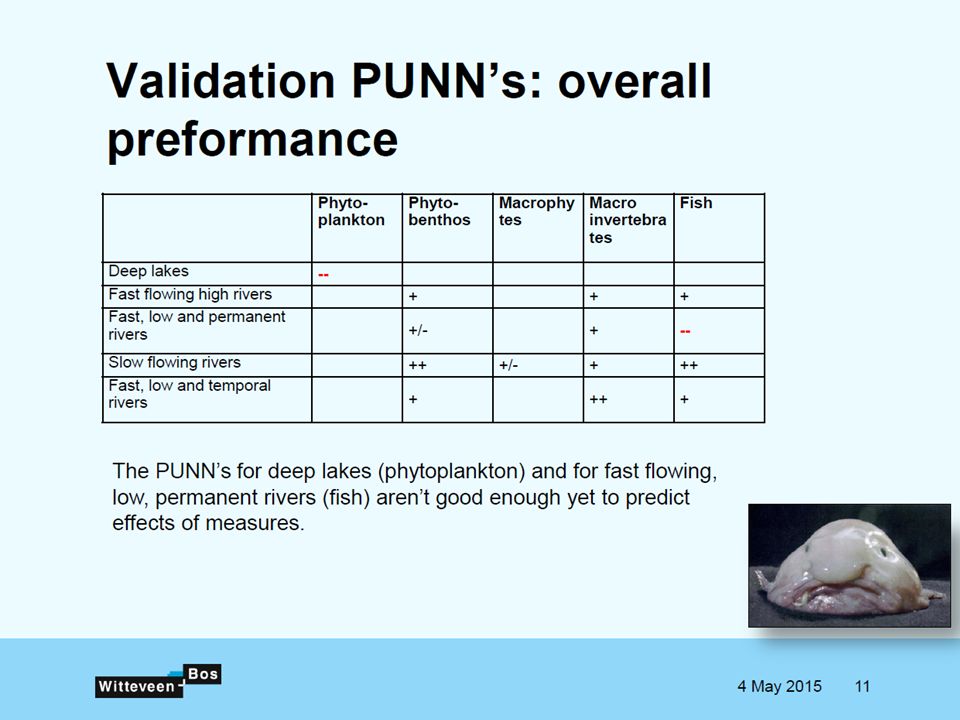
8. Ecological model (PUNN) Implemented in the WFD Explorer: More information on PUNN’s: Presentation M5 by Marieke Fennema, Witteveen+Bos
 Implemented in the WFD Explorer: More information on PUNN’s: Presentation M5 by Marieke Fennema, Witteveen+Bos.")
34
Use of the model in Stakeholder process Can we use the model yes it will give some answers regarding loads and the effect on the concentrations Does it give accurate results regarding concentrations? no Many uncertainties regarding load values and uncertainties in hydrology Taking measures yes Ecological measures can also be based on WQ data. The PUNN model can run stand-alone in WFD-Explorer interface Load reduction measures can also be applied. Relative change of concentrations is also very useful in the stakeholder process

35
TODO: USE of the model in practice Relative importance of different sources Taking measures during stakeholder process Tutorial document for setting up model, incl. screencasts.

Similar presentations


 WP2 – INTEGRATED CATCHMENT SIMULATOR.>")


 ------------------------------------------------------------------------------------------------------------------------------------------------>")