Download presentation
Presentation is loading. Please wait.

1
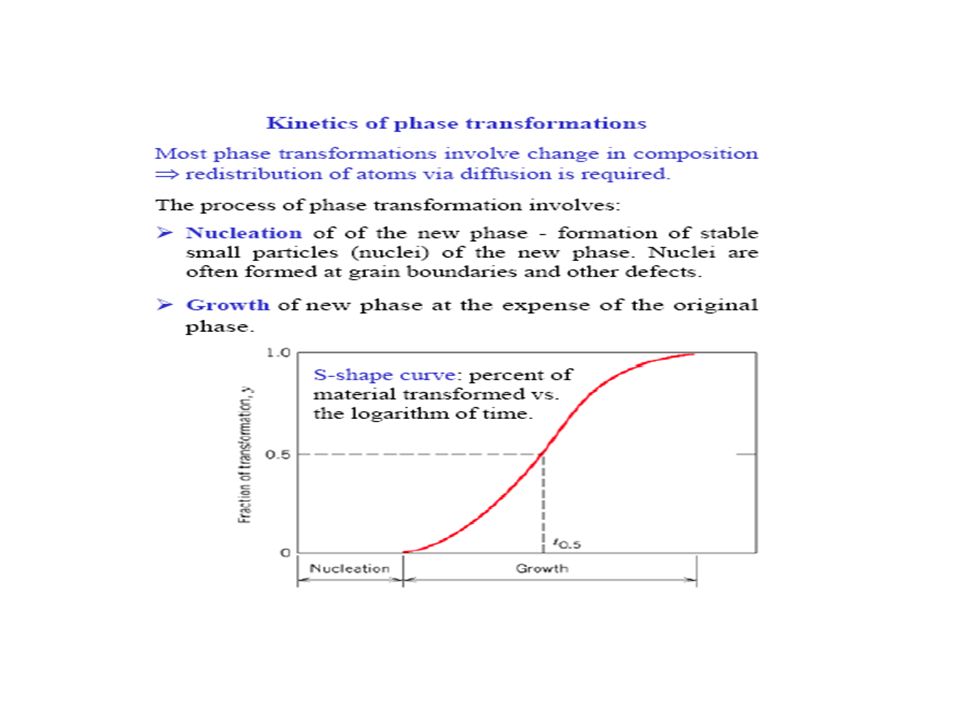
ISSUES TO ADDRESS... Transforming one phase into another takes time. How does the rate of transformation depend on time and T? 1 How can we slow down the transformation so that we can engineering non-equilibrium structures? Are the mechanical properties of non-equilibrium structures better? PHASE TRANSFORMATIONS

2
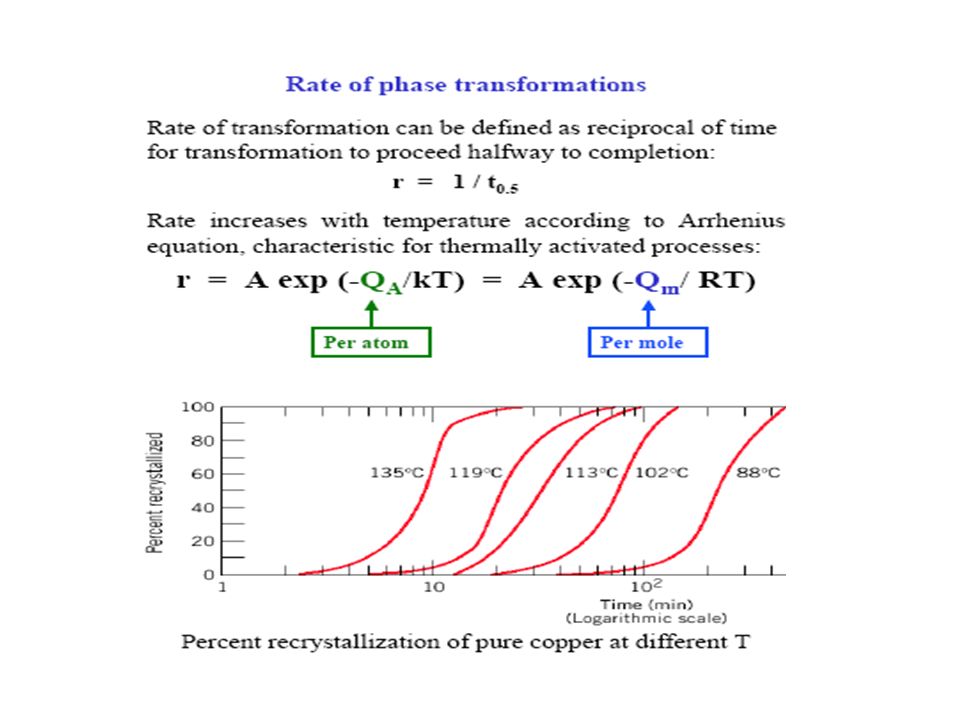
2 Fraction transformed depends on time. Transformation rate depends on T. r often small: equil not possible! Adapted from Fig. 10.1, Callister 6e. Adapted from Fig. 10.2, Callister 6e. (Fig. 10.2 adapted from B.F. Decker and D. Harker, "Recrystallization in Rolled Copper", Trans AIME, 188, 1950, p. 888.) FRACTION OF TRANSFORMATION
 FRACTION OF TRANSFORMATION.")
3
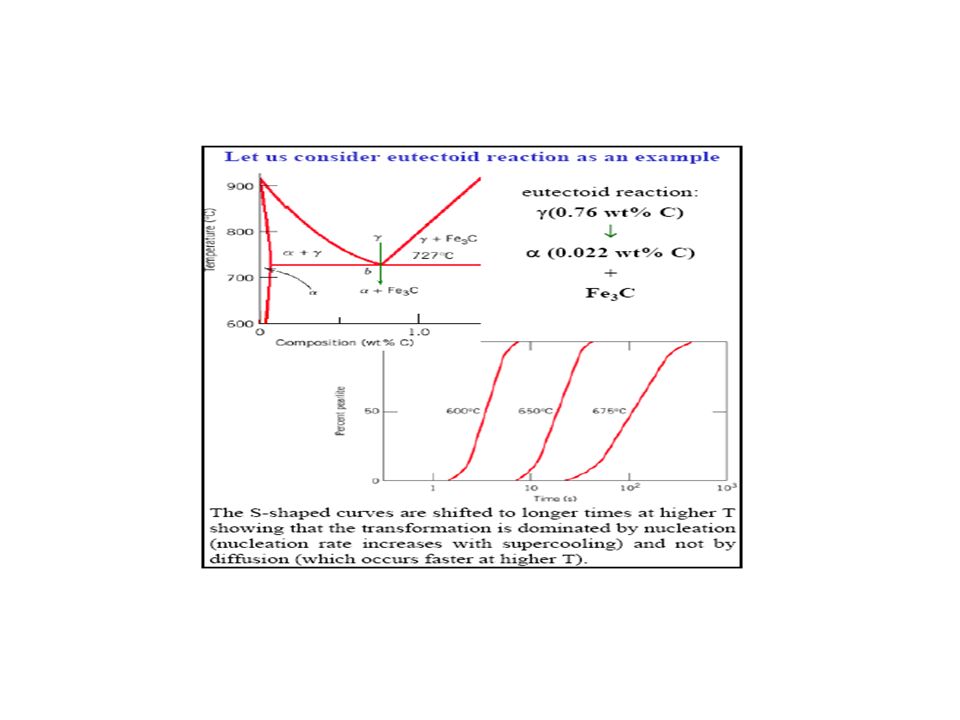
33 Adapted from Fig. 9.21,Callister 6e. (Fig. 9.21 adapted from Binary Alloy Phase Diagrams, 2nd ed., Vol. 1, T.B. Massalski (Ed.-in-Chief), ASM International, Materials Park, OH, 1990.) TRANSFORMATIONS & UNDERCOOLING
, ASM International, Materials Park, OH, 1990.) TRANSFORMATIONS & UNDERCOOLING.")
4
4 Growth of pearlite from austenite: Reaction rate increases with T. Adapted from Fig. 9.13, Callister 6e. Adapted from Fig. 10.3, Callister 6e. EUTECTOID TRANSFORMATION RATE ~ T

5
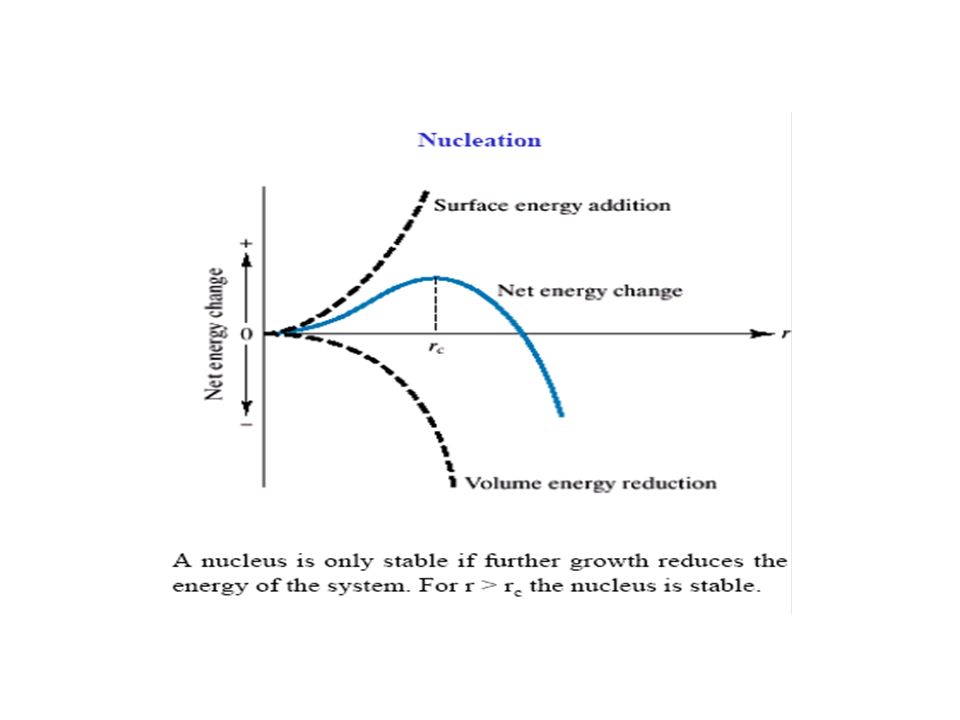
5 Reaction rate is a result of nucleation and growth of crystals. Examples: Adapted from Fig. 10.1, Callister 6e. NUCLEATION AND GROWTH

13
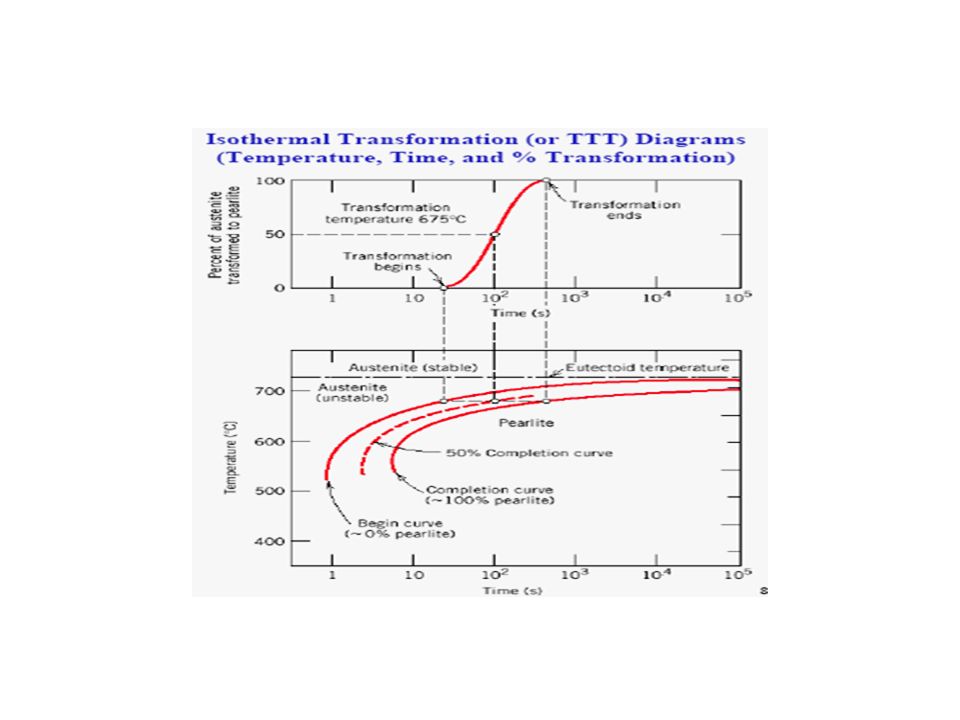
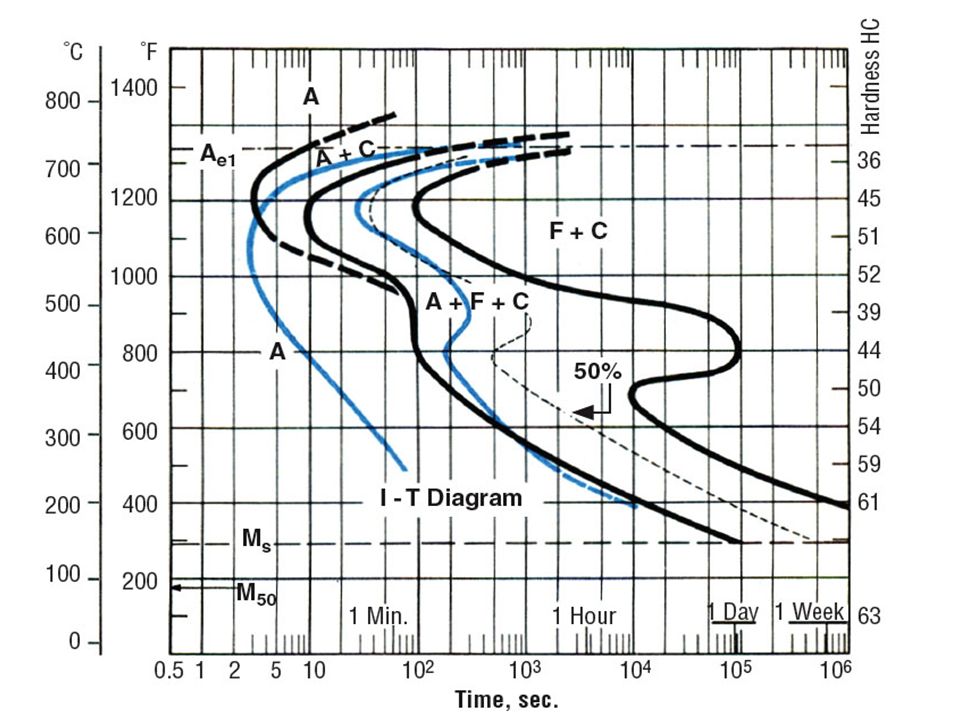
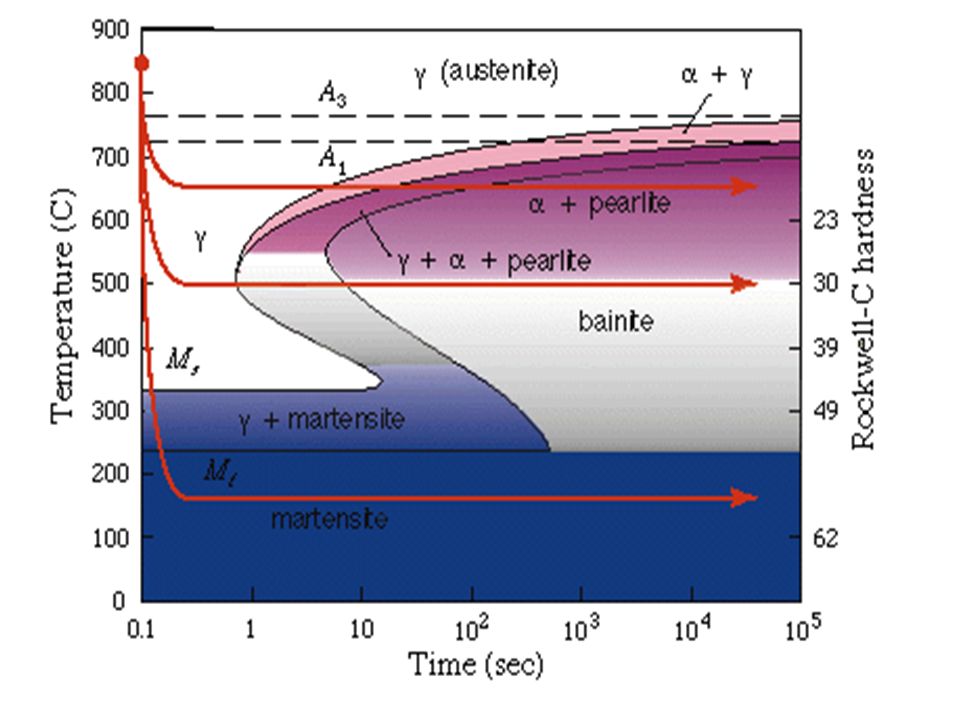
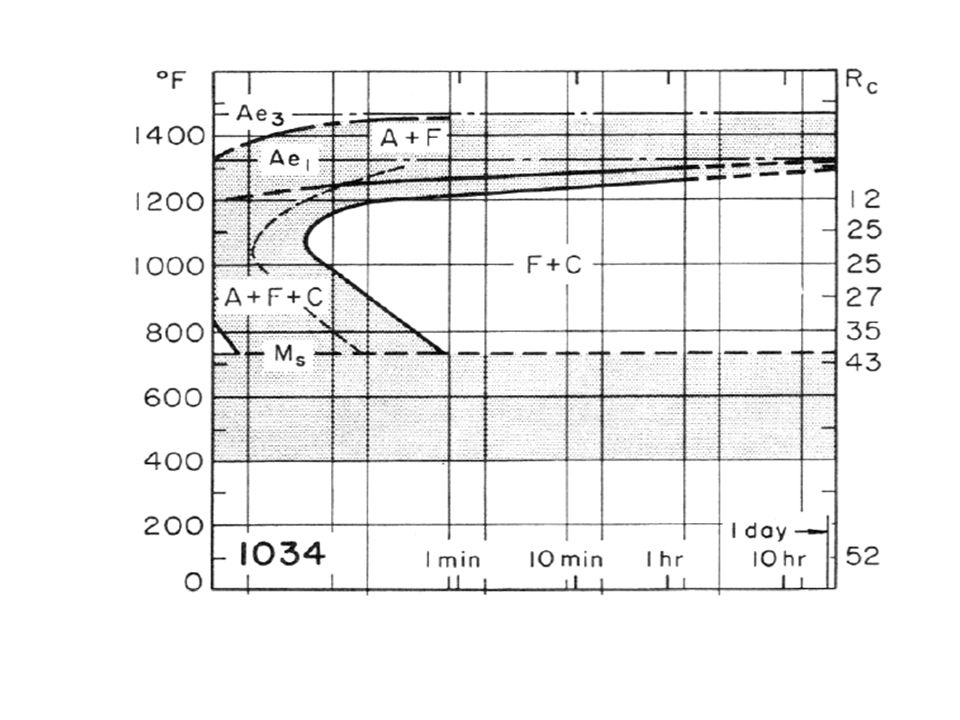
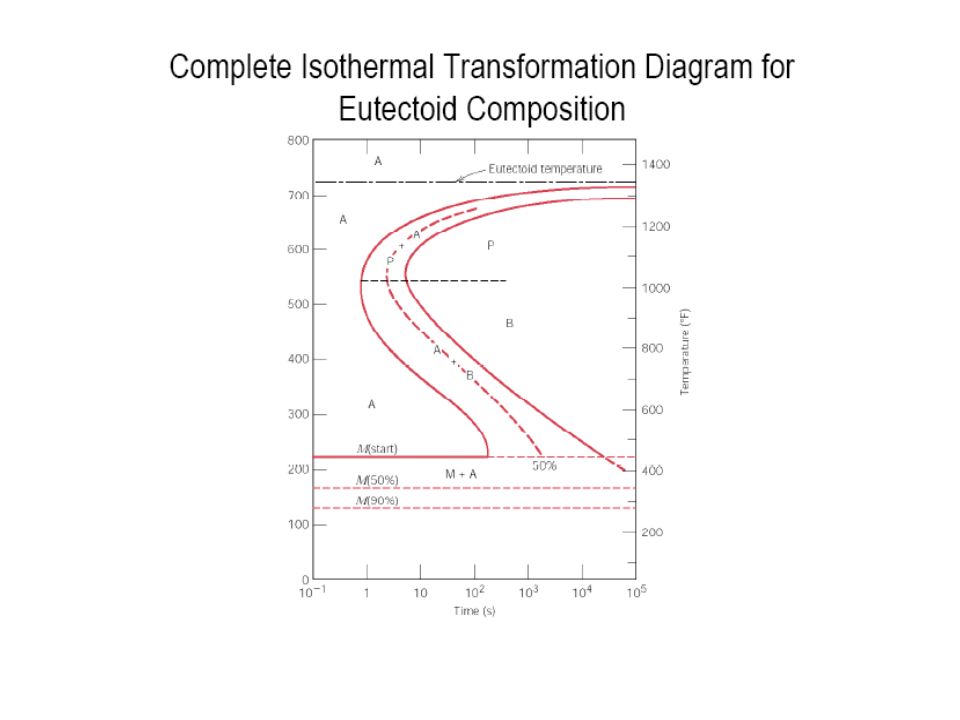
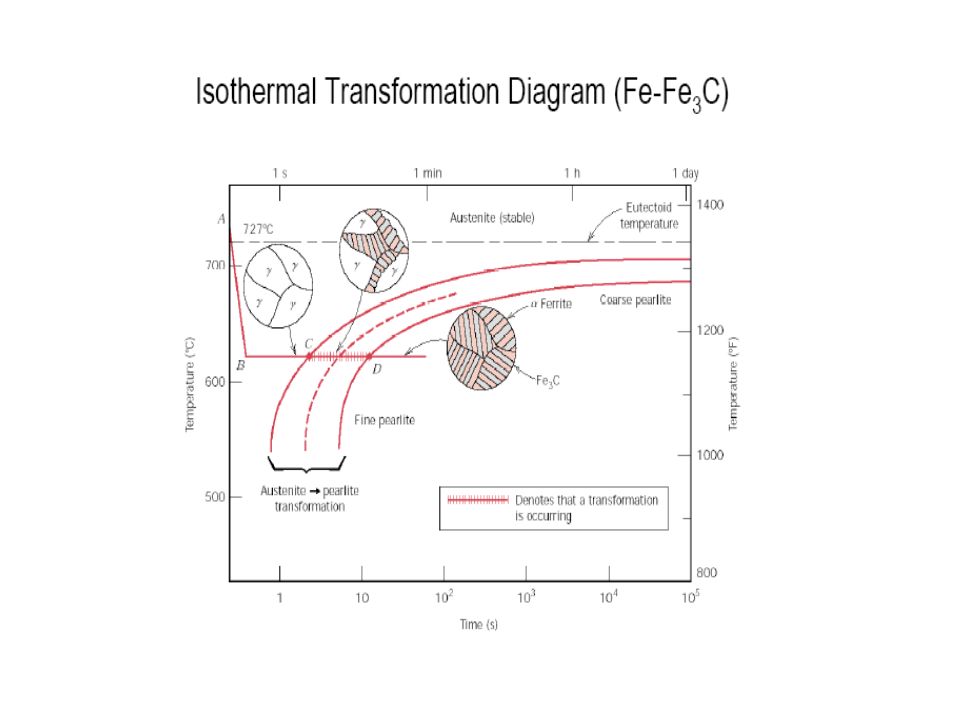
6 Fe-C system, C o = 0.77wt%C Transformation at T = 675C. Adapted from Fig. 10.4,Callister 6e. (Fig. 10.4 adapted from H. Boyer (Ed.) Atlas of Isothermal Transformation and Cooling Transformation Diagrams, American Society for Metals, 1977, p. 369.) ISOTHERMAL TRANSFORMATION DIAGRAMS
 Atlas of Isothermal Transformation and Cooling Transformation Diagrams, American Society for Metals, 1977, p. 369.) ISOTHERMAL TRANSFORMATION DIAGRAMS.")
14
7 Eutectoid composition, C o = 0.77wt%C Begin at T > 727C Rapidly cool to 625C and hold isothermally. Adapted from Fig. 10.5,Callister 6e. (Fig. 10.5 adapted from H. Boyer (Ed.) Atlas of Isothermal Transformation and Cooling Transformation Diagrams, American Society for Metals, 1997, p. 28.) EX: COOLING HISTORY Fe-C SYSTEM
 Atlas of Isothermal Transformation and Cooling Transformation Diagrams, American Society for Metals, 1997, p. 28.) EX: COOLING HISTORY Fe-C SYSTEM.")
15
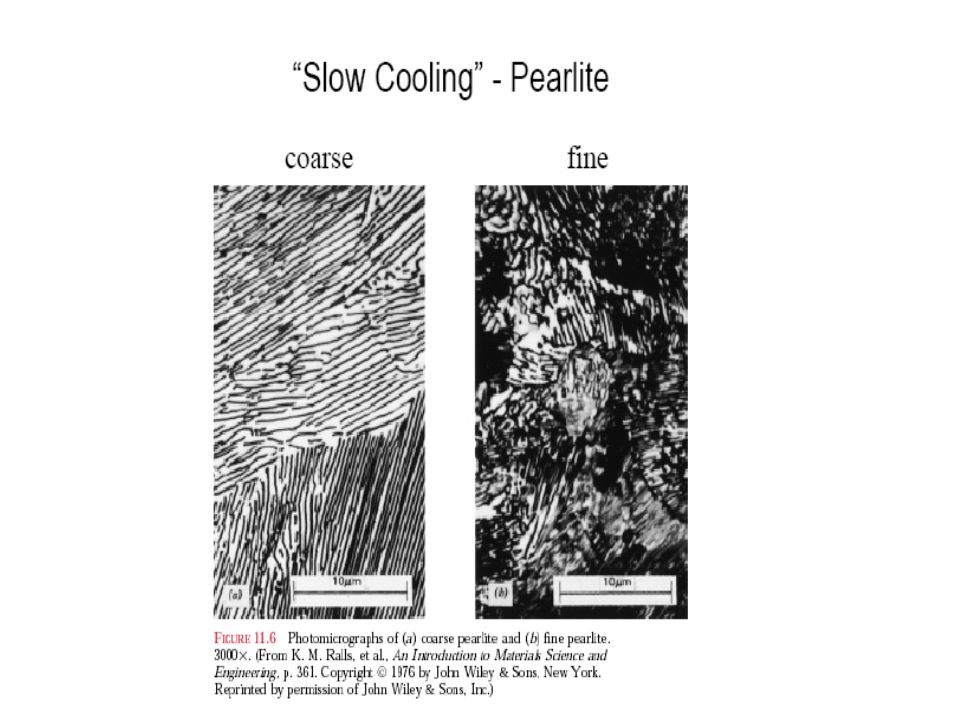
8 T transf just below T E --Larger T: diffusion is faster --Pearlite is coarser. Two cases: T transf well below T E --Smaller T: diffusion is slower --Pearlite is finer. Adapted from Fig. 10.6 (a) and (b),Callister 6e. (Fig. 10.6 from R.M. Ralls et al., An Introduction to Materials Science and Engineering, p. 361, John Wiley and Sons, Inc., New York, 1976.) PEARLITE MORPHOLOGY
 and (b),Callister 6e. (Fig from R.M. Ralls et al., An Introduction to Materials Science and Engineering, p. 361, John Wiley and Sons, Inc., New York, 1976.) PEARLITE MORPHOLOGY.")
16
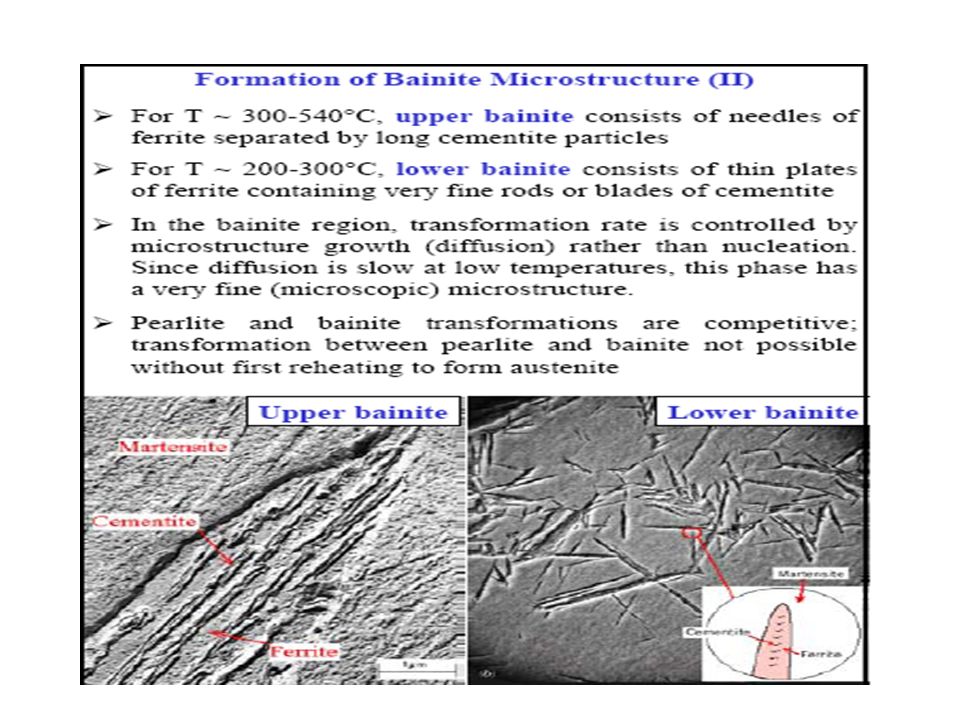
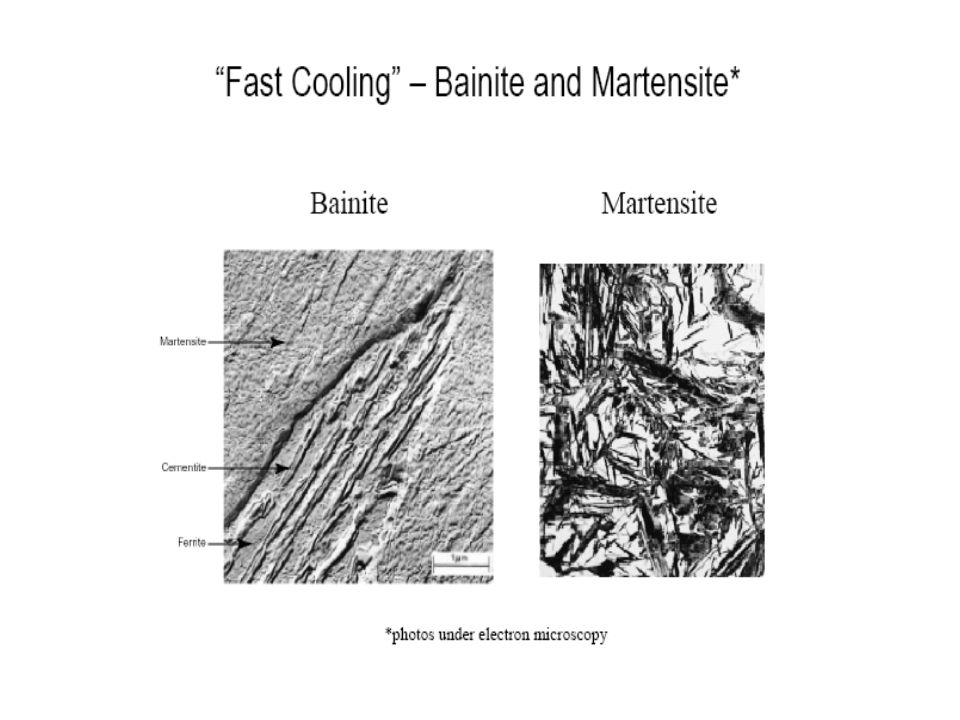
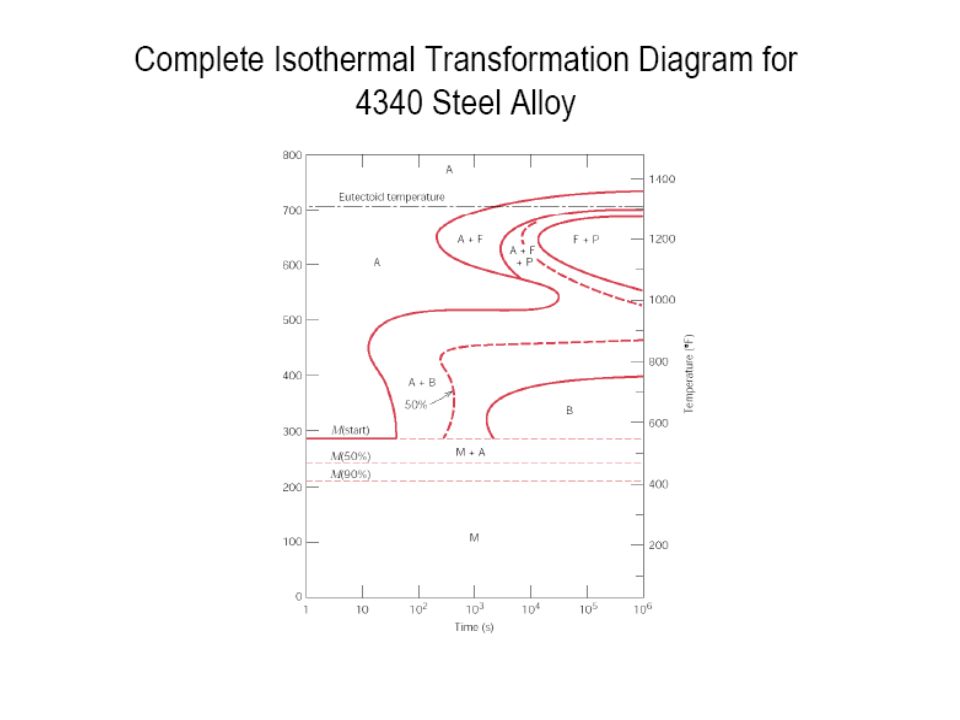
9 Bainite: -- lathes (strips) with long rods of Fe 3 C --diffusion controlled. Isothermal Transf. Diagram Adapted from Fig. 10.9,Callister 6e. (Fig. 10.9 adapted from H. Boyer (Ed.) Atlas of Isothermal Transformation and Cooling Transformation Diagrams, American Society for Metals, 1997, p. 28.) (Adapted from Fig. 10.8, Callister, 6e. (Fig. 10.8 from Metals Handbook, 8th ed., Vol. 8, Metallography, Structures, and Phase Diagrams, American Society for Metals, Materials Park, OH, 1973.) NON-EQUIL TRANSFORMATION PRODUCTS: Fe-C
 Atlas of Isothermal Transformation and Cooling Transformation Diagrams, American Society for Metals, 1997, p. 28.) (Adapted from Fig. 10.8, Callister, 6e. (Fig from Metals Handbook, 8th ed., Vol. 8, Metallography, Structures, and Phase Diagrams, American Society for Metals, Materials Park, OH, 1973.) NON-EQUIL TRANSFORMATION PRODUCTS: Fe-C.")
17
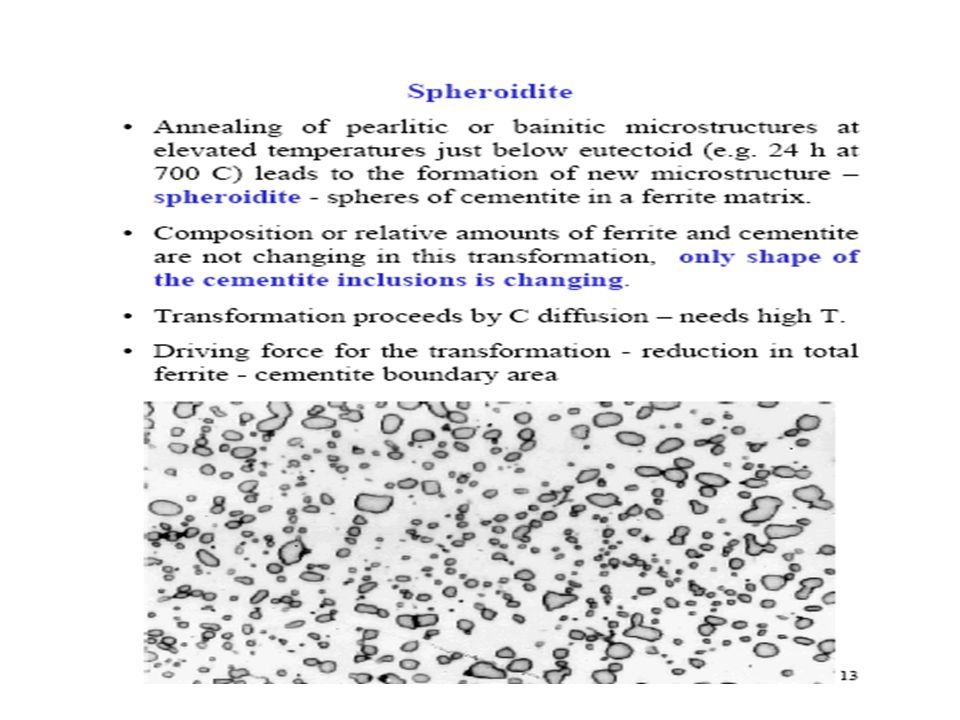
10 Spheroidite: -- crystals with spherical Fe 3 C --diffusion dependent. --heat bainite or pearlite for long times --reduces interfacial area (driving force) Isothermal Transf. Diagram Adapted from Fig. 10.9,Callister 6e. (Fig. 10.9 adapted from H. Boyer (Ed.) Atlas of Isothermal Transformation and Cooling Transformation Diagrams, American Society for Metals, 1997, p. 28.) (Adapted from Fig. 10.10, Callister, 6e. (Fig. 10.10 copyright United States Steel Corporation, 1971.) OTHER PRODUCTS: Fe-C SYSTEM (1)
 Isothermal Transf. Diagram Adapted from Fig. 10.9,Callister 6e. (Fig adapted from H. Boyer (Ed.) Atlas of Isothermal Transformation and Cooling Transformation Diagrams, American Society for Metals, 1997, p. 28.) (Adapted from Fig , Callister, 6e. (Fig copyright United States Steel Corporation, 1971.) OTHER PRODUCTS: Fe-C SYSTEM (1).")
18
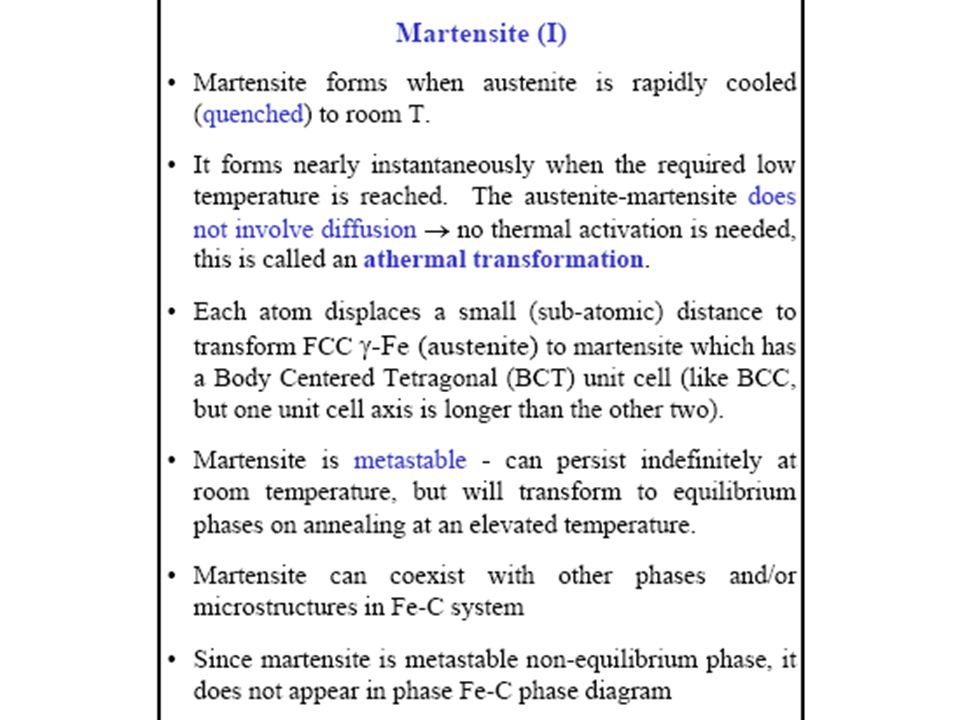
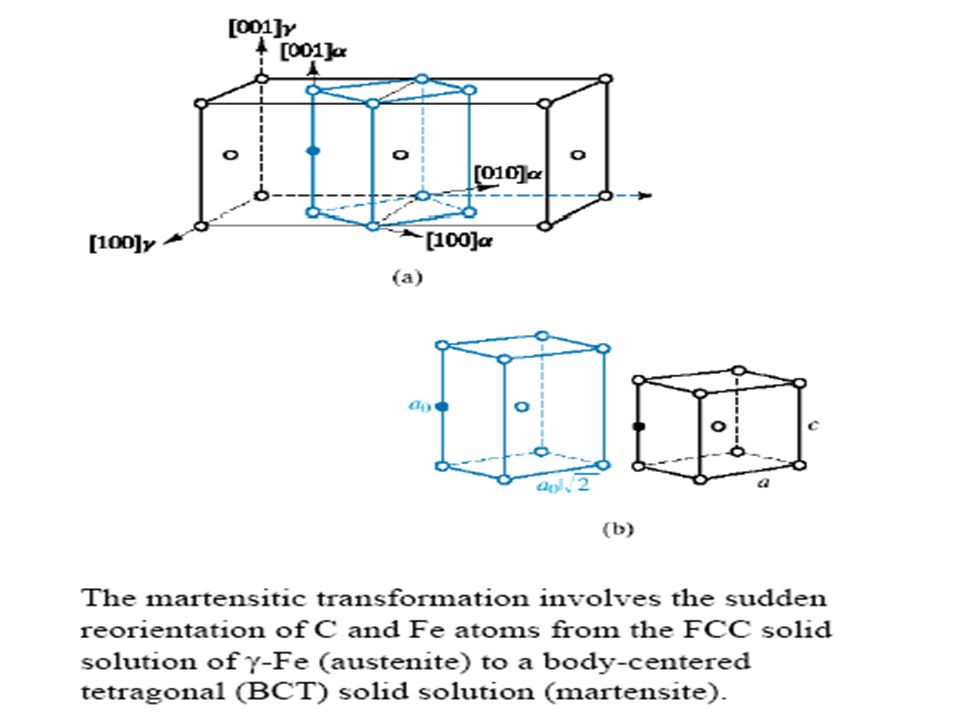
11 Martensite: -- (FCC) to Martensite (BCT) Adapted from Fig. 10.13, Callister 6e. (Adapted from Fig. 10.12, Callister, 6e. (Fig. 10.12 courtesy United States Steel Corporation.) Isothermal Transf. Diagram to M transformation.. -- is rapid! -- % transf. depends on T only. (Adapted from Fig. 10.11, Callister, 6e. OTHER PRODUCTS: Fe-C SYSTEM (2)
 Isothermal Transf. Diagram to M transformation.. -- is rapid. -- % transf. depends on T only. (Adapted from Fig , Callister, 6e. OTHER PRODUCTS: Fe-C SYSTEM (2).")
19
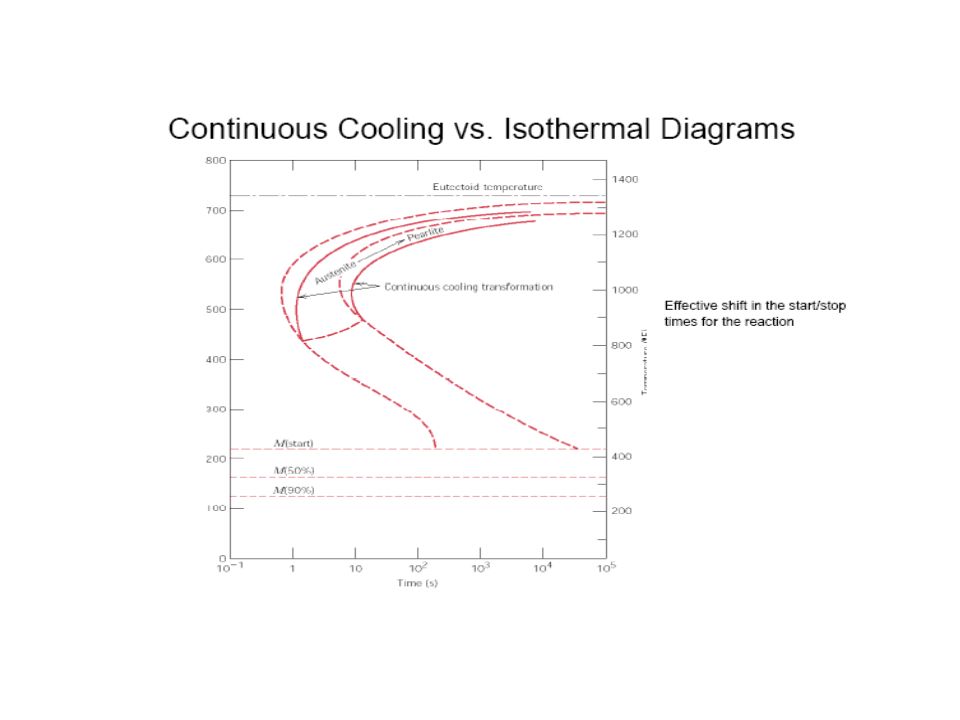
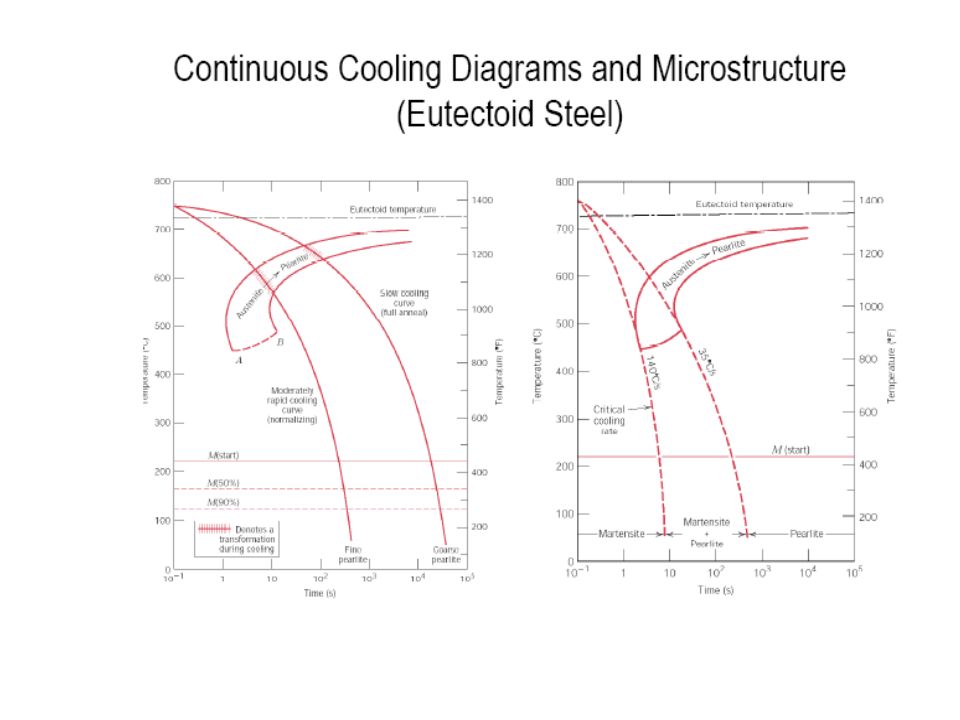
12 Adapted from Fig. 10.15, Callister 6e. COOLING EX: Fe-C SYSTEM (1)
")
20
13 Adapted from Fig. 10.15, Callister 6e. COOLING EX: Fe-C SYSTEM (2)
")
21
14 Adapted from Fig. 10.15, Callister 6e. COOLING EX: Fe-C SYSTEM (3)
")
22
15 Adapted from Fig. 10.20, Callister 6e. (Fig. 10.20 based on data from Metals Handbook: Heat Treating, Vol. 4, 9th ed., V. Masseria (Managing Ed.), American Society for Metals, 1981, p. 9.) Adapted from Fig. 9.27,Callister 6e. (Fig. 9.27 courtesy Republic Steel Corporation.) Adapted from Fig. 9.30,Callister 6e. (Fig. 9.30 copyright 1971 by United States Steel Corporation.) MECHANICAL PROP: Fe-C SYSTEM (1)
, American Society for Metals, 1981, p. 9.) Adapted from Fig. 9.27,Callister 6e. (Fig courtesy Republic Steel Corporation.) Adapted from Fig. 9.30,Callister 6e. (Fig copyright 1971 by United States Steel Corporation.) MECHANICAL PROP: Fe-C SYSTEM (1).")
23
16 Adapted from Fig. 10.21, Callister 6e. (Fig. 10.21 based on data from Metals Handbook: Heat Treating, Vol. 4, 9th ed., V. Masseria (Managing Ed.), American Society for Metals, 1981, pp. 9 and 17.) MECHANICAL PROP: Fe-C SYSTEM (2)
, American Society for Metals, 1981, pp. 9 and 17.) MECHANICAL PROP: Fe-C SYSTEM (2).")
24
17 Fine Pearlite vs Martensite: Hardness: fine pearlite << martensite. Adapted from Fig. 10.23, Callister 6e. (Fig. 10.23 adapted from Edgar C. Bain, Functions of the Alloying Elements in Steel, American Society for Metals, 1939, p. 36; and R.A. Grange, C.R. Hribal, and L.F. Porter, Metall. Trans. A, Vol. 8A, p. 1776.) MECHANICAL PROP: Fe-C SYSTEM (3)
 MECHANICAL PROP: Fe-C SYSTEM (3).")
25
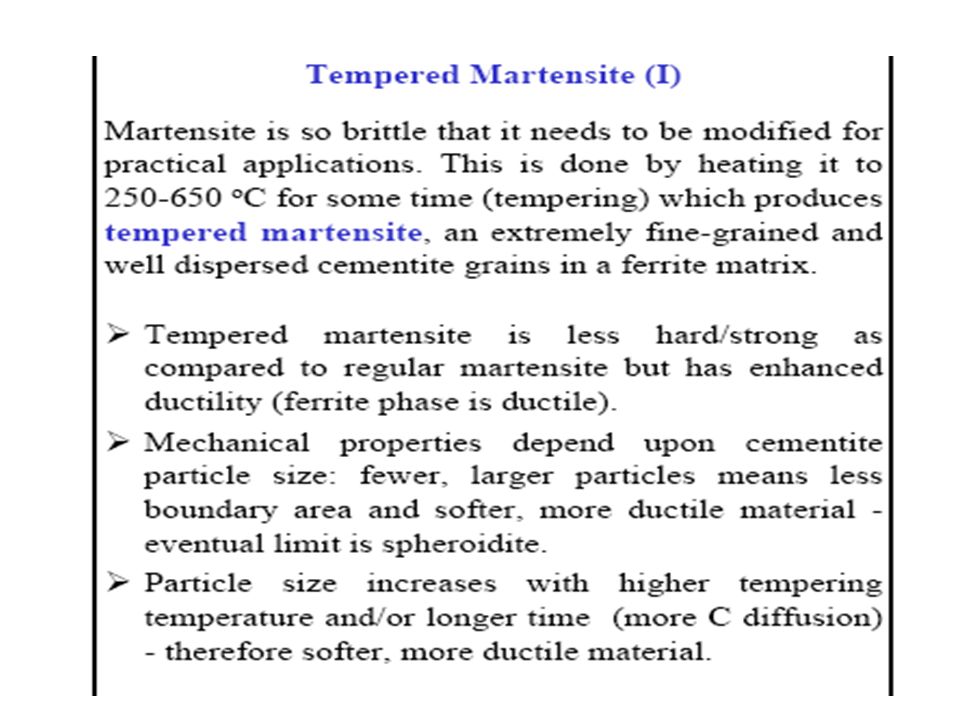
18 reduces brittleness of martensite, reduces internal stress caused by quenching. Adapted from Fig. 10.24, Callister 6e. (Fig. 10.24 copyright by United States Steel Corporation, 1971.) Adapted from Fig. 10.25, Callister 6e. (Fig. 10.25 adapted from Fig. furnished courtesy of Republic Steel Corporation.) TEMPERING MARTENSITE
 Adapted from Fig , Callister 6e. (Fig adapted from Fig. furnished courtesy of Republic Steel Corporation.) TEMPERING MARTENSITE.")
26
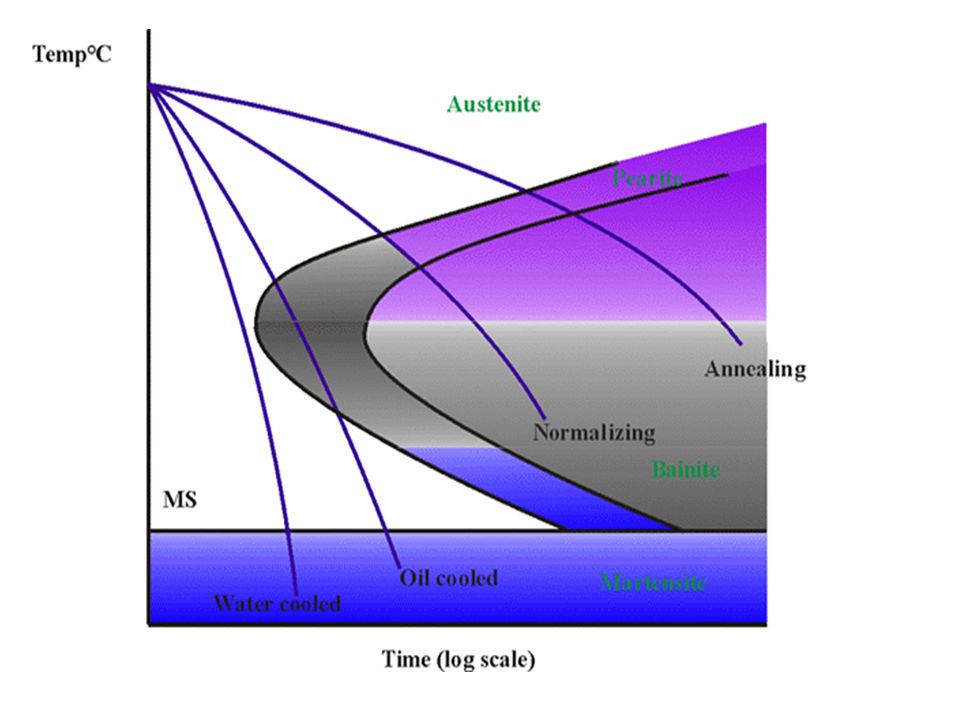
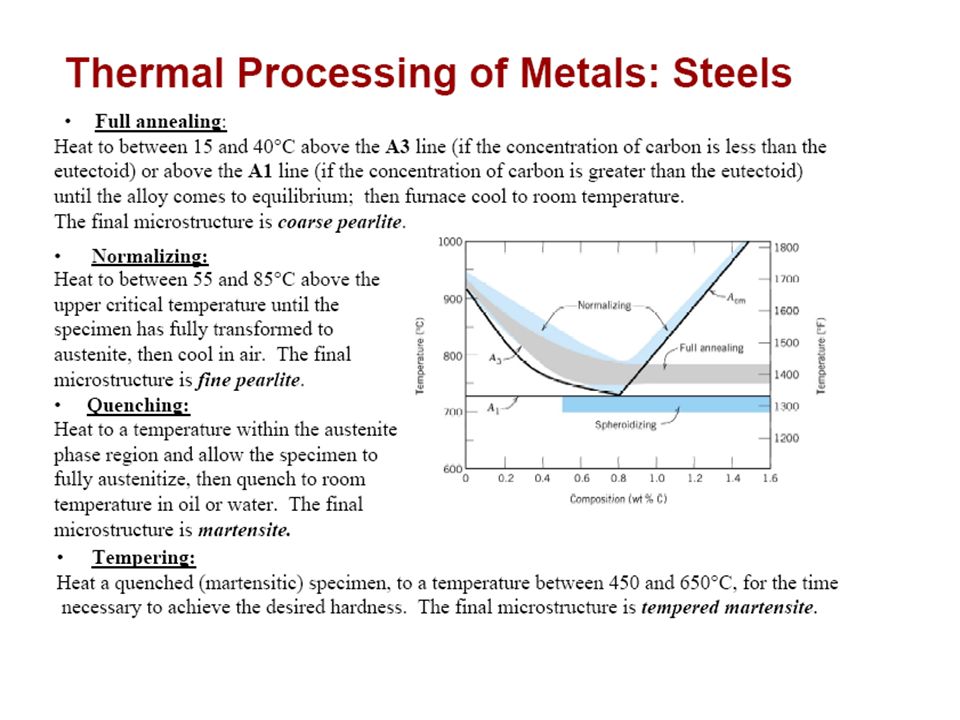
19 Adapted from Fig. 10.27, Callister 6e. SUMMARY: PROCESSING OPTIONS

47
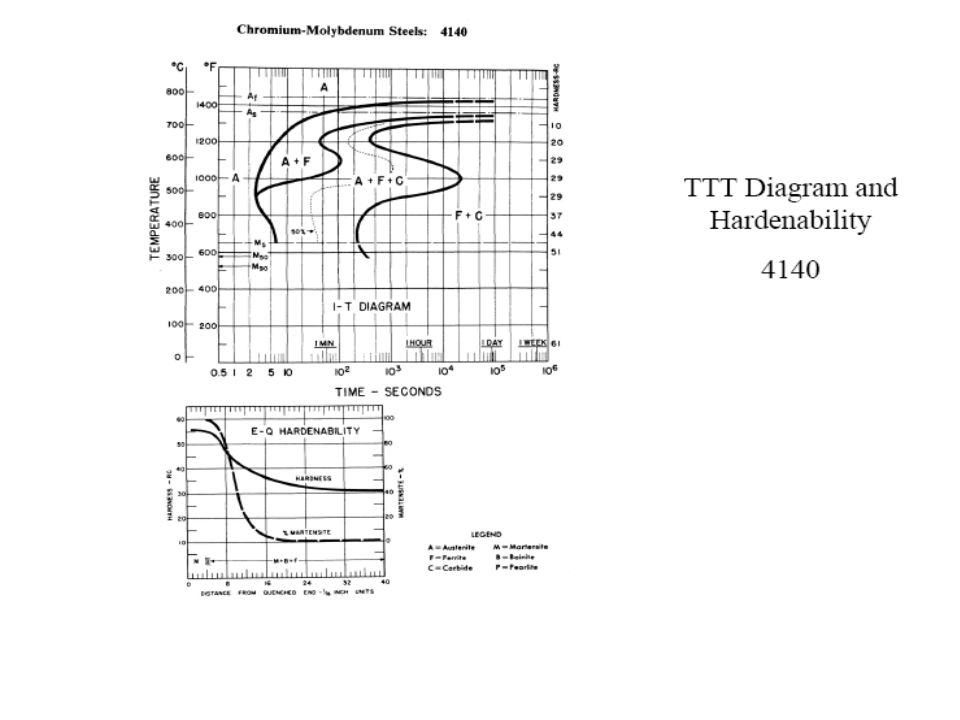
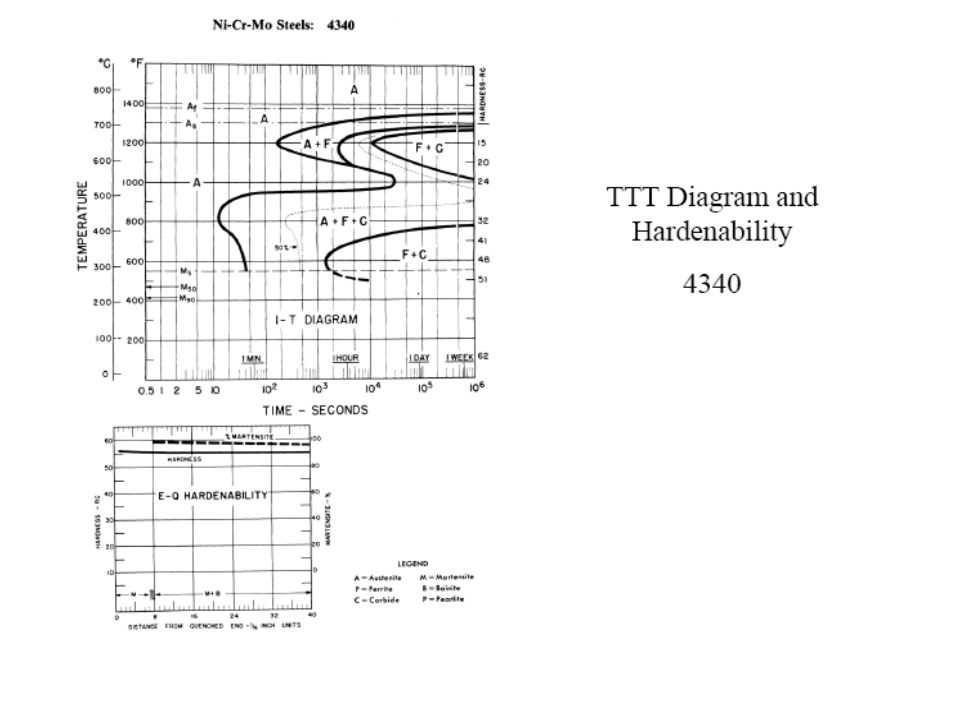
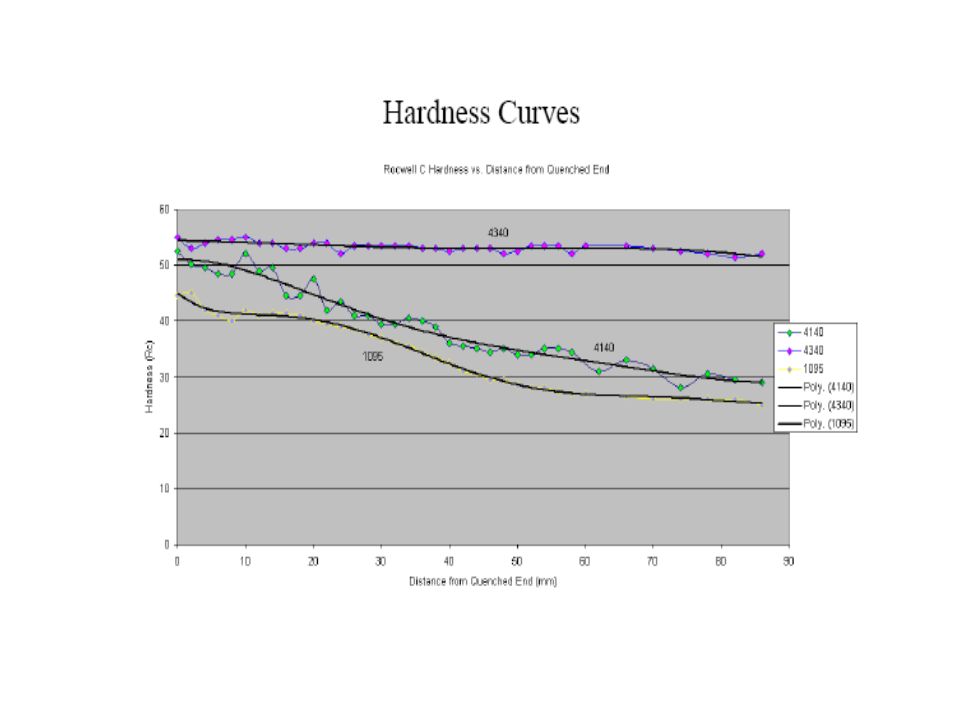
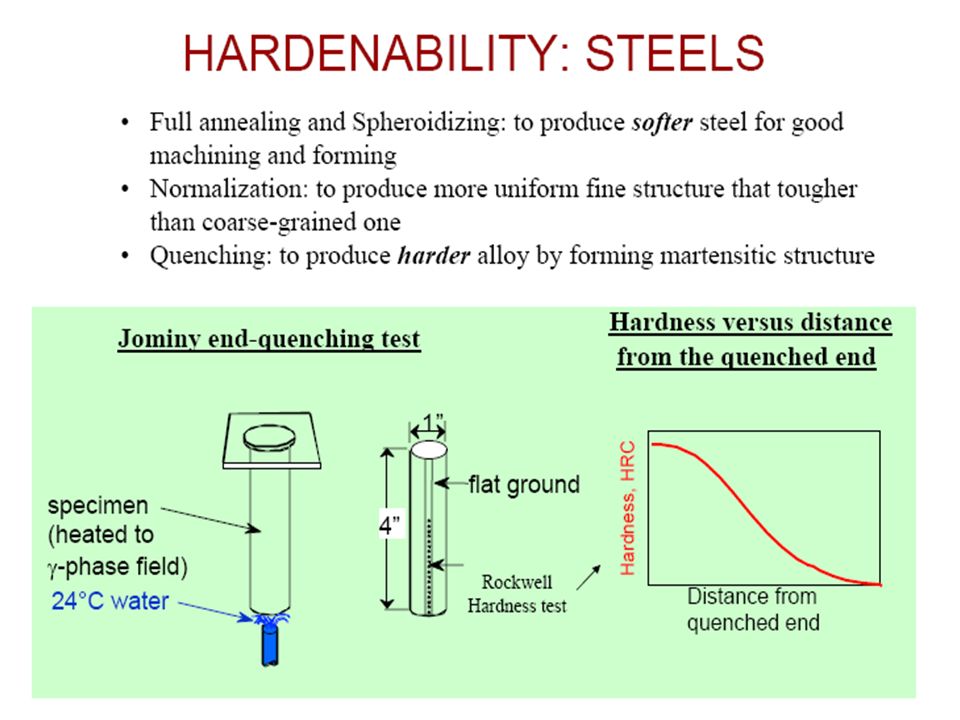
8 Ability to form martensite Jominy end quench test to measure hardenability. Hardness versus distance from the quenched end. Adapted from Fig. 11.10, Callister 6e. (Fig. 11.10 adapted from A.G. Guy, Essentials of Materials Science, McGraw-Hill Book Company, New York, 1978.) Adapted from Fig. 11.11, Callister 6e. HARDENABILITY--STEELS
 Adapted from Fig , Callister 6e. HARDENABILITY--STEELS.")
48
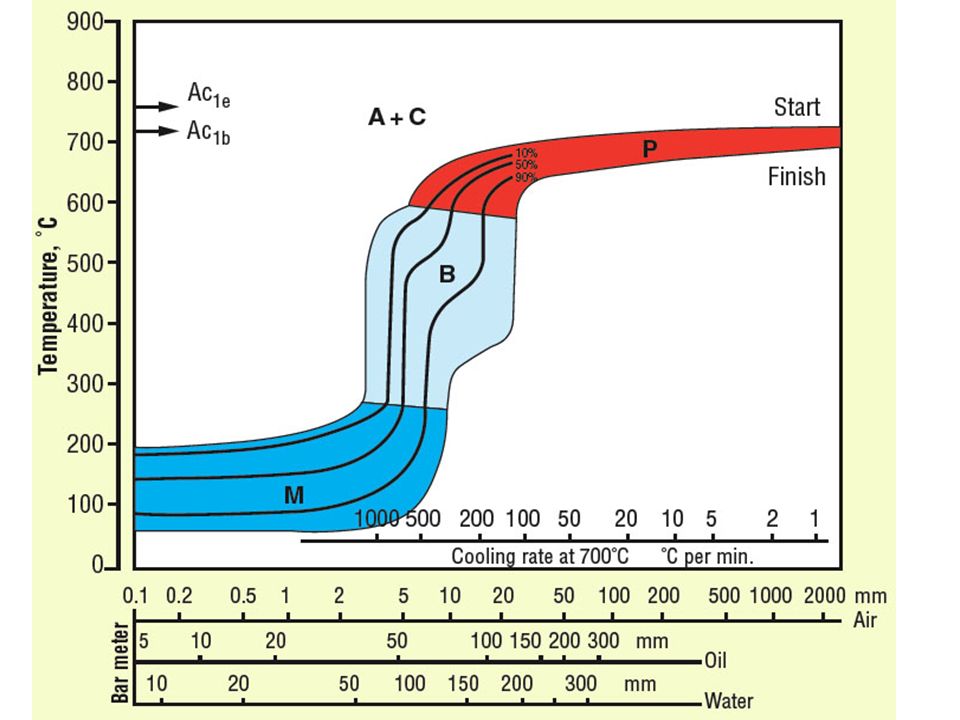
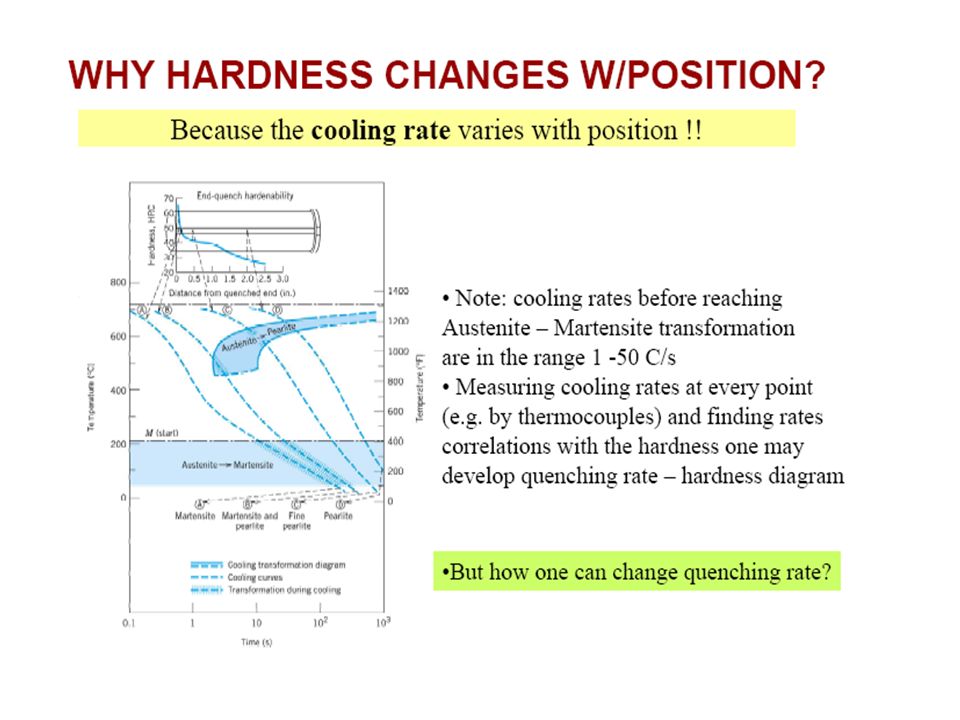
9 The cooling rate varies with position. Adapted from Fig. 11.12, Callister 6e. (Fig. 11.12 adapted from H. Boyer (Ed.) Atlas of Isothermal Transformation and Cooling Transformation Diagrams, American Society for Metals, 1977, p. 376.) WHY HARDNESS CHANGES W/ POSITION
 Atlas of Isothermal Transformation and Cooling Transformation Diagrams, American Society for Metals, 1977, p. 376.) WHY HARDNESS CHANGES W/ POSITION.")
49
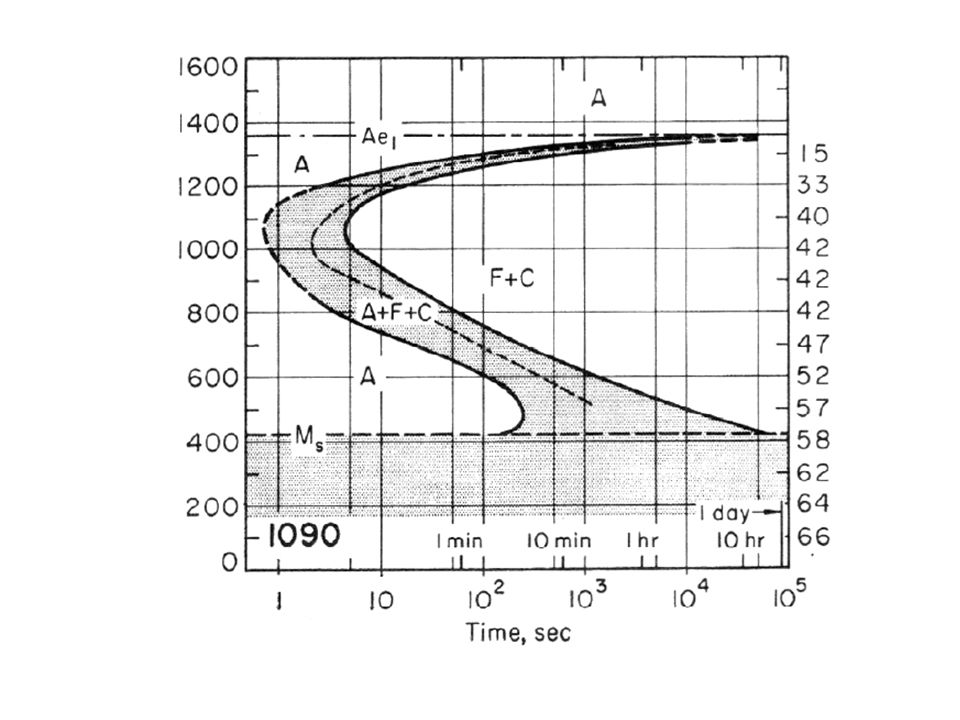
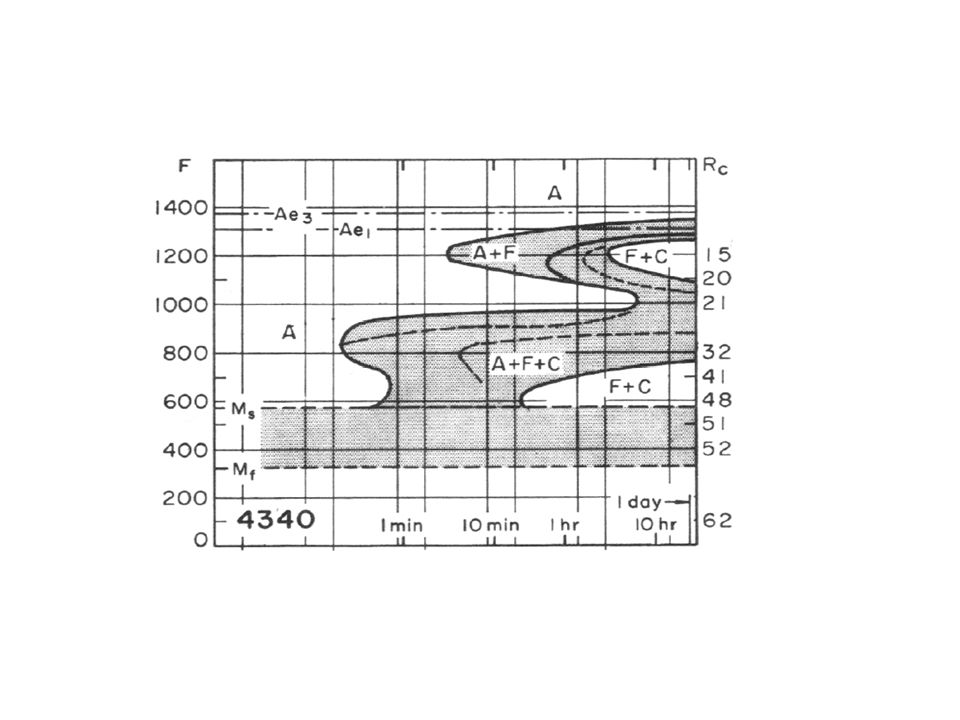
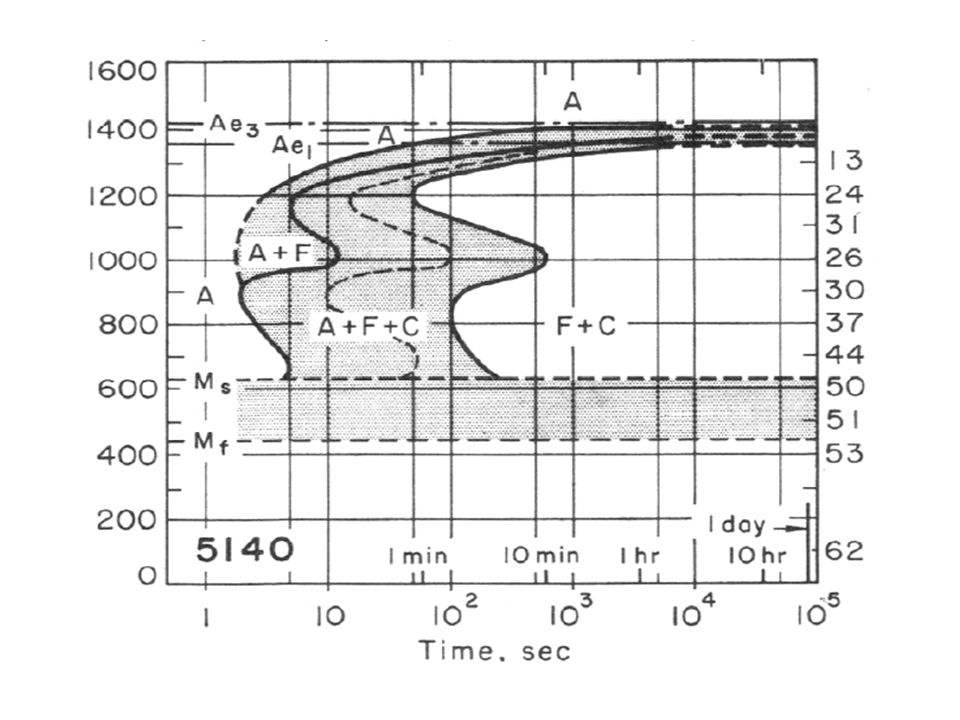
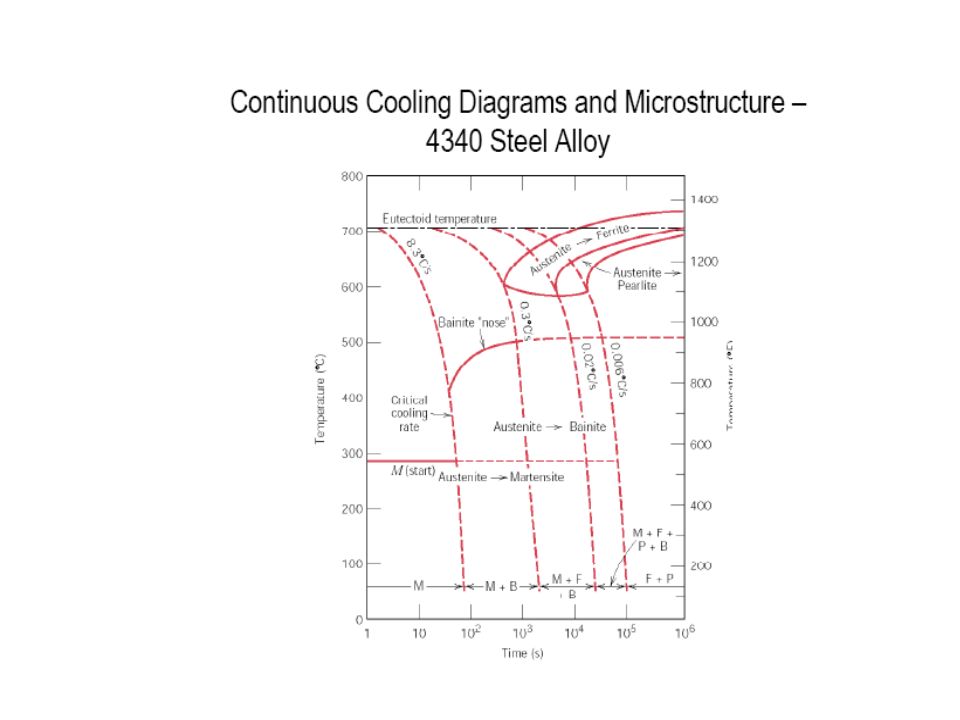
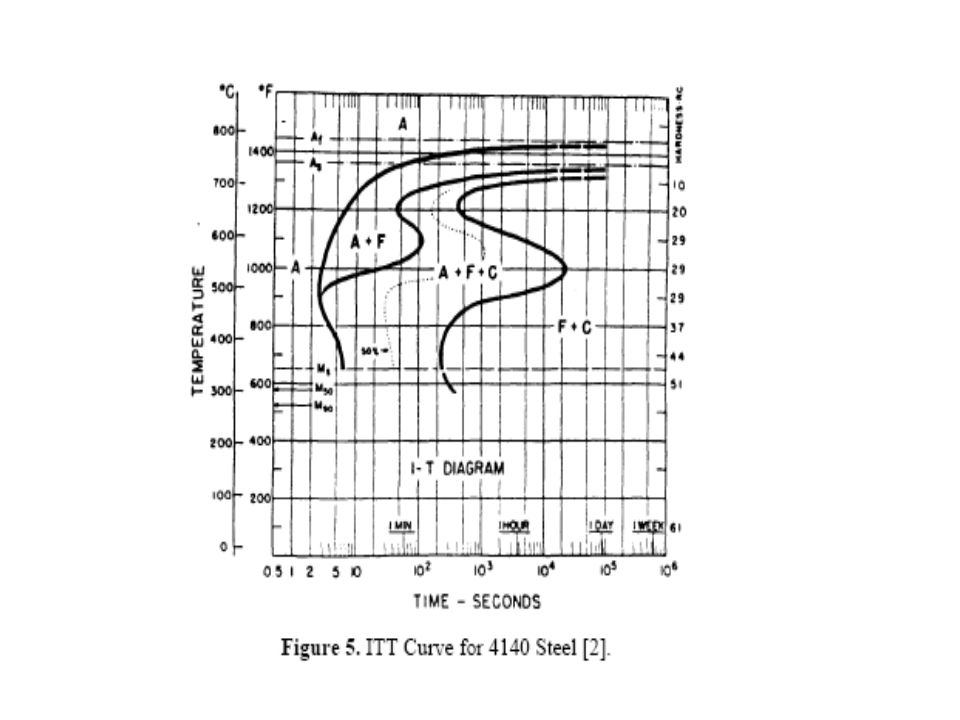
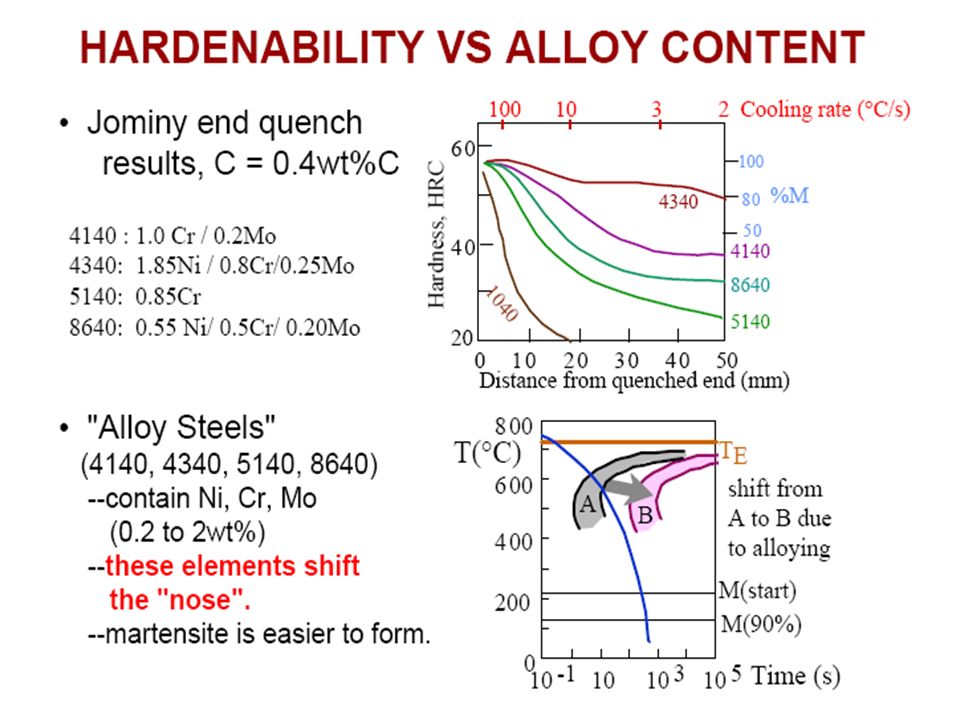
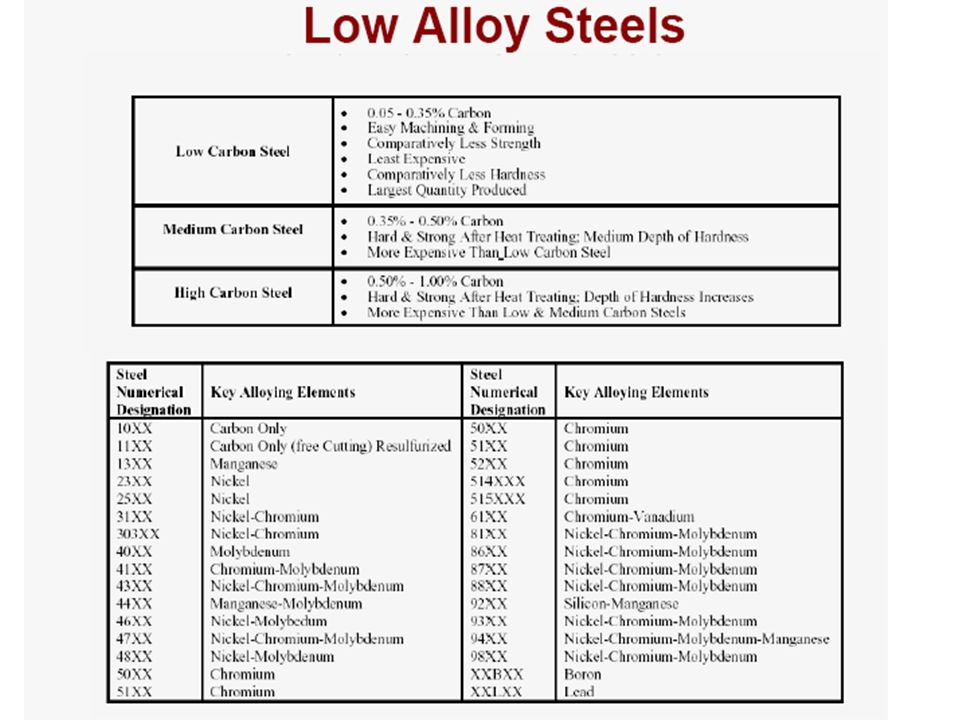
13 Jominy end quench results, C = 0.4wt%C "Alloy Steels" (4140, 4340, 5140, 8640) --contain Ni, Cr, Mo (0.2 to 2wt%) --these elements shift the "nose". --martensite is easier to form. Adapted from Fig. 11.13, Callister 6e. (Fig. 11.13 adapted from figure furnished courtesy Republic Steel Corporation.) HARDENABILITY VS ALLOY CONTENT
 HARDENABILITY VS ALLOY CONTENT.")
50
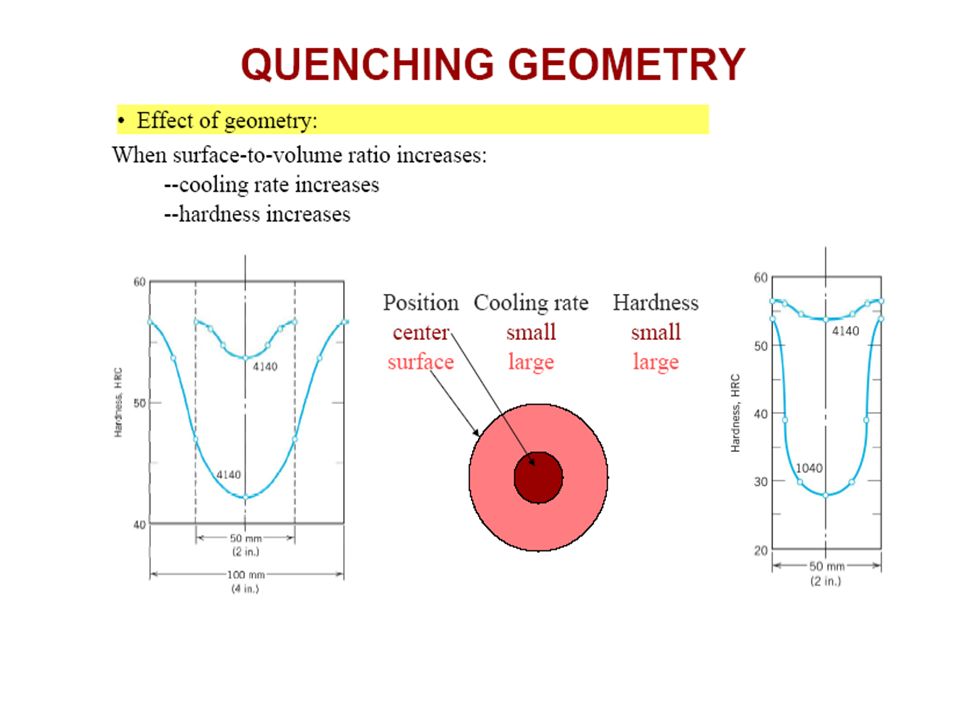
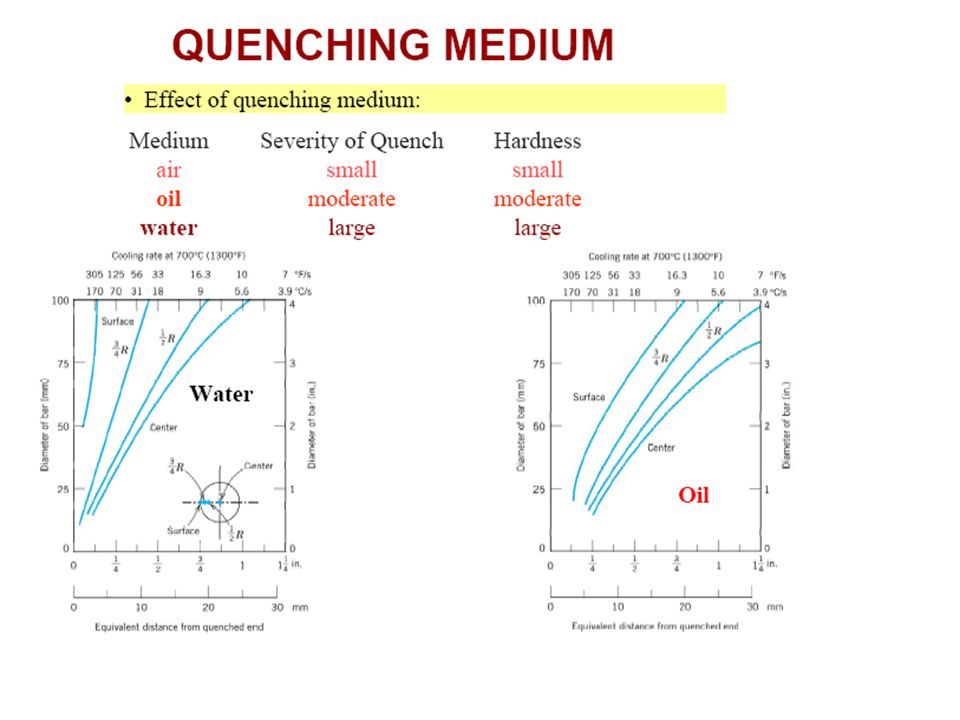
11 Effect of quenching medium: Medium air oil water Severity of Quench small moderate large Hardness small moderate large Effect of geometry: When surface-to-volume ratio increases: --cooling rate increases --hardness increases Position center surface Cooling rate small large Hardness small large QUENCHING MEDIUM & GEOMETRY

51
12 Ex: Round bar, 1040 steel, water quenched, 2" diam. Adapted from Fig. 11.18, Callister 6e. PREDICTING HARDNESS PROFILES

68
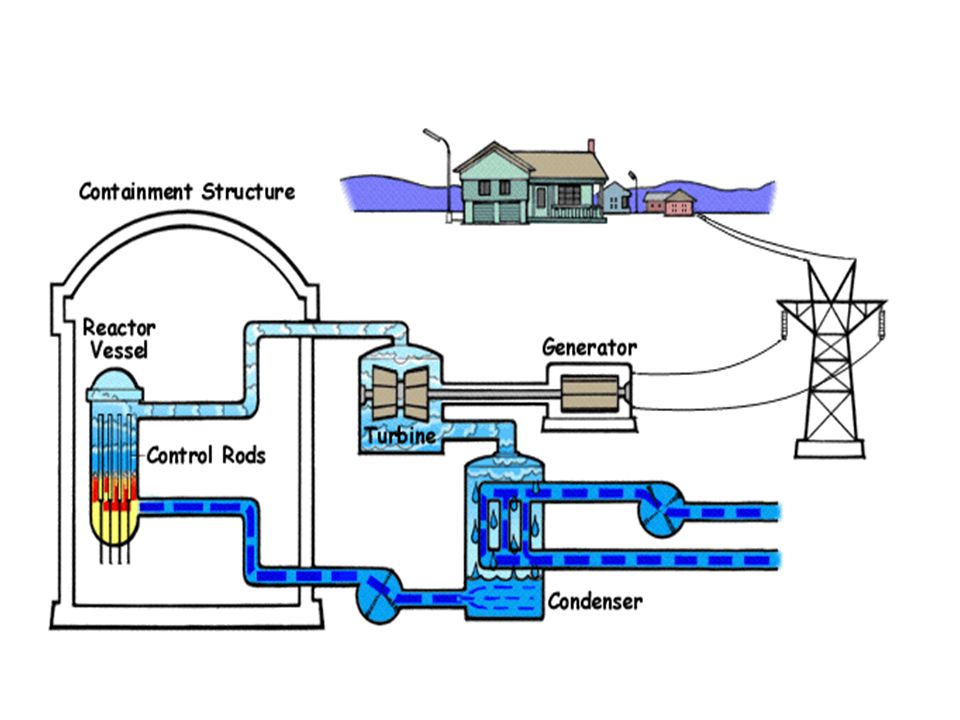
The Pressurized Water Reactor (PWR)
")
71
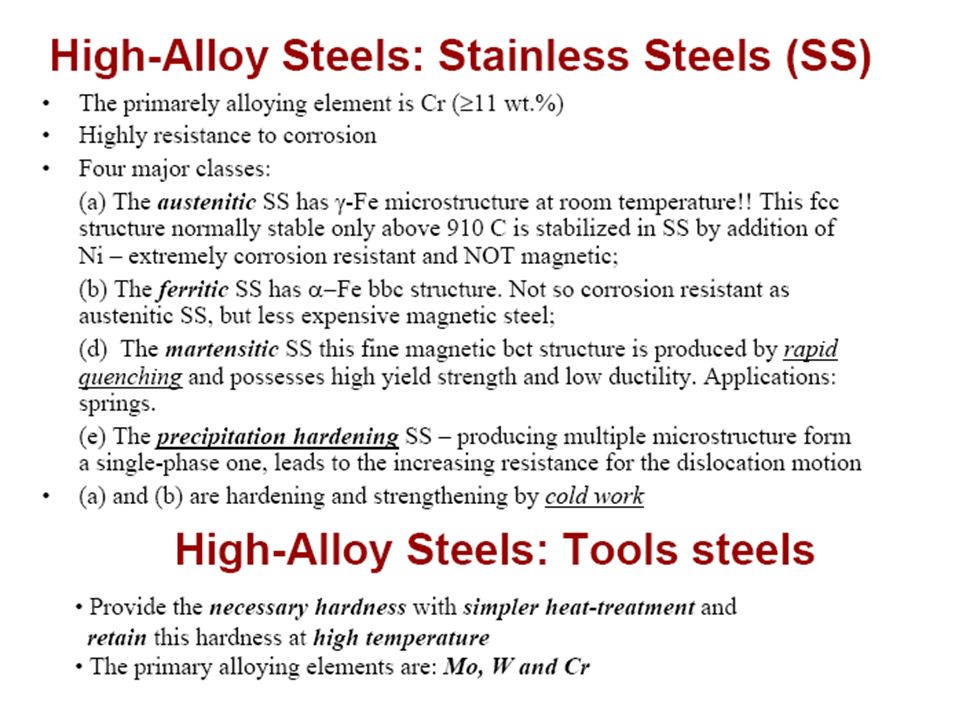
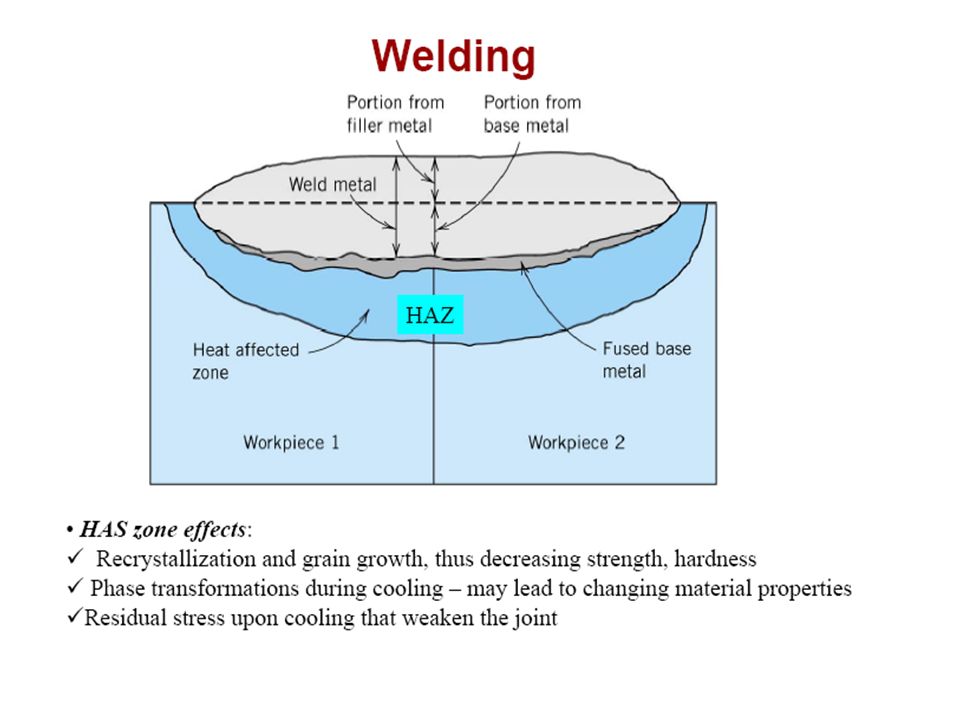
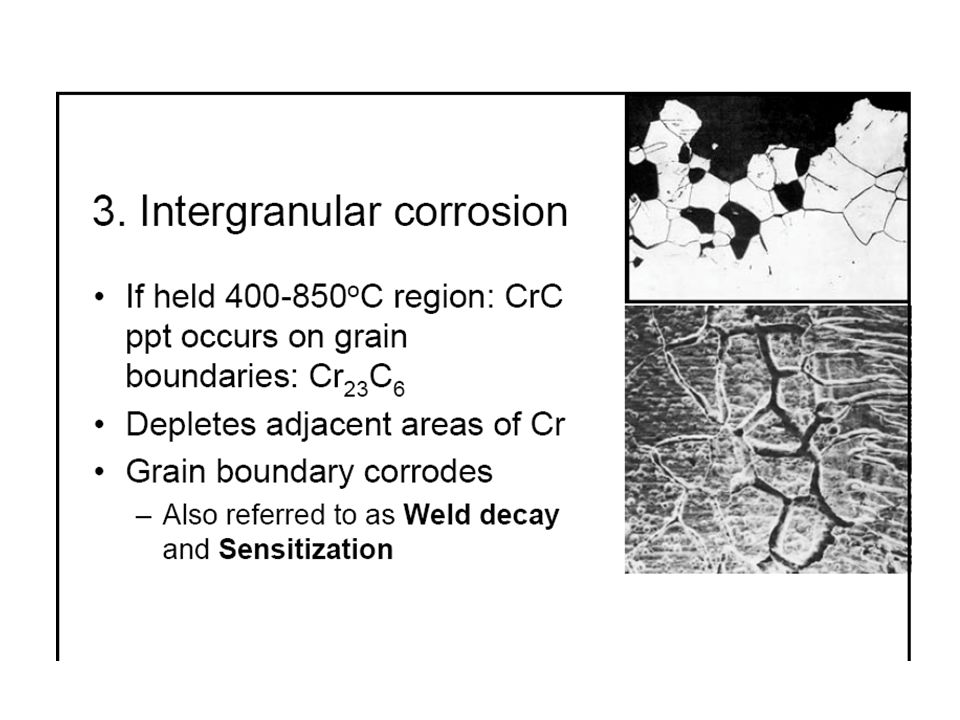
INTERGRANULAR CORROSION Carbide precipitation at grain boundary during sensitization in stainless steel heated in the temperature range 510C 788C GRAIN BOUNDARY SENSITIZATION Cr-depleted alloy at grain boundaries is anodic to the surrounding grains. High cathode/anode surface area ratio results in rapid microscopic galvanic attack and IGC at grain boundaries. To prevent sensitization 1. Lower carbon level 2. Add carbide formers 3. Heat treatment

72
Weld Decay in Stainless Steels

Similar presentations


>")


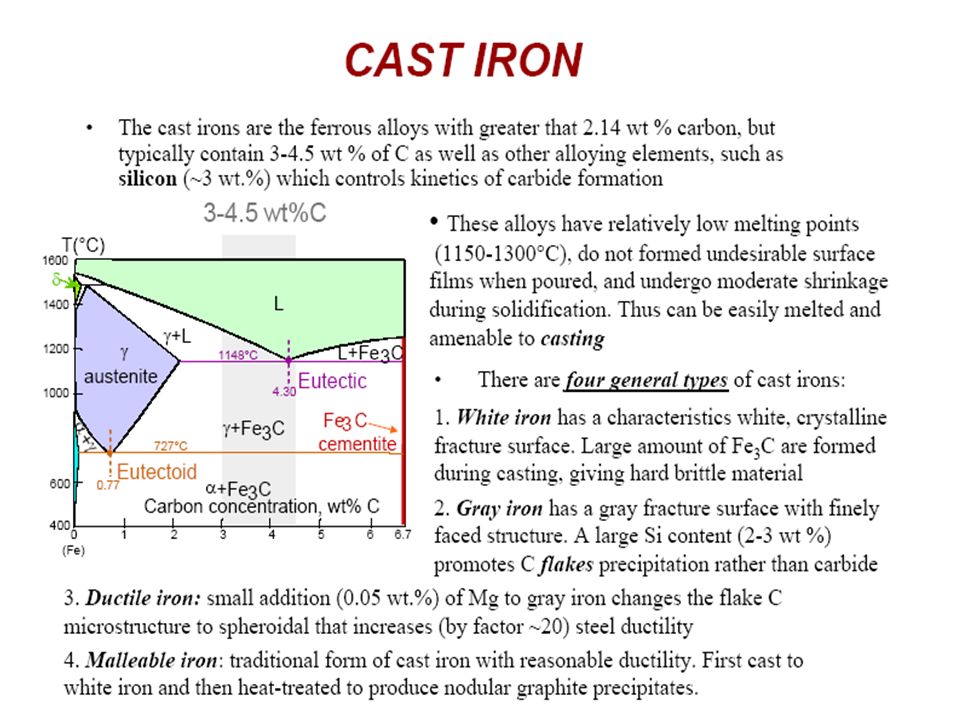
 1600 1400 1200 1000 800 600 400 0 1234566.7 L (austenite) +L+L + Fe 3 C L+Fe 3 C C o, wt% C 1148°C T(°C)>")


,>")