Download presentation
Presentation is loading. Please wait.

1
EGEE-III INFSO-RI-222667 Enabling Grids for E-sciencE www.eu-egee.org EGEE and gLite are registered trademarks On-line Visualization for Grid-based Astronomical Parametric Studies Eva Pajorová Institute of Informatics, Slovac Academy of Sciences

2
Enabling Grids for E-sciencE EGEE-III INFSO-RI-222667 Previous presentations Experiences from porting the astrophysical simulation “The unified theory of Kuiper-belt and Oort-cloud formation” to EGEE grid Theory: Jovian planets, Kuiper belt, Scattered Disc (populations of small bodies beyond the Neptune’s orbit) and Oort cloud. The simulation was based on the dynamical evolution of a large number (~10000) planetesimals treated as test particles in the Proto- Planetary Disc. Simulation of the Oort formation cloud during the initial two Giga-years
 planetesimals treated as test particles in the Proto- Planetary Disc. Simulation of the Oort formation cloud during the initial two Giga-years.")
3
Enabling Grids for E-sciencE EGEE-III INFSO-RI-222667 Astronomical simulation Astronomical simulation in which the experiment was performed by Astronomical Institute of Slovak Academy of Sciences in the collaboration with Catania Observatory and Adam Mickiewitz University in Poznan. The simulation was ported to EGEE in the scope of NA4 activity by Institute of Informatics Slovak Academy of Sciences. It is the same simulation – for our experiment in visualization.

4
Enabling Grids for E-sciencE EGEE-III INFSO-RI-222667 Main goals Primary goal: To complete the mentioned Astronomical simulations by 3D Visualization results (in time 1Gyr and 2Gyr). Secondary goal: To explain here our design on test we actually working on: On-line visualization tool for parametric studies.

5
Enabling Grids for E-sciencE EGEE-III INFSO-RI-222667 Structure Visualization Tools of the running Grid applications On-line visualization for the Parametric Study Astronomical simulation as a example for Parametric Study Vision for a Future

6
Enabling Grids for E-sciencE EGEE-III INFSO-RI-222667 Application Framework Grid-based applications that generate visualization outputs use a unified application framework Unified way of cooperation between Grid visualization applications and visualization clients User naturally wants to see the intermediate results and requires means to modify the running computations

7
Enabling Grids for E-sciencE EGEE-III INFSO-RI-222667 Visualization Tool Visualization Tool as a plug – in module for a bigger variability Visualization service as a sequence application in Grid structure Outputs data from Grid computation as a inputs data for sequence visualization application

8
Enabling Grids for E-sciencE EGEE-III INFSO-RI-222667 AS as a parametric study Astronomical simulation is as a typical parametric study Creating visualization tool for astronomical simulation as a plug – in module Including Viz. tool in Grid infrastructure is described Schema 1

9
STORAGE ELEMENT as a Data server CLIENT Worker1Worker2 Viz. Worker 1 Worker3Worker4 Viz.Worker 2 JOBS DATA Configuration file Visualization CLIENT Configuration file JOBS DATA

10
STORAGE ELEMENT as a Data server CLIENT Worker1Worker2 Worker3Worker4 JOBS DATA Configuration file

11
Enabling Grids for E-sciencE EGEE-III INFSO-RI-222667 On-line visualization Submission: A bulk of the linked jobs was emplaced on the Storage element - as a data server. Script started on the User Interface controlled another script on Computing Element. Workers worked till inputs stored on the SE was completed.

12
Enabling Grids for E-sciencE EGEE-III INFSO-RI-222667 On-line visualization The main problem when running the parametric simulations with high number of tasks in grid was the reliability of grid infrastructure. To overcome these problems, we decided to use “pilot job” concept. Was developed a generic, lightweight and easy- to-use framework based on technologies available in EGEE without need for external services or technologies.

13
STORAGE ELEMENT as a Data server Viz. Worker 1 Viz.Worker 2 Visualization client Configuration file JOBS DATA

14
Enabling Grids for E-sciencE EGEE-III INFSO-RI-222667 Visualization service Client ask for visualization is as a Visualization client. Outputs data on the Storage element are as a inputs data for visualization jobs. Configuration file will be included by Visualization tool for the application. Can be activated control script. Workers modified data to the visualize formats.

15
Enabling Grids for E-sciencE EGEE-III INFSO-RI-222667 Proto-Planetary Disc Within the simulation, the dynamical evolution of trans-Neptunian reservoirs of small bodies was investigated. Specifically, there are defined 3 major reservoirs: Keeper belt, Scattered Disc, and Oort cloud of Comets. It is believed that all these reservoirs originate from the once existing Proto-Planetary Disc.

16
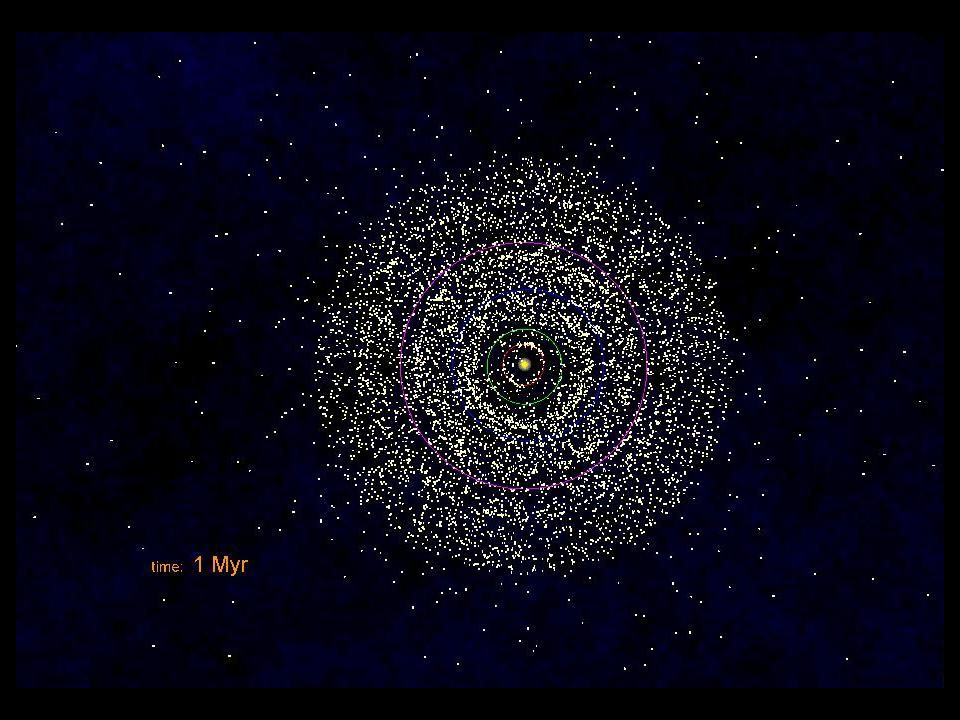
Enabling Grids for E-sciencE EGEE-III INFSO-RI-222667 Astronomical simulation In the beginning of the simulation, the proto- planetary disc was represented by a set of test particles of the number of about 10000, which were distributed within almost a single plane in the interval of distances from 4 to 50 AU (AU –astronomical unit) from the Sun.
 from the Sun.")
17
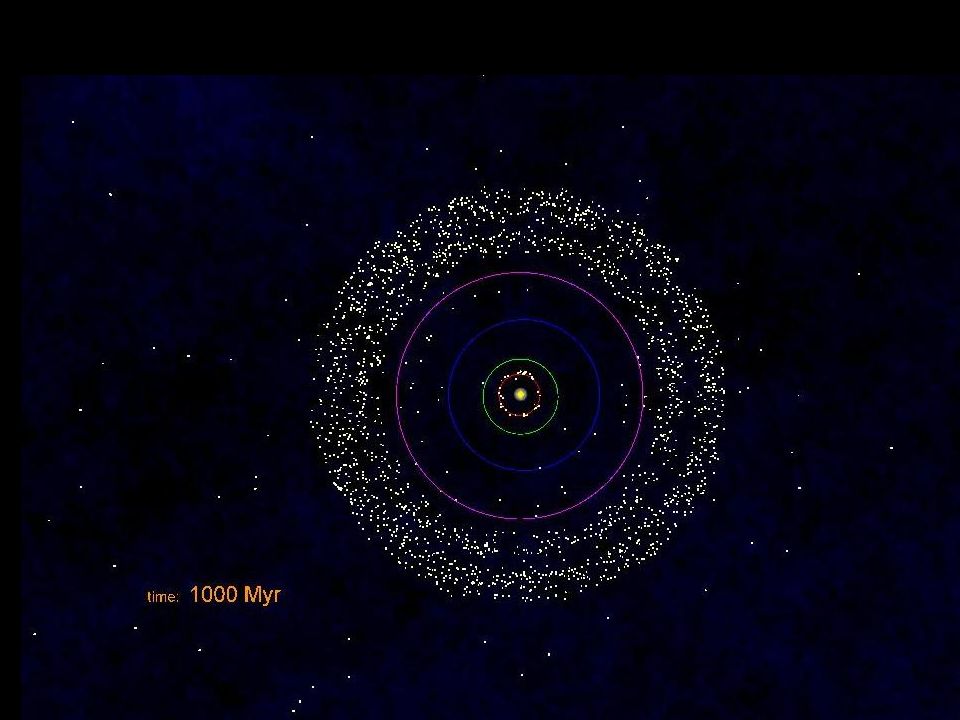
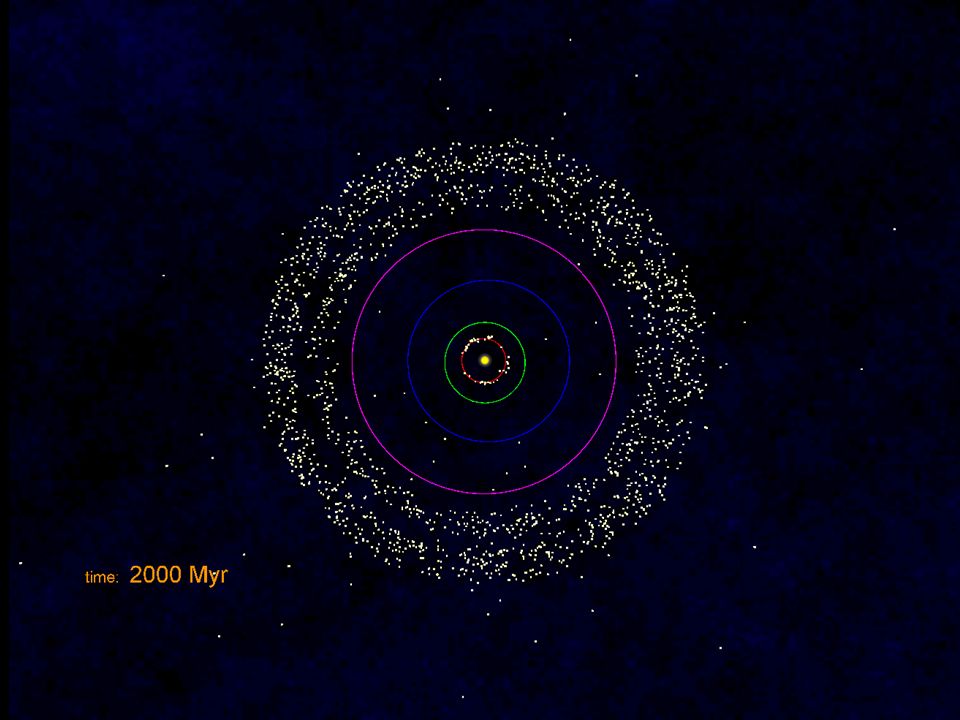
Enabling Grids for E-sciencE EGEE-III INFSO-RI-222667 The simulation of the Oort-cloud formation The particles were influenced by the already mentioned four planets, assumed to revolute the Sun on the orbits having the orbital plane almost the same as the mean plane of the disc In addition, an action of the Galactic tide and passing stars was considered. The dynamical evolution of the test particles was followed via numerical integration, in the GRID, for the period of 1 and 2 Gyr

21
1 Myr 1000 Myr

23
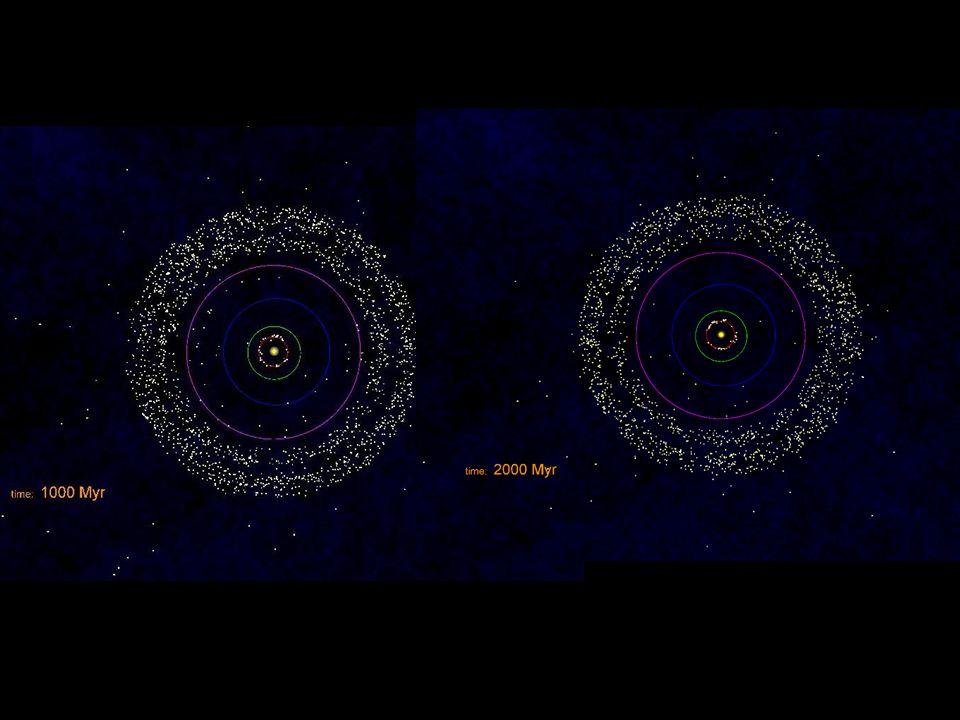
Enabling Grids for E-sciencE EGEE-III INFSO-RI-222667 Visualization results Dynamical evolution - logarithmic scale /Video1/ Visualization result in period of 1 Gyr /Video2/ Visualization result in period of 2 Gyr /Video 3/

Similar presentations
 Hal Levison (SwRI) Rodney Gomes.>")


 on behalf of the.>")
 M.-E. Bégin (SixSq.>")


 M.-E. Bégin (SixSq.>")


