Download presentation
Presentation is loading. Please wait.

1
Planning for Continuous School Improvement
Professional Development Services Curriculum, Instruction, and Assessment

2
Outcomes To understand the importance of utilizing multiple measures of data. To understand the systematic process for continuous school improvement planning. To understand the HISD SIP process and requirements.

3
Pre-Conditions for School Improvement
Instructional Coherence Shared Vision for School Improvement Data Driven Decision Making Be sure to address alignment and the importance of teaching the written curriculum

4
Because learning neither takes place in isolation, nor only at school, multiple measures must be considered and used to understand the multifaceted world of school from the perspective of everyone involved. Types of information that assist with planning for and sustaining systemic school improvement include: Demographics Perceptions Student Learning School Processes One measure, by itself, gives useful information. Comprehensive measures used together and over time provide much richer information. Together, these measures can provide a powerful picture that can help us understand the school’s impact on student achievement. These measures, when used together, give schools the information they need to get the results they want. Let’s look at each measure separately. Note: This graphic is on: Page 11 of Using Data to Improve Student Learning in Elementary Schools Book, Page 48 of The School Portfolio Toolkit Book, Page 15 of the Data Analysis Book, and Page 28 of The School Portfolio Book

5
Multiple Measures of Data
Demographics Perceptions Student Learning School Processes The planning process is based on the work of Victoria Bernhardt. Bernhardt asks us to look at multiple measures of data to get a complete picture of your school, determine where we are, where we want to go, and what are the root causes of the gaps that we have. Looking at multiple measures gives us a more accurate understanding than looking at one or each in isolation. Because learning neither takes place in isolation, nor only at school, multiple measures must be considered and used to understand the multifaceted world of school from the perspective of everyone involved. Comprehensive measures used together and over time provide much richer information. Disaggregating data is a problem-finding activity and not a problem-solving atcivity.

6
Demographics Because trends have a clear direction, instead of causing turbulence, they actually help reduce it because they have a significant amount of predictability. Joel Barker

7
Demographics Schools should begin the planning process by setting the context What we believe turns into expectations and then action Longitudinal trends are important for planning Implications for professional learning and leadership Use examples to illustrate these points such as number and % of kids in special ed by gender and ethnicity. What should the school do if there is an overidentification of African American males in special ed? Other examples : GT, Advanced Placement, discipline referrals, 6th grade retention, success in algebra 1 as a predictor for success

8
Perceptions Perceptions are important because they are someone’s reality. Informs behavior of the staff, students, and parents For table conversation--What are some of the perceptions we can gain regarding students? Staff? Parents? Staff values and perceptions impact behavior Perceptions have an implication for planning Describe perceptions and then ask tables to discuss the question. Surveys of various stakeholders give us information about such things as: Whether students believe teachers care about them/ care if they make them learn by having high expectations Teacher values and how that impacts instruction for different groups of students Information about rigor and relevance can be gleaned Vision and morale The perceptions information tells us what is happening and what is possible! Community perception- need evidence to know what they think, not assumptions, and be strategic

9
Student Learning Why is it Important?
Measures student group proficiency Assess individual or group achievement Assess added-value progress Guide curriculum development or revision Improve instruction Understand which programs are getting the results we want Accountability PLC Key Questions Formative assessments How are we using student achievement results?

10
School Processes Improvement is not achieved by focusing on results, but by focusing on improving the systems that create the results. National Leadership Network School processes are important because they help us- To diagnose learning problems Understand how we got our results Know what we need to do differently to get different resullts

11
School Processes Most difficult to measure
Evaluate impact of curriculum, instruction, assessment, and interventions What processes will create the results we want?

12
Evaluation of School Processes
Review the continuum and determine where your school is in each area. Pair/share- Discuss your reflections with a partner. Refer participants to Bernhardt book, page 262, on processes and ask them to determine where they are on the continuum for each area and to think about how this informs their planning.

13
Data analysis is only one piece of the puzzle in continuous school improvement.
Without one critical piece of information, a target, our results might resemble “Random Acts of Improvement.”

14
Intersection of Data– Moving from Random Acts of Improvement to Focused Acts of Improvement
What processes or programs work best for different groups of students measured by student learning results? What impact do demographic factors and student attitudes about the learning environment have on student learning? Are all groups of students represented in the different programs and processes offered by the school? These are some examples of questions for discussion using multiple measures that impact planning. The Bernhardt CD has a chart of all the intersection questions.

15
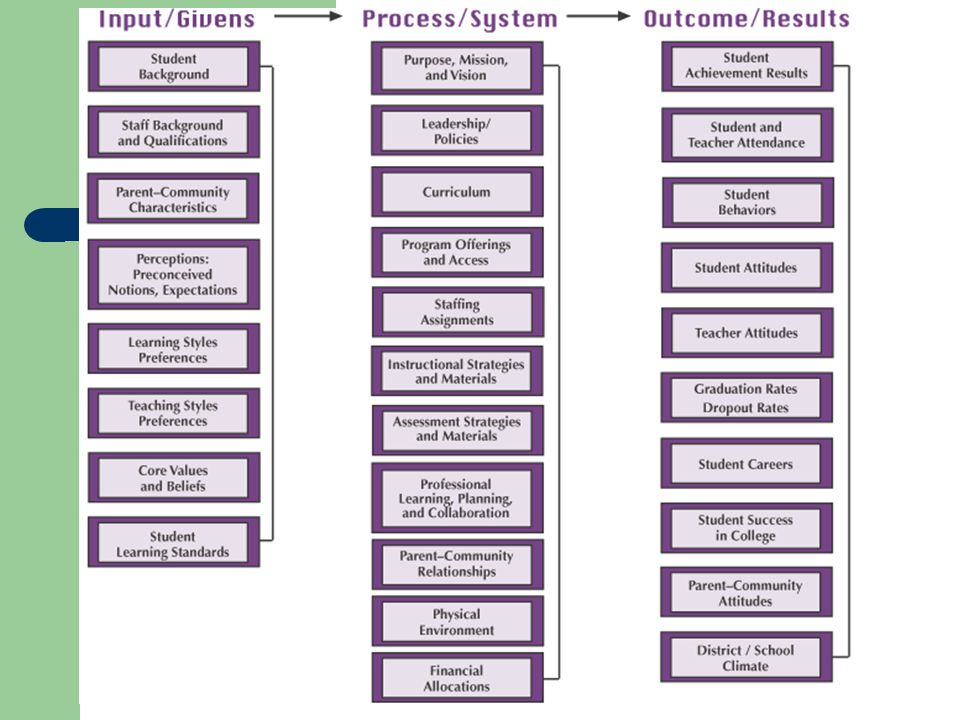
Table Activity Categorize each of the activities as Input, Process, or Outcome Input Data elements that describe the “givens” that are usually beyond our immediate control. Each group sorts the activities and discusses their decisions. Hand out the definition page for input, process, and outcomes to use with the activity. Then give the group the information sheet to show proper placement. Ask the group to share conclusions. You should hear that we have control over more things than not and that processes strongly impact outcomes. What is the point? Schools need to look at more than student achievement results . Processes and inputs are important and effect results.

16
Table Activity (con’t)
Process Elements that describe the actions learning organizations plan for and implement to get the outcomes they are striving to achieve, given the input. Outcome The data elements that describe the results of a learning organization’s processes.

18
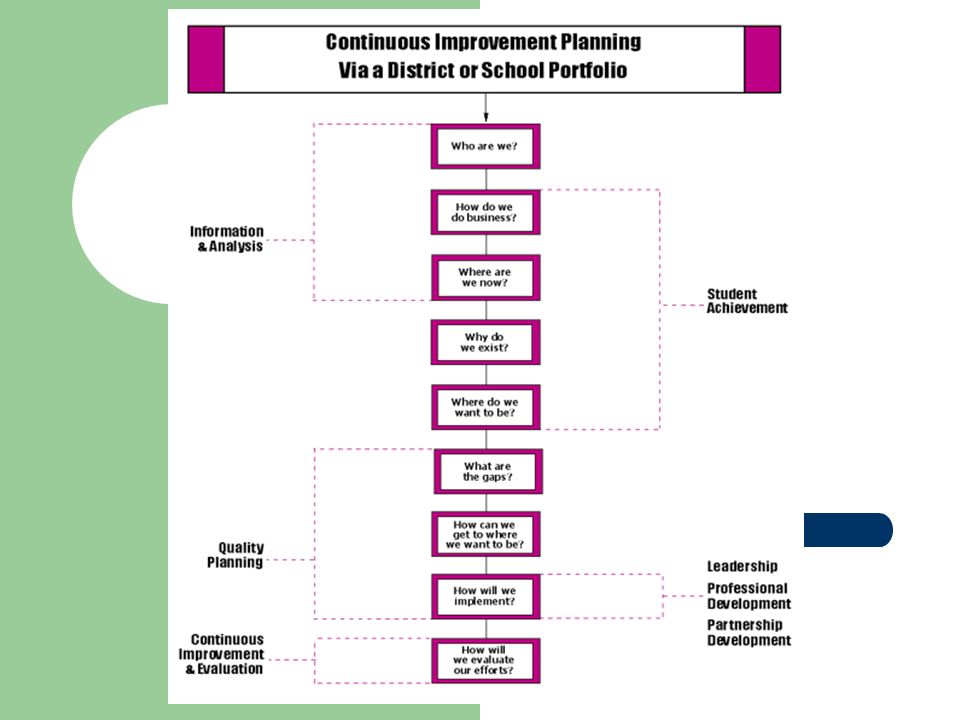
The Process Review of flow chart questions HISD planning process
HISD template Utilize the handout with the flowchart to explain the process Then walk them through the DVD of the HISD planning process. Let them know that the Bernhardt CD has numerous activities and resources that they can use if they wish. Then show them the HISD template and what is required and the timeline.

20
Resources Victoria Bernhardt, Using Data to Improve Student Learning
DuFour, DuFour, Eaker, and Many, Learning by Doing List of resources on handout aligned to district initiatives and framework Training Dates

21
Next Steps Gather and analyze demographic data to extent possible
Discuss mission, vision, and values If possible, determine perceptions of stakeholders Analyze student achievement data Develop first draft of 3 SMART goals

Similar presentations