Download presentation
Presentation is loading. Please wait.

1
Molecular Evolution Distance Methods Biol. Luis Delaye Facultad de Ciencias, UNAM

2
a b Mainly a STATISTICAL problem!

3
a)Models of sequence evolution b)Sequence similarity c)Estimating the number of substitutions between two sequences d)Phylogenetic reconstruction
Models of sequence evolution b)Sequence similarity c)Estimating the number of substitutions between two sequences d)Phylogenetic reconstruction")
4
Evolution at the molecular level is the substitution of one allele by another 0 1 frequency time 1/ The basic forces are: mutation, genetic drift and natural selection Allele AAllele BAllele C

5
By this process, a DNA sequence accumulates substitutions through time ATCGCATCCATCGCATCC ATTGCGTACATTGCGTAC TAGCGTAGGTAGCGTAGG TAACCCATGTAACCCATG t

6
In the study of molecular evolution, this changes in a DNA sequence are used for both: Estimating the rate of molecular evolution Reconstructing the evolutionary history

7
Models of sequence evolution

8
Models of DNA evolution AC To study the dynamics of nucleotide substitution we must made assumptions regarding the probability (p) of substitution of one nucleotide by another at the end of time interval t p t
 of substitution of one nucleotide by another at the end of time interval t p t")
9
p AC For instance, P AC represents the probability that a site that has started with nucleotide i (A in this case) change to nucleotide j (C in this case) at the end of interval t
 change to nucleotide j (C in this case) at the end of interval t")
10
Models of DNA evolution using matrix theory P AA P AC P AG P AT P CA P CC P CG P CT P GA P GC P GG P GT P TA P TC P TG P TT P t = Substitution probability matrix f = [f A f C f G f T ] Base composition of sequences
![Models of DNA evolution using matrix theory P AA P AC P AG P AT P CA P CC P CG P CT P GA P GC P GG P GT P TA P TC P TG P TT P t = Substitution probability matrix f = [f A f C f G f T ] Base composition of sequences](http://images.slideplayer.com/31/9741281/slides/slide_10.jpg "Models of DNA evolution using matrix theory P AA P AC P AG P AT P CA P CC P CG P CT P GA P GC P GG P GT P TA P TC P TG P TT P t = Substitution probability matrix f = [f A f C f G f T ] Base composition of sequences")
11
The Jukes and Cantor’s One-Parameter Model AG CT

12
* * * * * * * * P t = Substitution probability matrix f = [ ¼ ¼ ¼ ¼ ] Base composition of sequences The Jukes and Cantor’s One-Parameter Model * p ii = 1 - j i p ij
![* * * * * * * * P t = Substitution probability matrix f = [ ¼ ¼ ¼ ¼ ] Base composition of sequences The Jukes and Cantor’s One-Parameter Model * p ii = 1 - j i p ij](http://images.slideplayer.com/31/9741281/slides/slide_12.jpg "* * * * * * * * P t = Substitution probability matrix f = [ ¼ ¼ ¼ ¼ ] Base composition of sequences The Jukes and Cantor’s One-Parameter Model * p ii = 1 - j i p ij")
13
A The Jukes and Cantor’s One-Parameter Model t = 0t = 1 A p A(0) = 1 p A(1) = 1 - 3 Since we started whit A The probability that the nucleotide has remained unchanged What is the probability of having an A in a site in a DNA sequence at time t =1, in a site that started whit an A at time t = 0 ?
 = 1 p A(1) = Since we started whit A The probability that the nucleotide has remained unchanged What is the probability of having an A in a site in a DNA sequence at time t =1, in a site that started whit an A at time t = 0")
14
The Jukes and Cantor’s One-Parameter Model What is the probability of having an A in a site in a DNA sequence at time t = 2? A A A A Not A A t = 0 t = 1 t = 2 Scenario 1Scenario 2 No substitutionSubstitution No substitutionSubstitution (After Li, 1997)
.")
15
The Jukes and Cantor’s One-Parameter Model What is the probability of having an A in a site in a DNA sequence at time t = 2? A A A A Not A A t = 0 t = 1 t = 2 Scenario 1Scenario 2 p A(1) = (1 - 3 ) [1 - p A(1) ] (1 - 3 ) (After Li, 1997)
 = (1 - 3 ) [1 - p A(1) ] (1 - 3 ) (After Li, 1997).")
16
The Jukes and Cantor’s One-Parameter Model What is the probability of having an A in a site in a DNA sequence at time t = 2? A A A A Not A A t = 0 t = 1 t = 2 Scenario 1Scenario 2 p A(1) [1 - p A(1) ] (1 - 3 ) (After Li, 1997) +
 [1 - p A(1) ] (1 - 3 ) (After Li, 1997) +.")
17
The Jukes and Cantor’s One-Parameter Model What is the probability of having an A in a site in a DNA sequence at time t = 2? p A(2) = (1 - 3 ) p A(1) + [1 - p A(1) ] The probability of not having a substitution from t = 1 to t = 2 The probability of not having a substitution from t = 0 to t = 1 The probability of having a substitution from not A to A, from t = 1 to t = 2 The probability of having a substitution from A to not A, in t = 0 to t = 1 The probability of no change The probability of reversible change
 = (1 - 3 ) p A(1) + [1 - p A(1) ] The probability of not having a substitution from t = 1 to t = 2 The probability of not having a substitution from t = 0 to t = 1 The probability of having a substitution from not A to A, from t = 1 to t = 2 The probability of having a substitution from A to not A, in t = 0 to t = 1 The probability of no change The probability of reversible change.")
18
The Jukes and Cantor’s One-Parameter Model The following recurrence equation holds for any t: p A(t + 1) = (1 - 3 ) p A(t) + [1 - p A(t) ]
![The Jukes and Cantor’s One-Parameter Model The following recurrence equation holds for any t: p A(t + 1) = (1 - 3 ) p A(t) + [1 - p A(t) ]](http://images.slideplayer.com/31/9741281/slides/slide_18.jpg "The Jukes and Cantor’s One-Parameter Model The following recurrence equation holds for any t: p A(t + 1) = (1 - 3 ) p A(t) + [1 - p A(t) ]")
19
The Jukes and Cantor’s One-Parameter Model Rewriting this equation in terms of the amount of change: p A(t + 1) - p A(t) = (1 - 3 ) p A(t) + [1 - p A(t) ] - p A(t)
![The Jukes and Cantor’s One-Parameter Model Rewriting this equation in terms of the amount of change: p A(t + 1) - p A(t) = (1 - 3 ) p A(t) + [1 - p A(t) ] - p A(t)](http://images.slideplayer.com/31/9741281/slides/slide_19.jpg "The Jukes and Cantor’s One-Parameter Model Rewriting this equation in terms of the amount of change: p A(t + 1) - p A(t) = (1 - 3 ) p A(t) + [1 - p A(t) ] - p A(t)")
20
The Jukes and Cantor’s One-Parameter Model Doing some algebra: p A(t + 1) - p A(t) = (1 - 3 ) p A(t) + [1 - p A(t) ] - p A(t)
![The Jukes and Cantor’s One-Parameter Model Doing some algebra: p A(t + 1) - p A(t) = (1 - 3 ) p A(t) + [1 - p A(t) ] - p A(t)](http://images.slideplayer.com/31/9741281/slides/slide_20.jpg "The Jukes and Cantor’s One-Parameter Model Doing some algebra: p A(t + 1) - p A(t) = (1 - 3 ) p A(t) + [1 - p A(t) ] - p A(t)")
21
The Jukes and Cantor’s One-Parameter Model Doing some algebra: p A(t + 1) - p A(t) = (1 - 3 ) p A(t) + [1 - p A(t) ] - p A(t) p A(t + 1) - p A(t) = p A(t) - 3 p A(t) + [1 - p A(t) ] - p A(t)
![The Jukes and Cantor’s One-Parameter Model Doing some algebra: p A(t + 1) - p A(t) = (1 - 3 ) p A(t) + [1 - p A(t) ] - p A(t) p A(t + 1) - p A(t) = p A(t) - 3 p A(t) + [1 - p A(t) ] - p A(t)](http://images.slideplayer.com/31/9741281/slides/slide_21.jpg "The Jukes and Cantor’s One-Parameter Model Doing some algebra: p A(t + 1) - p A(t) = (1 - 3 ) p A(t) + [1 - p A(t) ] - p A(t) p A(t + 1) - p A(t) = p A(t) - 3 p A(t) + [1 - p A(t) ] - p A(t)")
22
The Jukes and Cantor’s One-Parameter Model Doing some algebra: p A(t + 1) - p A(t) = (1 - 3 ) p A(t) + [1 - p A(t) ] - p A(t) p A(t + 1) - p A(t) = p A(t) - 3 p A(t) + [1 - p A(t) ] - p A(t)
![The Jukes and Cantor’s One-Parameter Model Doing some algebra: p A(t + 1) - p A(t) = (1 - 3 ) p A(t) + [1 - p A(t) ] - p A(t) p A(t + 1) - p A(t) = p A(t) - 3 p A(t) + [1 - p A(t) ] - p A(t)](http://images.slideplayer.com/31/9741281/slides/slide_22.jpg "The Jukes and Cantor’s One-Parameter Model Doing some algebra: p A(t + 1) - p A(t) = (1 - 3 ) p A(t) + [1 - p A(t) ] - p A(t) p A(t + 1) - p A(t) = p A(t) - 3 p A(t) + [1 - p A(t) ] - p A(t)")
23
The Jukes and Cantor’s One-Parameter Model Doing some algebra: p A(t + 1) - p A(t) = (1 - 3 ) p A(t) + [1 - p A(t) ] - p A(t) p A(t) = - 3 p A(t) + [1 - p A(t) ] p A(t + 1) - p A(t) = p A(t) - 3 p A(t) + [1 - p A(t) ] - p A(t)
![The Jukes and Cantor’s One-Parameter Model Doing some algebra: p A(t + 1) - p A(t) = (1 - 3 ) p A(t) + [1 - p A(t) ] - p A(t) p A(t) = - 3 p A(t) + [1 - p A(t) ] p A(t + 1) - p A(t) = p A(t) - 3 p A(t) + [1 - p A(t) ] - p A(t)](http://images.slideplayer.com/31/9741281/slides/slide_23.jpg "The Jukes and Cantor’s One-Parameter Model Doing some algebra: p A(t + 1) - p A(t) = (1 - 3 ) p A(t) + [1 - p A(t) ] - p A(t) p A(t) = - 3 p A(t) + [1 - p A(t) ] p A(t + 1) - p A(t) = p A(t) - 3 p A(t) + [1 - p A(t) ] - p A(t)")
24
The Jukes and Cantor’s One-Parameter Model Doing some algebra: p A(t + 1) - p A(t) = (1 - 3 ) p A(t) + [1 - p A(t) ] - p A(t) p A(t) = - 3 p A(t) + [1 - p A(t) ] p A(t + 1) - p A(t) = p A(t) - 3 p A(t) + [1 - p A(t) ] - p A(t)
![The Jukes and Cantor’s One-Parameter Model Doing some algebra: p A(t + 1) - p A(t) = (1 - 3 ) p A(t) + [1 - p A(t) ] - p A(t) p A(t) = - 3 p A(t) + [1 - p A(t) ] p A(t + 1) - p A(t) = p A(t) - 3 p A(t) + [1 - p A(t) ] - p A(t)](http://images.slideplayer.com/31/9741281/slides/slide_24.jpg "The Jukes and Cantor’s One-Parameter Model Doing some algebra: p A(t + 1) - p A(t) = (1 - 3 ) p A(t) + [1 - p A(t) ] - p A(t) p A(t) = - 3 p A(t) + [1 - p A(t) ] p A(t + 1) - p A(t) = p A(t) - 3 p A(t) + [1 - p A(t) ] - p A(t)")
25
The Jukes and Cantor’s One-Parameter Model Doing some algebra: p A(t + 1) - p A(t) = (1 - 3 ) p A(t) + [1 - p A(t) ] - p A(t) p A(t) = - 4 p A(t) + p A(t + 1) - p A(t) = p A(t) - 3 p A(t) + [1 - p A(t) ] - p A(t) p A(t) = - 3 p A(t) + [1 - p A(t) ]
![The Jukes and Cantor’s One-Parameter Model Doing some algebra: p A(t + 1) - p A(t) = (1 - 3 ) p A(t) + [1 - p A(t) ] - p A(t) p A(t) = - 4 p A(t) + p A(t + 1) - p A(t) = p A(t) - 3 p A(t) + [1 - p A(t) ] - p A(t) p A(t) = - 3 p A(t) + [1 - p A(t) ]](http://images.slideplayer.com/31/9741281/slides/slide_25.jpg "The Jukes and Cantor’s One-Parameter Model Doing some algebra: p A(t + 1) - p A(t) = (1 - 3 ) p A(t) + [1 - p A(t) ] - p A(t) p A(t) = - 4 p A(t) + p A(t + 1) - p A(t) = p A(t) - 3 p A(t) + [1 - p A(t) ] - p A(t) p A(t) = - 3 p A(t) + [1 - p A(t) ]")
26
Rewriting this equation for a continuous time model: = - 4 p A(t) + d p A(t) d t The Jukes and Cantor’s One-Parameter Model
 + d p A(t) d t The Jukes and Cantor’s One-Parameter Model")
27
Rewriting this equation for a continuous time model: = - 4 p A(t) + d p A(t) d t The Jukes and Cantor’s One-Parameter Model p A(t) = ¼ + p A(0) - ¼ e -4 t The solution is given by:
 + d p A(t) d t The Jukes and Cantor’s One-Parameter Model p A(t) = ¼ + p A(0) - ¼ e -4 t The solution is given by:")
28
Since we started with A, p A(0) = 1 The Jukes and Cantor’s One-Parameter Model An if we start with non A, p A(0) = 0 p A(t) = ¼ + 1 - ¼ e -4 t = ¼ + ¾ e -4 t p A(t) = ¼ + 0 - ¼ e -4 t = ¼ - ¼ e -4 t
 = 1 The Jukes and Cantor’s One-Parameter Model An if we start with non A, p A(0) = 0 p A(t) = ¼ + 1 - ¼ e -4 t = ¼ + ¾ e -4 t p A(t) = ¼ + 0 - ¼ e -4 t = ¼ - ¼ e -4 t")
29
The probability of initially having A, and still having A at time t is: The Jukes and Cantor’s One-Parameter Model The probability of initially having G, and then having A at time t is: p AA(t) = ¼ + ¾ e -4 t p GA(t) = ¼ - ¼ e -4 t We can write the equations in a more explicit form:
 = ¼ + ¾ e -4 t p GA(t) = ¼ - ¼ e -4 t We can write the equations in a more explicit form:")
30
And since all nucleotides are equivalent under the JC model, p GA(t) = p CA(t) = p TA(t). The Jukes and Cantor’s One-Parameter Model p ii(t) = ¼ + ¾ e -4 t p ij(t) = ¼ - ¼ e -4 t where i j
 = ¼ + ¾ e -4 t p ij(t) = ¼ - ¼ e -4 t where i j.")
31
pA(t)pA(t) For instance, p A(t) can also be interpreted as the frequency of A in a DNA sequence. For example, if we start with a sequence made of A ‘s only, then p A(0) = 1, and p A(t) is the expected frequency of A in the sequence at time t.
 = 1, and p A(t) is the expected frequency of A in the sequence at time t..")
32
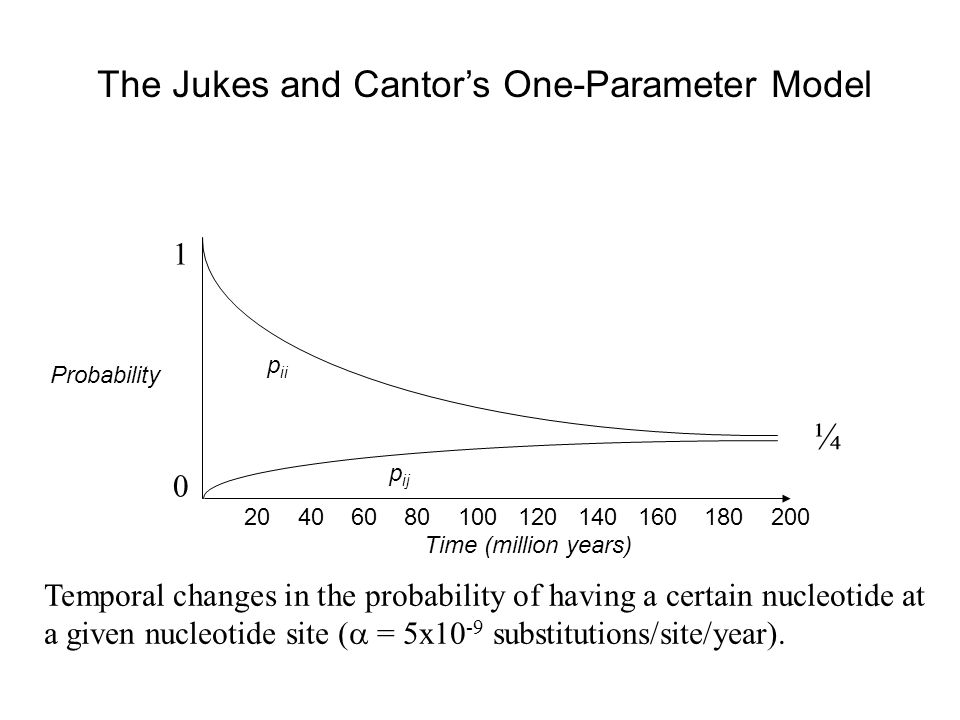
Probability Time (million years) p ii p ij ¼ The Jukes and Cantor’s One-Parameter Model Temporal changes in the probability of having a certain nucleotide at a given nucleotide site ( = 5x10 -9 substitutions/site/year). 0 1 20 40 60 80 100 120 140 160 180 200
33
Other models of sequence evolution

34
The Kimura two-Parameter Model AG CT Transitions Transversions

35
Base pair differences Time since divergence (Myr) Transitions Transversions The Kimura two-Parameter Model Number of transition and transversions between pairs of bovid mammal mitochondrial sequences (684 base pairs from the COII gene) against the estimated time of divergence. 0 5 10 15 20 25 20 40 60 80 100

36
* * * * * * * * P t = Substitution probability matrix f = [ ¼ ¼ ¼ ¼ ] Base composition of sequences The Kimura two-Parameter Model * p ii = 1 - j i p ij
![* * * * * * * * P t = Substitution probability matrix f = [ ¼ ¼ ¼ ¼ ] Base composition of sequences The Kimura two-Parameter Model * p ii = 1 - j i p ij](http://images.slideplayer.com/31/9741281/slides/slide_36.jpg "* * * * * * * * P t = Substitution probability matrix f = [ ¼ ¼ ¼ ¼ ] Base composition of sequences The Kimura two-Parameter Model * p ii = 1 - j i p ij")
37
* C G T A * G T A C * T A C G * P t = Substitution probability matrix f = [ A C G T ] Base composition of sequences The Felsenstein (1981) Model * p ii = 1 - j i p ij This model assumes that there is variation in base composition
![* C G T A * G T A C * T A C G * P t = Substitution probability matrix f = [ A C G T ] Base composition of sequences The Felsenstein (1981) Model * p ii = 1 - j i p ij This model assumes that there is variation in base composition](http://images.slideplayer.com/31/9741281/slides/slide_37.jpg "* C G T A * G T A C * T A C G * P t = Substitution probability matrix f = [ A C G T ] Base composition of sequences The Felsenstein (1981) Model * p ii = 1 - j i p ij This model assumes that there is variation in base composition")
38
* C G T A * G T A C * T A C G * P t = Substitution probability matrix f = [ A C G T ] Base composition of sequences The Hasegawa, Kishino and Yano (1985) Model * p ii = 1 - j i p ij This model assumes that there is variation in base composition and that transition and transversions occur at different rates.
![* C G T A * G T A C * T A C G * P t = Substitution probability matrix f = [ A C G T ] Base composition of sequences The Hasegawa, Kishino and Yano (1985) Model * p ii = 1 - j i p ij This model assumes that there is variation in base composition and that transition and transversions occur at different rates.](http://images.slideplayer.com/31/9741281/slides/slide_38.jpg "* C G T A * G T A C * T A C G * P t = Substitution probability matrix f = [ A C G T ] Base composition of sequences The Hasegawa, Kishino and Yano (1985) Model * p ii = 1 - j i p ij This model assumes that there is variation in base composition and that transition and transversions occur at different rates.")
39
* C a G b T c A a * G d T e A b C d * T f A c C e G f * P t = Substitution probability matrix f = [ A C G T ] Base composition of sequences The General Reversible (REV) Model * p ii = 1 - j i p ij This model assumes that there is variation in base composition and that each substitution has its own probability.
![* C a G b T c A a * G d T e A b C d * T f A c C e G f * P t = Substitution probability matrix f = [ A C G T ] Base composition of sequences The General Reversible (REV) Model * p ii = 1 - j i p ij This model assumes that there is variation in base composition and that each substitution has its own probability.](http://images.slideplayer.com/31/9741281/slides/slide_39.jpg "* C a G b T c A a * G d T e A b C d * T f A c C e G f * P t = Substitution probability matrix f = [ A C G T ] Base composition of sequences The General Reversible (REV) Model * p ii = 1 - j i p ij This model assumes that there is variation in base composition and that each substitution has its own probability.")
40
Comparing the Models Jukes-Cantor Allow for / bias Allow for base frequency to vary Kimura 2 parameterFelsenstein (1981) Allow for / bias Allow for base frequency to vary Felsenstein (1981) Allow all six pairs of substitutions to have different rates General Reversible (REV) From Page and Holms (1998)
 Allow for / bias Allow for base frequency to vary Felsenstein (1981) Allow all six pairs of substitutions to have different rates General Reversible (REV) From Page and Holms (1998)")
41
Among site rate variation

42
For protein coding sequences not all sites have the same probability of change (there is among site rate variation). If this effect is not taken into account, the number of substitutions per site between two sequences can be underestimated (Li and Graur, 1991).
..")
43
Effect of among site rate variation in sequence divergence (A) Substitution rate of 0.5 % / M.a. and 80 % of the sites free to vary (B) Substitution rate of 2 % / M.a. and 50 % of the sites free to vary (Page and Holms, 1998)
 Substitution rate of 2 % / M.a. and 50 % of the sites free to vary (Page and Holms, 1998).")
44
Gamma distribution f(r) = [b a / (a)] e –br r a-1 where: (a) = ∫ 0 e –t t a-1 dt
![Gamma distribution f(r) = [b a / (a)] e –br r a-1 where: (a) = ∫ 0 e –t t a-1 dt](http://images.slideplayer.com/31/9741281/slides/slide_44.jpg "Gamma distribution f(r) = [b a / (a)] e –br r a-1 where: (a) = ∫ 0 e –t t a-1 dt")
45
The a shape parameter

46
Time reversibility

47
Time reversibility in the Jukes and Cantor’s One- Parameter Model A A A tt p AA(t) p AA(t) 2 AAA t = 0t = 1t = 2 p AA(t) p AA(t) 2
 p AA(t) 2 AAA t = 0t = 1t = 2 p AA(t) p AA(t) 2")
48
Time reversibility in the Jukes and Cantor’s One- Parameter Model A A A tt p AA(t)
")
49
Time reversibility in the Jukes and Cantor’s One- Parameter Model A A A tt p AA(t)
")
50
Time reversibility in the Jukes and Cantor’s One- Parameter Model A A A tt p AA(t) p AA(t) 2
 p AA(t) 2")
51
Time reversibility in the Jukes and Cantor’s One- Parameter Model A substitution process is said to be time reversible if the probability of starting from nucleotide i and changing to nucleotide j in a time interval t is the same as the probability of starting from j and going backward to i in the same time duration. p ij(t) p = p ji(t) p
 p = p ji(t) p.")
52
Sequence similarity between two sequences

53
Divergence Between DNA sequences Ancestral sequence Sequence 1 Sequence 2 tt

54
I(t)I(t) The expected value of the proportion of identical nucleotides between the two sequences under study is equal to the probability, I (t), that the nucleotide at a given site at time t is the same in both sequences.
I(t) The expected value of the proportion of identical nucleotides between the two sequences under study is equal to the probability, I (t), that the nucleotide at a given site at time t is the same in both sequences.")
55
Sequence Similarity A tt

56
A A tt p AA(t)
")
57
Sequence Similarity A A A tt p AA(t)
")
58
Sequence Similarity A A A tt p AA(t) p AA(t) 2
 p AA(t) 2")
59
Sequence Similarity A C C tt p AC(t) p AC(t) 2 But for parallel substitutions.
 p AC(t) 2 But for parallel substitutions.")
60
Sequence Similarity A G G tt p AG(t) p AG(t) 2 But for parallel substitutions.
 p AG(t) 2 But for parallel substitutions.")
61
Sequence Similarity A T T tt p AT(t) p AT(t) 2 But for parallel substitutions.
 p AT(t) 2 But for parallel substitutions.")
62
Sequence Similarity in the JC Model Therefore, I (t) = p AA(t) 2 + p AT(t) 2 + p AC(t) 2 + p AG(t) 2 And from the JC model, I (t) = ¼ + ¾ e -8 t This equation also holds if the initial nucleotide was different from A, and represents the expected proportion of identical nucleotides between two sequences that diverged t time units ago
 = p AA(t) 2 + p AT(t) 2 + p AC(t) 2 + p AG(t) 2 And from the JC model, I (t) = ¼ + ¾ e -8 t This equation also holds if the initial nucleotide was different from A, and represents the expected proportion of identical nucleotides between two sequences that diverged t time units ago")
63
Proportion of identical nucleotides Time (million years) ¼ Sequence similarity in the Jukes and Cantor’s One-Parameter Model Temporal changes in the expected proportion of identical nucleotides between two sequences that diverged t years ago ( = 5x10 -9 substitutions/site/year). 0 1 20 40 60 80 100 120 140 160 180 200

64
Estimating the number of nucleotide substitutions between two sequences

65
Number of nucleotide substitutions between two sequences K= N/L Substitutions per nucleotide site. Total number of substitutions. Number of sites compared between two sequences.

66
A simple measure of genetic distance between two sequences is p p= n d / n Proportion of different sites. Total number of differences. Number of sites compared between two sequences.

67
Divergence Between DNA sequences Ancestral sequence Sequence 1 Sequence 2 ACTGAACGTAACGCACTGAACGTAACGC ACTGAACGTAACGCACTGAACGTAACGC tt Single substitution Multiple substitutions T C Coincidental substitutions Parallel substitutions Convergent substitutions Back substitutions T C A G G A A T

68
Divergence Between DNA sequences Ancestral sequence Sequence 1 Sequence 2 ACTGAACGAATCGCACTGAACGAATCGC ACTGAACGAATCGCACTGAACGAATCGC tt Single substitution Multiple substitutions T C Coincidental substitutions Parallel substitutions Convergent substitutions Back substitutions T C A A G A A T Although there has been 12 mutations, only 3 can be detected

69
Sequence dissimilarity D = (1 – I (t) ) Time Due to multiple substitutions, the observed number of differences between two sequence is less than the true number of substitutions 0 1 Proportion of observed differences Proportion of actual differences
 ) Time Due to multiple substitutions, the observed number of differences between two sequence is less than the true number of substitutions 0 1 Proportion of observed differences Proportion of actual differences")
70
Sequence dissimilarity D = (1 – I (t) ) Time Models of sequence evolution can be used to “correct” for multiple hits 0 1 Distance correction
 ) Time Models of sequence evolution can be used to correct for multiple hits 0 1 Distance correction")
71
Estimating the number of nucleotide substitutions under the Jukes and Cantor’s One-Parameter Model As we have seen, the expected proportion of identical nucleotides between two sequences that diverged t time units ago is given by: I (t) = ¼ + ¾ e -8 t
 = ¼ + ¾ e -8 t")
72
Estimating the number of nucleotide substitutions under the Jukes and Cantor’s One-Parameter Model And the probability that the two sequences are different at a site at time t is: I (t) = ¼ + ¾ e -8 t p = 1 - I (t)
 = ¼ + ¾ e -8 t p = 1 - I (t)")
73
Estimating the number of nucleotide substitutions under the Jukes and Cantor’s One-Parameter Model Doing some algebra: p = 1 - (¼ + ¾ e -8 t ) p = ¾ (1 - e -8 t ) 8 t = - ln (1 - 4p/3) p = 1 - I (t) And since in the JC model K = 2(3 t) between two sequences: K = - (¾) ln (1 - (4/3)p)
 p = ¾ (1 - e -8 t ) 8 t = - ln (1 - 4p/3) p = 1 - I (t) And since in the JC model K = 2(3 t) between two sequences: K = - (¾) ln (1 - (4/3)p)")
74
Estimating the number of nucleotide substitutions under the Kimura two-Parameter Model where: And P and Q are the proportions of transitional and transversional differences between the two sequences K = (½) ln(a) + (¼)ln(b) a = 1/ (1 - 2P - Q) b = 1/ (1 - 2Q)
 ln(a) + (¼)ln(b) a = 1/ (1 - 2P - Q) b = 1/ (1 - 2Q)")
75
Estimating the number of nucleotide substitutions using the Poisson Correction for protein sequences

76
M C A N T P L … P (k) = e -rt (rt) k / k! P (0) = e -rt P (1) = e -rt P (2) = e -rt (rt) 2 / 2! P (n) = e -rt (rt) n / n! P (substitutions)
 = e -rt (rt) n / n. P (substitutions).")
77
Estimating the number of nucleotide substitutions using the Poisson Correction for protein sequences Sec A Sec 1 Sec 2 e –rt q = (e –rt ) 2 e –2rt = 1 - p The probability that none of the sequences has suffered a substitution is: K = 2rt Doing a little algebra: K = - ln (1 - p) e –K = 1 - p
 2 e –2rt = 1 - p The probability that none of the sequences has suffered a substitution is: K = 2rt Doing a little algebra: K = - ln (1 - p) e –K = 1 - p")
78
Genetic distance using Poisson Correction

79
Trees

80
A phylogeny and the three basic kinds of tree used to depict that phylogeny After Page and Holmes (1998) ABC time Character change Phylogeny ABC Cladogram ABC Additive tree ABC 5 0 Ultrametric tree
 ABC time Character change Phylogeny ABC Cladogram ABC Additive tree ABC 5 0 Ultrametric tree")
81
Distance Methods for Phylogenetic Inference

82
[ 1 2 3 4 5 6 7 8 9 10] [ 1] [ 2] 0.009 [ 3] 0.000 0.009 [ 4] 0.000 0.009 0.000 [ 5] 0.000 0.009 0.000 0.000 [ 6] 0.009 0.019 0.009 0.009 0.009 [ 7] 0.009 0.019 0.009 0.009 0.009 0.000 [ 8] 0.098 0.108 0.098 0.098 0.098 0.108 0.108 [ 9] 0.098 0.108 0.098 0.098 0.098 0.108 0.108 0.000 [ 10] 0.088 0.098 0.088 0.088 0.088 0.098 0.098 0.009 0.009 Distance Matrix
![[ ] [ 1] [ 2] [ 3] [ 4] [ 5] [ 6] [ 7] [ 8] [ 9] [ 10] Distance Matrix](http://images.slideplayer.com/31/9741281/slides/slide_82.jpg "[ ] [ 1] [ 2] [ 3] [ 4] [ 5] [ 6] [ 7] [ 8] [ 9] [ 10] Distance Matrix")
83
In order for a distance measure to be used to build phylogenies it must satisfy some basic requeriments It must be metric It must be additive

84
Metric distances A distance is metric if: 1 d (a,b) 0 (non-negativity) a sequence b sequence d (a,b) 2 d (a,b) = d (b,a) (symetry) 3 d (a,c) d (a,b) + d (b,c) (triangle inequality) 4 d (a,b) = 0 if and only if a = b (distinctiness)
 0 (non-negativity) a sequence b sequence d (a,b) 2 d (a,b) = d (b,a) (symetry) 3 d (a,c) d (a,b) + d (b,c) (triangle inequality) 4 d (a,b) = 0 if and only if a = b (distinctiness)")
85
Ultrametric distances 5 d (a,b) maximum [d (a,c), d (b,c)] A distance is ultrametric if: a b c 4 6 6 An ultrametric distance have the property of implying a constant evolutionary rate
![Ultrametric distances 5 d (a,b) maximum [d (a,c), d (b,c)] A distance is ultrametric if: a b c An ultrametric distance have the property of implying a constant evolutionary rate](http://images.slideplayer.com/31/9741281/slides/slide_85.jpg "Ultrametric distances 5 d (a,b) maximum [d (a,c), d (b,c)] A distance is ultrametric if: a b c An ultrametric distance have the property of implying a constant evolutionary rate")
86
Additive distances Four point condition: d (a,b) + d (c,d) maximum [d (a,c) + d (b,d), d (a,d) + d (b,c)] a b c d
![Additive distances Four point condition: d (a,b) + d (c,d) maximum [d (a,c) + d (b,d), d (a,d) + d (b,c)] a b c d](http://images.slideplayer.com/31/9741281/slides/slide_86.jpg "Additive distances Four point condition: d (a,b) + d (c,d) maximum [d (a,c) + d (b,d), d (a,d) + d (b,c)] a b c d")
87
a b c d abcdabcd 10 10 10 6 2 a b c d 2 6 6 10 1 1 2 2 3 5 An ultrametric distance matrix between four sequences and the corresponding ultrametric tree

88
a b c d abcdabcd 14 10 9 7 3 6 6 3 7 9 10 14 a b c d 5 1 1 2 1 6 An aditive distance matrix between four sequences and the corresponding additive tree

89
Unweighted Pair-group Method using Arithmetic averages (UPGMA) OTUABC Bd AB Cd AC d BC Dd AD d BD d CD OTU
 OTUABC Bd AB Cd AC d BC Dd AD d BD d CD OTU")
90
Unweighted Pair-group Method using Arithmetic averages (UPGMA) OTUABC Bd AB Cd AC d BC Dd AD d BD d CD OTU
 OTUABC Bd AB Cd AC d BC Dd AD d BD d CD OTU")
91
Unweighted Pair-group Method using Arithmetic averages (UPGMA) A B d AB /2
 A B d AB /2")
92
OTU(AB)C Cd (AB)C Dd (AB)D d CD OTU Unweighted Pair-group Method using Arithmetic averages (UPGMA) d (AB)C = ( d AC + d BC )/2 d (AB)D = ( d AD + d BD )/2
C Cd (AB)C Dd (AB)D d CD OTU Unweighted Pair-group Method using Arithmetic averages (UPGMA) d (AB)C = ( d AC + d BC )/2 d (AB)D = ( d AD + d BD )/2")
93
OTU(AB)C Cd (AB)C Dd (AB)D d CD OTU Unweighted Pair-group Method using Arithmetic averages (UPGMA)
C Cd (AB)C Dd (AB)D d CD OTU Unweighted Pair-group Method using Arithmetic averages (UPGMA)")
94
A B C d (AB)C /2
C /2")
95
Unweighted Pair-group Method using Arithmetic averages (UPGMA) d (ABC)D /2 = [(d AD + d BD + d CD )/ 3]/ 2 A B C D
![Unweighted Pair-group Method using Arithmetic averages (UPGMA) d (ABC)D /2 = [(d AD + d BD + d CD )/ 3]/ 2 A B C D](http://images.slideplayer.com/31/9741281/slides/slide_95.jpg "Unweighted Pair-group Method using Arithmetic averages (UPGMA) d (ABC)D /2 = [(d AD + d BD + d CD )/ 3]/ 2 A B C D")
96
Unweighted Pair-group Method using Arithmetic averages (UPGMA) d XY = d ij / (n X n Y ) Assumes a constant molecular clock Estimates tree topology and branch length
 d XY = d ij / (n X n Y ) Assumes a constant molecular clock Estimates tree topology and branch length")
97
Minimum Evolution Method In this method, the sum (S) of all branch length estimates is computed for all or all plausible topologies and the topology that has the smallest S value is chosen as the best tree. S = b i i T

98
Neighbor-Joining Method The principle of N-J method is to find neighbors sequentially that may minimize the total lenght of the tree X 1 2 3 4 5 6 7 8 This method strarts with a starlike tree: Y 1 23 4 5 6 7 8 X The first step is to separate a pair of OTUs from all others: And among all the posible pair of OTUs the one with the smallest sum of branch lenghts is chosen. This procedure is repeated until all interior branches are found. 1 2 3 4 5 6 7 8

Similar presentations


 or Evolutionary tree represents the evolutionary relationships among a set of organisms or groups of.>")


 split from each other Simply.>")
 and likelihood methods, pairwise distance methods form the third large group of methods to infer evolutionary trees.>")

