Download presentation
Presentation is loading. Please wait.

1
+ Unit 7: Sampling Distributions Lesson 3: Sample Means

2
Starter The superintendent of a large school district wants to know what proportion of middle school students in her district are planning to attend a 4-year college or university. Suppose that 80% of all middle school students in her district are planning to attend a 4-year college or university. What is the probability that a simple random sample of size 125 will give a result that is within 7 percentage points of the true value?

3
+ Sample Means Sample proportions arise most often when we are interested in categorical variables. When we record quantitative variables we areinterested in other statistics such as the median or mean or standarddeviation of the variable. Sample means are among the mostcommon statistics. Consider the mean household earnings for samples of size 100. Compare the population distribution on the left with the samplingdistribution on the right. What do you notice about the shape, center,and spread of each?

4
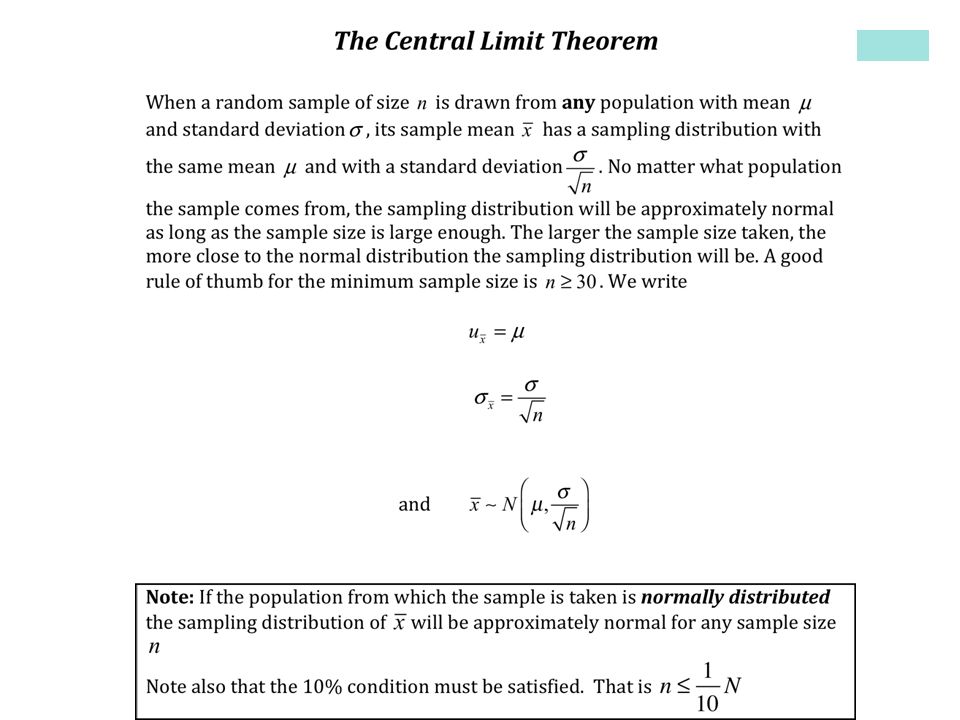
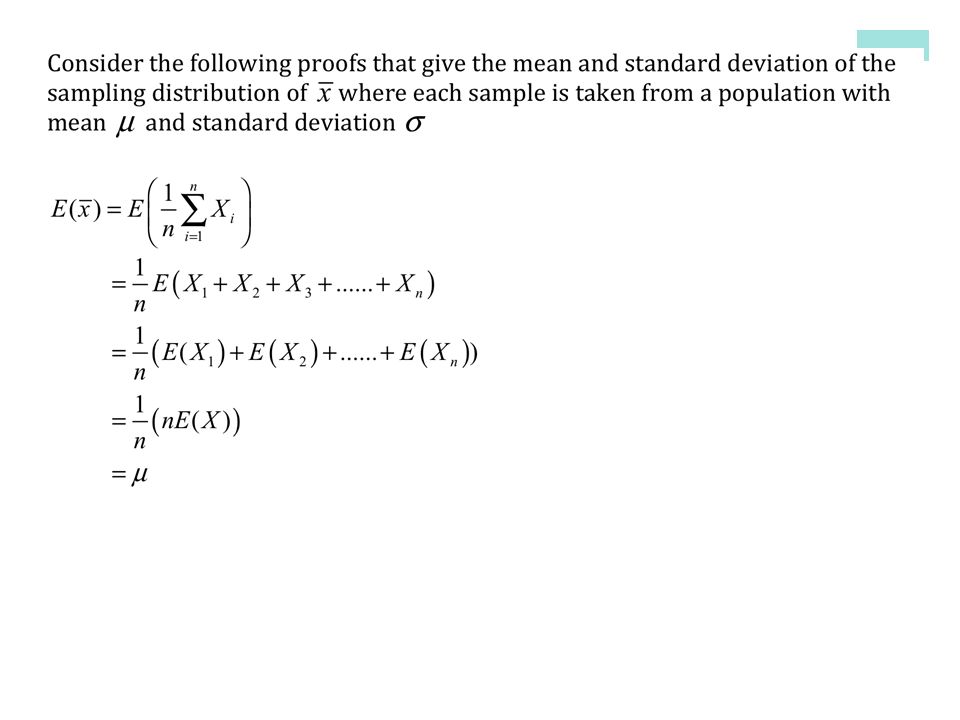
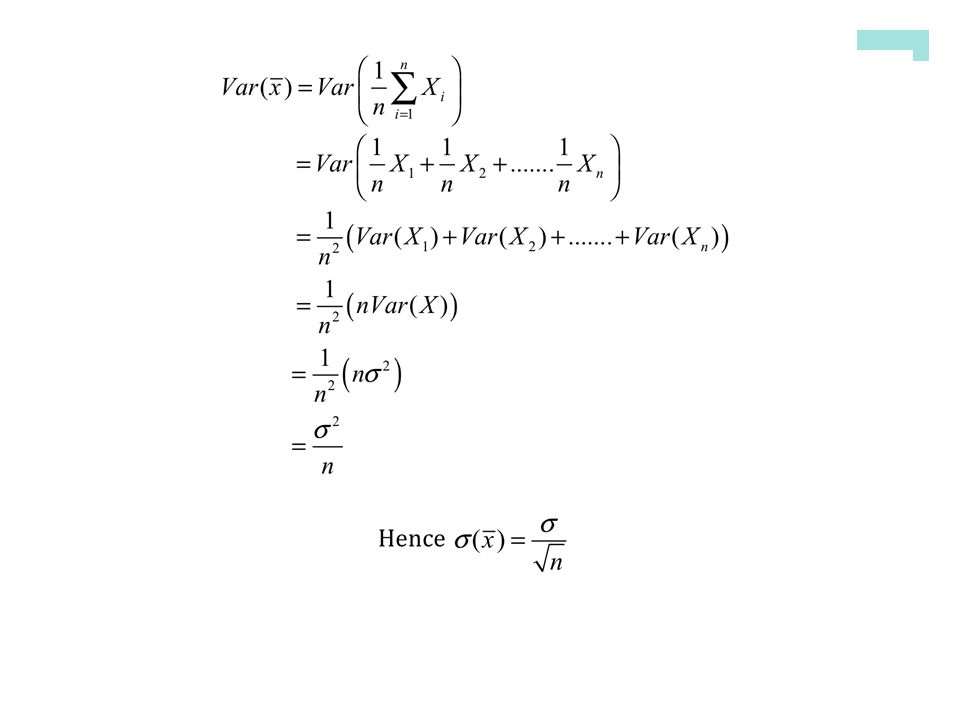
+ The Sampling Distribution of When we choose many SRSs from a population, the sampling distribution of the sample mean is centered at the population mean µ and is less spread out than the population distribution. Here are the facts. as long as the 10% condition is satisfied: n ≤ (1/10)N. Mean and Standard Deviation of the Sampling Distribution of Sample Means
N. Mean and Standard Deviation of the Sampling Distribution of Sample Means.")
5
+ Sampling from a Normal Population Sampling Distribution of a Sample Mean from a Normal Population

6
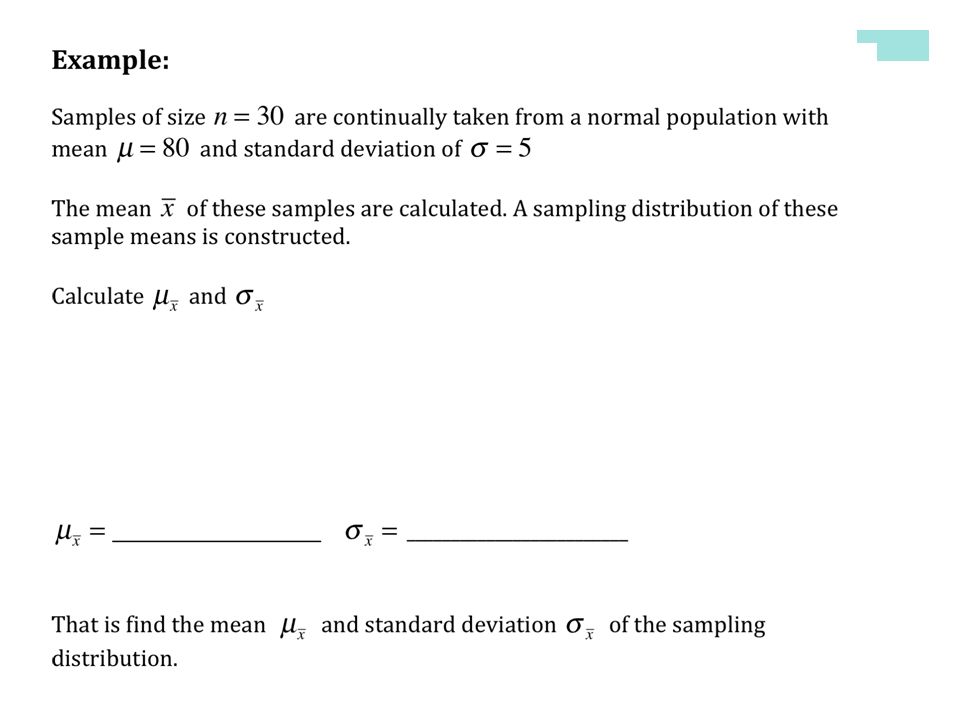
Example: Young Women’s Heights The height of young women follows a Normal distribution with mean µ = 64.5 inches and standard deviation σ = 2.5 inches. Find the probability that a randomly selected young woman is taller than 66.5 inches. Let X = the height of a randomly selected young woman. X is N(64.5, 2.5) The probability of choosing a young woman at random whose height exceeds 66.5 inches is about 0.21. Find the probability that the mean height of an SRS of 10 young women exceeds 66.5 inches. For an SRS of 10 young women, the sampling distribution of their sample mean height will have a mean and standard deviation Since the population distribution is Normal, the sampling distribution will follow an N(64.5, 0.79) distribution. It is very unlikely (less than a 1% chance) that we would choose an SRS of 10 young women whose average height exceeds 66.5 inches.
 The probability of choosing a young woman at random whose height exceeds 66.5 inches is about Find the probability that the mean height of an SRS of 10 young women exceeds 66.5 inches. For an SRS of 10 young women, the sampling distribution of their sample mean height will have a mean and standard deviation Since the population distribution is Normal, the sampling distribution will follow an N(64.5, 0.79) distribution. It is very unlikely (less than a 1% chance) that we would choose an SRS of 10 young women whose average height exceeds 66.5 inches..")
11
+ The Central Limit Theorem Most population distributions are not Normal. What is the shape of the sampling distribution of sample means when the population distribution isn ’ t Normal? It is a remarkable fact that as the sample size increases, the distribution of sample means changes its shape: it looks less like that of the populationand more like a Normal distribution! When the sample is large enough, thedistribution of sample means is very close to Normal, no matter what shape the population distribution has, as long as the population has a finite standard deviation. Note: How large a sample size n is needed for the sampling distribution to be close to Normal depends on the shape of the population distribution. More observations are required if the population distribution is far from Normal. Definition:

12
+ The Central Limit Theorem Consider the strange population distribution from the Rice University sampling distribution applet. Describe the shape of the sampling distributions as n increases. What do you notice? Normal Condition for Sample Means

13
Example: Servicing Air Conditioners Based on service records from the past year, the time (in hours) that a technician requires to complete preventative maintenance on an air conditioner follows the distribution that is strongly right-skewed, and whose most likely outcomes are close to 0. The mean time is µ = 1 hour and the standard deviation is σ = 1 Your company will service an SRS of 70 air conditioners. You have budgeted 1.1 hours per unit. Will this be enough? Since the 10% condition is met (there are more than 10(70)=700 air conditioners in the population), the sampling distribution of the mean time spent working on the 70 units has The sampling distribution of the mean time spent working is approximately N(1, 0.12) since n = 70 ≥ 30. If you budget 1.1 hours per unit, there is a 20% chance the technicians will not complete the work within the budgeted time. We need to find P(mean time > 1.1 hours)
=700 air conditioners in the population), the sampling distribution of the mean time spent working on the 70 units has The sampling distribution of the mean time spent working is approximately N(1, 0.12) since n = 70 ≥ 30. If you budget 1.1 hours per unit, there is a 20% chance the technicians will not complete the work within the budgeted time. We need to find P(mean time > 1.1 hours).")
Similar presentations