Download presentation
Presentation is loading. Please wait.

1
Life course partnership status and biomarkers in mid-life: Evidence from the 1958 British birth cohort George B. Ploubidis, Richard J. Silverwood, Bianca DeStavola & Emily Grundy Website http://pathways.lshtm.ac.uk Emailpathways@lshtm.ac.uk Twitter@pathwaysNCRM

2
Outline Background A longitudinal typology of partnership status over the life course Results from the 1958 birth cohort Summary Limitations

3
Background Previous studies have shown that marital status is associated with health outcomes and mortality With a few exceptions studies of marital status and health have considered only current marital status or transitions over relatively short periods The accumulated benefits and risks of marital status trajectories over the lifecourse have not being studied

4
Background - II Only a few studies have considered the association between non-marital cohabitation and health Non –marital cohabitation is becoming more common Most studies have employed self-reported measures In the few studies where objective health indicators were used, sample sizes were relatively small

5
Objectives We employed a population based birth cohort and a modelling approach that allows us to capture stability as well as change in partnership status over the lifecourse Investigate the cumulative effect that different trajectories of partnership status over the life-course have on biomarkers in mid-life

6
Sample The British 1958 birth cohort includes all persons born in England, Scotland and Wales during one week in March 1958 Cohort members have been followed-up periodically from birth into adulthood. Our outcomes are derived from the clinical examination in their home (2002 – 2004) Marital status and non marital cohabitation have been recorded from sweep 4 (1981) @ 23 We are using data from sweep4 (1981, age 23), sweep5 (1991, age 33), sweep6 (2000 age 42) and the biomedical survey (2002- 2004 age 44 – 46) to derive the partnership status trajectories Early life variables derived from sweeps 0 – 3 (ages 1 – 16)
 Marital status and non marital cohabitation have been recorded from sweep 4 23 We are using data from sweep4 (1981, age 23), sweep5 (1991, age 33), sweep6 (2000 age 42) and the biomedical survey ( age 44 – 46) to derive the partnership status trajectories Early life variables derived from sweeps 0 – 3 (ages 1 – 16).")
7
Measures I Outcomes Inflammatory and haemostatic biomarkers: Fibrinogen, C – Reactive Protein (CRP), Von Willebrand Factor (VWF), Tissue plasminogen activator antigen (TPA) and Fibrin D- dimer (Ddimer). Metabolic syndrome: characterized using the International Diabetes Federation definition Respiratory function: Scores on Force Vital Capacity - the maximum amount of air a person can expel from the lungs after a maximum inhalation.

8
Measures - II Confounders All models adjusted for early life SEP (summary of various indices) Cognitive ability @ 10 Early life health status (various) Education @ 23, self reported health status @ 23 and 33, BMI @ 23 Lab processing variables
 Cognitive 10 Early life health status (various) 23, self reported health 23 and 33, 23 Lab processing variables")
9
Measures III – Partnership status indicators We included participants with valid responses in at least three indicators : Men = 4970, Women = 5256 MenWomenMenWomen f%f%f%f% Married at 23No408365.2286145.6Cohabiting at 23No *592394.6581392.8 Yes217934.8340954.4Yes3365.44547.2 Married at 33No166031.0156927.9Cohabiting at 33No478089.2509090.4 Yes370169.0406372.1Yes58110.85429.6 Married at 40No164429.4166728.9Cohabiting at 40No505990.5525191.1 Yes394870.6409871.1Yes5329.55148.9 Married at 42No122027.0132528.9Cohabiting at 42No392187.8396787.9 Yes330373.0326271.1Yes54312.254712.1 Remarried by 42No 8714 90.8 7945 88.7 Yes 8819.2101411.3

10
Partnership status indicators – Too many patterns

11
Data Reduction A data reduction method is needed - the number of possible response patterns in theory is 2 9 = 512 (complete cases only) However since participants who are married cannot simultaneously be non – married cohabiters, there are three responses available at each wave Distinct response patterns: 2 x (3 4 ) = 162 (complete cases) Including missing data results to 325 distinct patterns for men and 316 for women
 However since participants who are married cannot simultaneously be non – married cohabiters, there are three responses available at each wave Distinct response patterns: 2 x (3 4 ) = 162 (complete cases) Including missing data results to 325 distinct patterns for men and 316 for women")
12
Latent Class Analysis The probability for each item u j (from a set of J observed items) is the product the of conditional probability of u j, given membership in class K, summed over the latent classes Given conditional independence on latent class membership, the marginal probability for the vector of responses U is given by:
 is the product the of conditional probability of u j, given membership in class K, summed over the latent classes Given conditional independence on latent class membership, the marginal probability for the vector of responses U is given by:")
13
C i1i1 i2i2 i5i5 i3i3 i4i4 i6i6 i7i7 i8i8 i9i9

14
Statistical Modelling Latent Class Analysis – introduces a discrete latent variable Forms latent classes - groups (trajectories) based on the pattern of responses to the observed indicators Captures heterogeneity – does not assume a single rate of change/single curve LCA classification used in further analysis with appropriate link functions for the nature of the outcomes (linear and logit models) All models in Mplus 7.0, estimated with MLR, Monte Carlo integration. Missing data handled with FIML assuming MAR

15
Education @ 23 Biomarkers @ 42 Health, BMI @23 Early life SEP, Health, Cognitive ability Partnership Status 23 - 42

16
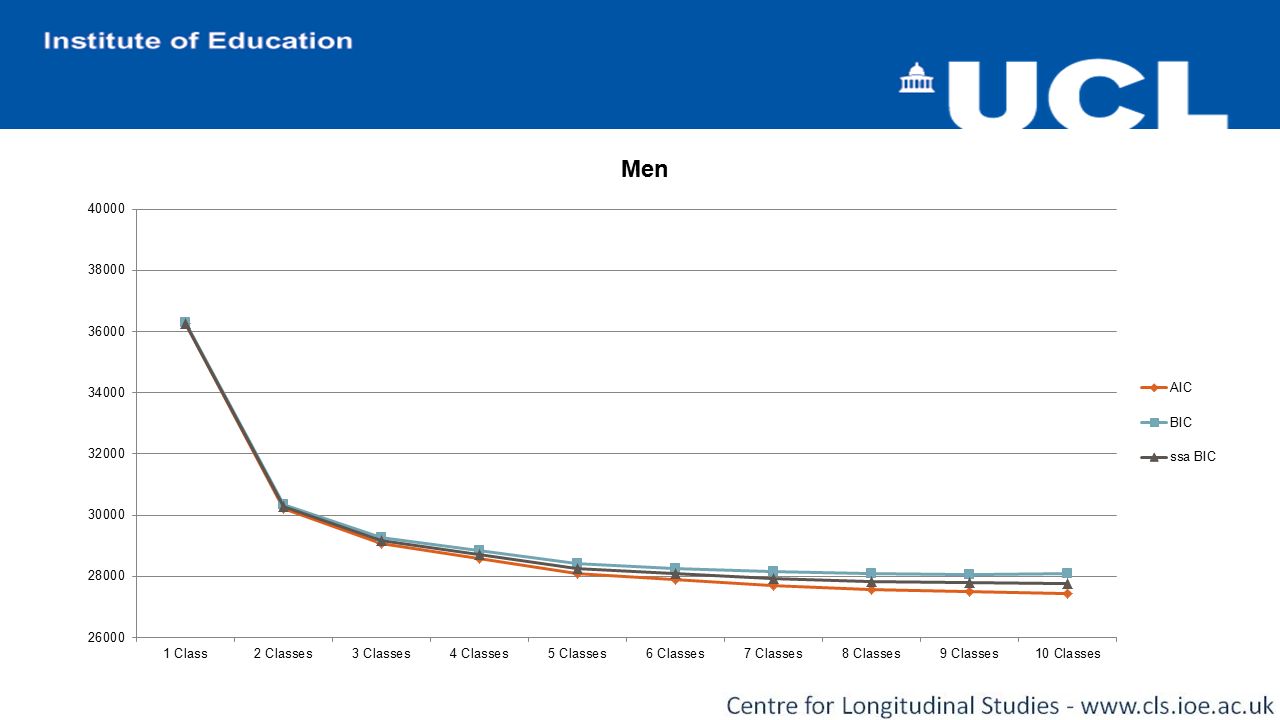
Results I – Model selection MenParametersLog-LikelihoodAICBICssa BICEntropyBLRTp 1 Class 9-18113.06336244.12636302.55736273.9581.000 2 Classes 19-15085.06330208.12730331.48030271.1050.9276056.0010.001 3 Classes 29-14513.20329084.40629272.68229180.5300.9461143.7210.001 4 Classes 39-14248.34628574.69328827.89228703.9640.931529.7130.001 5 Classes 49-14004.85628107.71328425.83528270.1300.909486.9810.001 6 Classes 59-13881.34327880.68728263.73128076.2500.922247.0260.001 7 Classes 69-13779.31527696.62928144.61227925.3390.925204.0580.001 8 Classes 79-13704.20427566.40728079.29827828.2640.912150.2220.001 9 Classes 89-13657.88327493.76728071.58027788.7700.92192.6410.001 10 Classes 99-13624.71127447.42128090.15627775.5700.92466.3470.001

18
Men

19
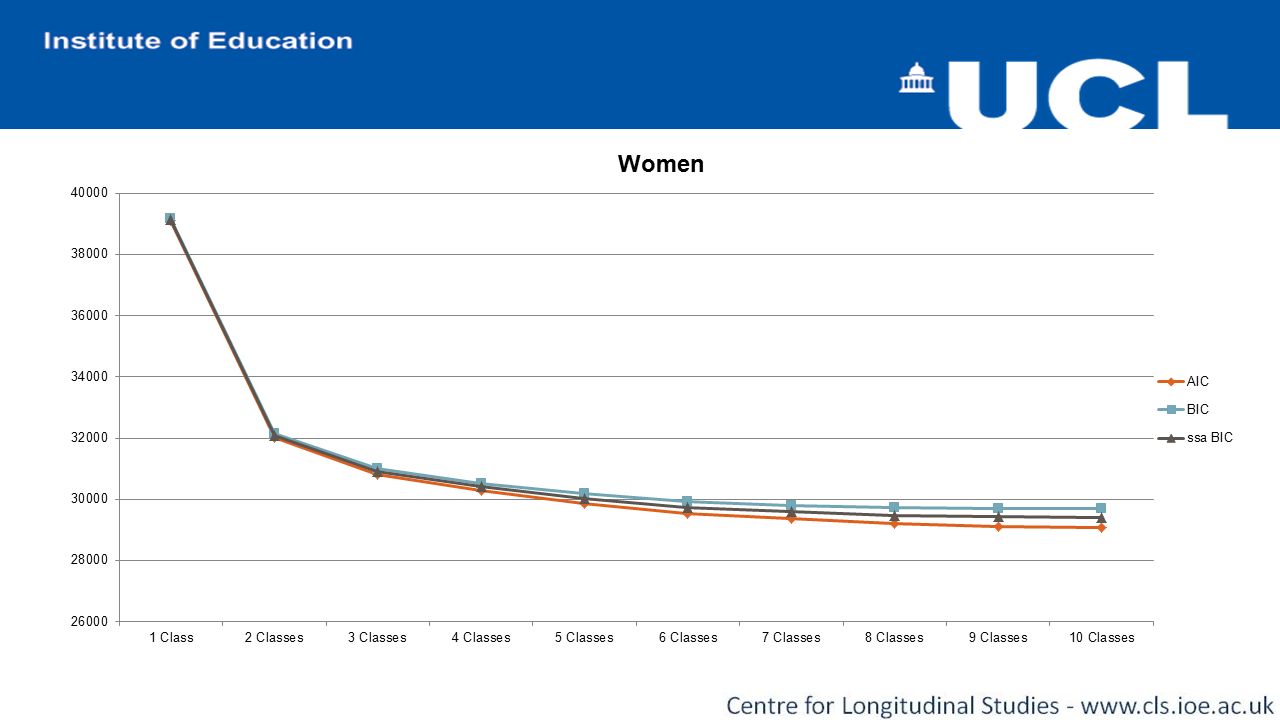
Results II – Model Selection Women ParametersLog-LikelihoodAICBICssa BICEntropyBLRTp 1 Class 9-19548.12839114.25539173.19339144.5941.000 2 Classes 19-15989.38532016.77132141.19632080.8200.9457117.4850.001 3 Classes 29-15383.93830825.87531015.78730923.6350.9621210.8950.001 4 Classes 39-15100.21730278.43530533.83430409.9050.940567.4400.001 5 Classes 49-14884.45029866.89930187.78530032.0790.918431.5360.001 6 Classes 59-14710.59029539.18029925.55329738.0710.905347.7190.001 7 Classes 69-14612.64029363.27929815.13929595.8800.916195.9010.001 8 Classes 79-14524.97129207.94229725.28929474.2530.935175.3370.001 9 Classes 89-14476.32829130.65629713.48929430.6770.93397.2860.001 10 Classes 99-14436.95929071.91829720.23929405.6500.93878.7370.001

21
Women

22
Results - Men

23
Results - Women

24
Summary Partnership status patterns are associated with biomarkers in mid adulthood The observed effects differed between men and women implying that the mechanisms that link partnership status and health may be gender specific In men, those that never married or cohabited (Class 6) had significantly higher levels on three haemostatic function biomarkers and worse respiratory function compared to men that were married and remained married (Class 1)
 had significantly higher levels on three haemostatic function biomarkers and worse respiratory function compared to men that were married and remained married (Class 1)")
25
Summary - II In women those that married in mid/late 20’s or early 30’s and remained married for the whole observation period had the best health Women that never married or cohabited had worse health compared to married women However, this effect was only manifested in fibrinogen levels Not marrying or cohabiting is less detrimental in women compared to men Being married appears to be more beneficial to men

26
Summary - III We found that with the exception of worse respiratory function in men, non-marital cohabitation has similar effects to being married on mid-life health Not married cohabiters of both genders did not differ from married participants in the biomarkers used in our study For both genders transitions from and to marriage or non- marital cohabitation do not have a detrimental effect on mid- life health

27
Limitations Despite the wealth of the 1958 cohort, bias due to unknown unmeasured confounders cannot be ruled out Sensitivity analysis where potential confounders were simulated supported our results The longitudinal typology captured the cumulative effect over 21 years of trajectories of partnership status in biomarkers in mid-life Investigation of the short term effects of events such as marital dissolution not possible with this approach

28
More limitations Data on partnership status were based on self-reports. Although the latent variable specification of our longitudinal typology controls for measurement error, response bias may have influenced our results Our results can only be generalised to those born in 1958 and perhaps to other cohorts born close to this year

29
Thank you for your attention

Similar presentations