Download presentation
Presentation is loading. Please wait.

1
Managing Micronutrients with Soil (Plant) Testing and Fertilizer
 Testing and Fertilizer")
2
What Is Plant Analysis? A tool to monitor or make decisions –Identify nutrient deficiencies and determine nutrient shortages –Determining the nutrient supplying capacity of the soil –Determining the effects of fertilizer application –Study relationships between fertility and plant/crop performance

3
Analysis Tool Analyze whole or specific plant parts for total mineral concentrations What is sampled depends on crop type, stage and type of information you wish to gain

4
The When, Where and What Corn VE-V4 –Whole plant V5-V16 –Upper most developed leaf V17-R1 –Leaf at the ear R2-R6 –Not Recommended

5
The When, Where and What Soybean Emergence to Pre- bloom Whole plant Bloom to R3 Most recently mature trifoliate After R3 Not recommended

6
The When, Where and What Wheat Prefer the whole plant until heading If taking flag leaf samples for N, must have 100+ flag leaves After heading –Not recommended

7
Miscellaneous crops –Alfalfa Top 1/3 of the plant –Grain sorghum/Milo 2 nd collared leaf from the top –Pasture grasses Whole plants –Anything else call and we can discuss what to sample Dry beans, potatoes, oats, cotton, vegetable crops, trees, nut trees

8
Corn 10-14 leaf stage

9
Corn at Tassel

10
Plant Analysis Diagnose growth problems within a field –Slow crop growth –Poor color Monitor nutrient level –Avoid hidden hunger

11
Deficiency Symptoms Nitrogen Older leaves turn light green to yellow color and spindly growth. Phosphorus Blue-green color, stiff, stunted and erect growth. Leaflets often fold together, and the undersides and stems may be red or purplish. Potassium Light green to yellow color and spindly growth.

12
Deficiency Symptoms Magnesium Older leaves turn yellow at the edge, similar to K Sulfur Sulfur Deficiency: Light green, similar to N deficiency, spindly stems and weak growth.

13
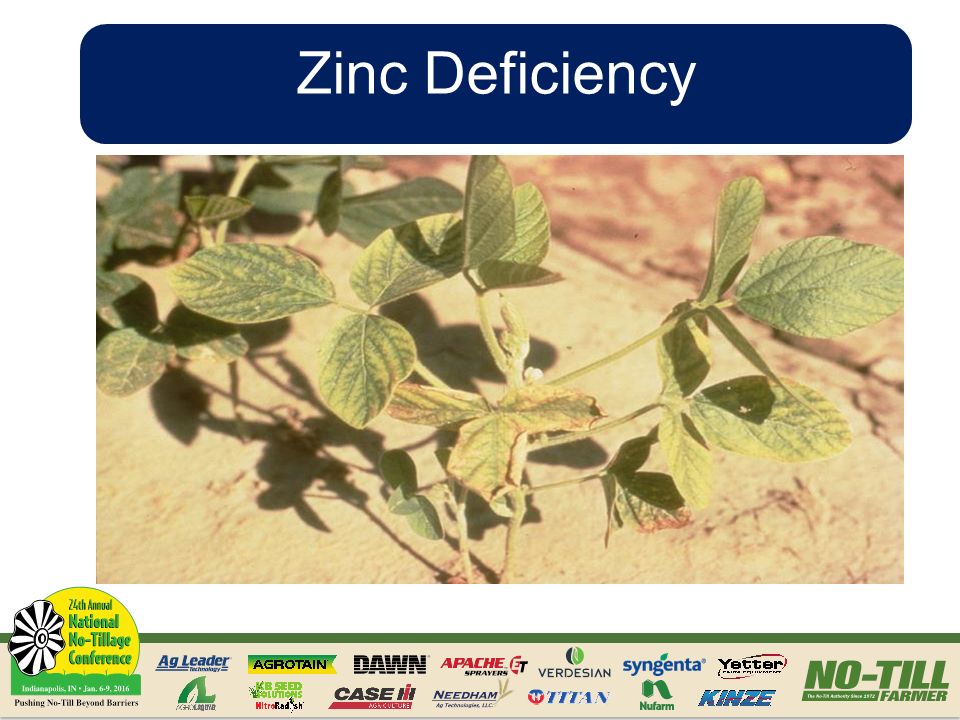
Copper –Leaves are dark green, plant is stunted Iron –Yellowing occurs between the veins of young leaves Manganese –Yellowing pattern is not as distinct as with iron Zinc –Shortened internodes, yellowing on mid-leaves across veins Deficiency Symptoms

14
Boron –Terminal buds die, lower leaves misshapen, shortened internodes Chloride –Wilting and reduced leaf growth Molybdenum –Appear as N deficiency, stunted growth, and chlorosis Deficiency Symptoms

15
Plant Nitrogen Corn Leaf Stage % N 3-53.5 – 5.0 6-93.2 – 4.8 10-143.0 – 4.0 15-182.8 – 3.5 Tassel2.7 – 3.4

16
Corn Leaf Stage % P 3-5.35 -.55 6-9.28 -.38 10-14.26 -.38 15-18.26 -.37 Tassel.25 -.35 Plant Phosphorus

17
Corn Leaf Stage % K 3-52.5 – 3.5 6-92.3 – 3.5 10-142.2 – 3.0 15-182.1 – 2.6 Tassel2.0 – 2.6 Plant Potassium

18
Corn Stage % S 3-5.20 -.28 6-9.15 -.28 10-14.15 -.26 15-18.15 -.26 Tassel.15 -.26 Plant Sulfur

19
Nitrogen:Sulfur Ratio Ideal 12 to 15 Marginal16-18 Deficient19 and greater Plant Ratios

20
Nitrogen:Magnesium Ratio Less than 11Greater than 11 ------------Corn yield-------------- 169.5 bu/A202.5 bu/A Bob Miller (CSU) Ratio Study
 Ratio Study")
21
169.5 Bu/A 202.5 bu/A %N2.702.92 %K1.652.04 N:K1.761.44 %Mg.354.219 Mg:K.217.108 Bob Miller (CSU) Ratio Study
 Ratio Study")
22
Zinc Deficiency

23
Corn Stageppm Zn 3-9 Leaf20 – 60 10-1819 – 60 Tassel18 – 60 Plant Zinc

24
Zinc Deficiency

26
Zinc Soil (DTPA) Test and Recommendations Corn Rate Soil Test ppm Zn lb Zn/A 0-0.258-10 0.26-0.505-7 0.51-.753-4 0.76-1.001-2 1.01+None *Annual rate: Divide Corrective Rate by 6.
 Test and Recommendations Corn Rate Soil Test ppm Zn lb Zn/A None *Annual rate: Divide Corrective Rate by 6.")
27
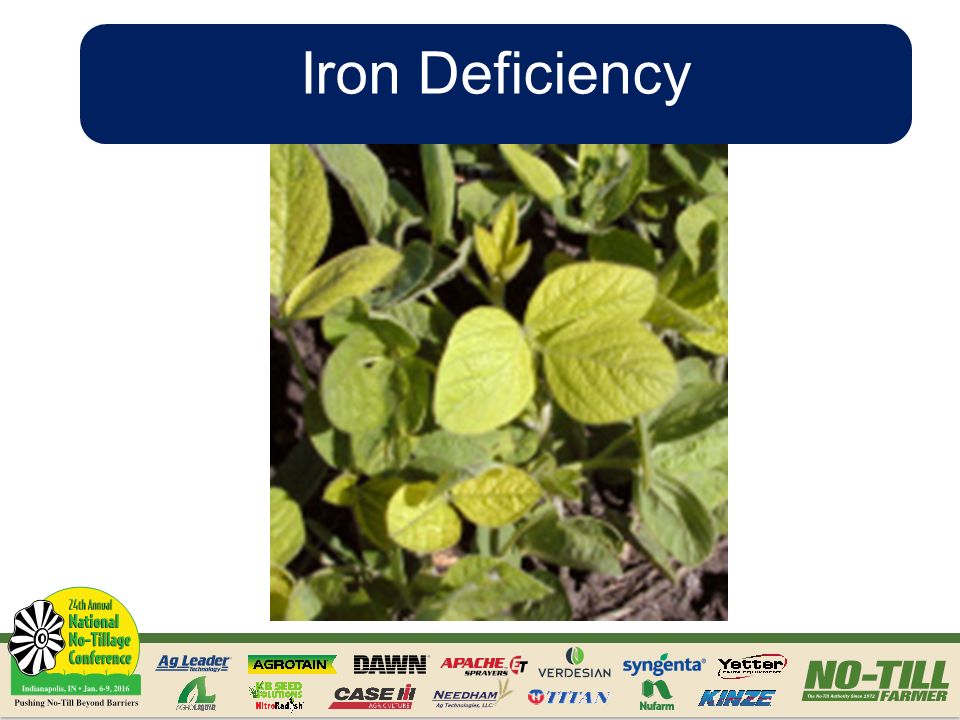
Iron Deficiency

29
Caused by calcareous soil condition Bicarbonate precipitates iron in leaves so the plant cannot use the iron Apply sulfate to reduce bicarbonate uptake by the plant Iron Chlorosis

30
Manganese Deficiency

31
Corn Stageppm Mn 3-14 Leaf30 – 160 15-Tassel20 - 150 Plant Manganese

32
Manganese Soil Test (DTPA) and Recommendations Rate Mn Soil Test, ppmRating Lbs Mn/A 0-0.5V Low12 0.6-1.5Low7-12 1.6 – 3.0Medium1-6 3.1+ High 0
 and Recommendations Rate Mn Soil Test, ppmRating Lbs Mn/A 0-0.5V Low Low – 3.0Medium High 0")
33
Corn Stageppm Cu All leaf stages5 - 20 Plant Copper

34
Copper Soil Test (DTPA) and Recommendations Cu Soil Test, ppm RatingLbs Cu/A 0-0.10V Low3-6 0.11-0.20 Low1-2 0.21-0.30Medium 0 0.31-0.60High* 0 0.61+V High 0 * Specialty crops get Copper up to 0.60 ppm ** Corrective application rate
 and Recommendations Cu Soil Test, ppm RatingLbs Cu/A V Low Low Medium High* V High 0 * Specialty crops get Copper up to 0.60 ppm ** Corrective application rate")
35
Boron Deficiency in Corn

36
Corn Stageppm B 3-18 leaf5 – 25 Tassel4 – 25 Plant Boron

37
Boron Soil Test and Recommendations Boron, ppm RatingLbs B/A 0 – 0.25Low0.5 – 3.0 0.26 – 0.50Medium0.0 – 1.7 0.51 +High 0 Alfalfa, clover, peanuts, cotton and sugar beets require more boron than other crops.

38
Chloride Deficiency

39
Corn Stage % Cl 3-90.10 - 0.5 10-180.15 - 0.5 Tassel0.18 - 0.5 Plant Chloride

40
Chloride Deficiency

41
Chloride Soil Tests and Cl Recommendations Soil Test, ppm Cllbs of Cl/A < 4 ppm Cl 20 lbs/A 4 – 6 ppm Cl10 lbs/A > 6 ppm Cl 0 lbs/A KSU based on average Cl in 0 - 24 inch soil root zone.

42
Molybdenum Deficiency

43
Foliar Treatment 2 to 4 ounces of Moly Solution per acre in 20 gallons of water Seed Treatment 0.5 ounce of sodium molybdate per 60 lbs of seed Molybdenum Application

Similar presentations