Download presentation
Presentation is loading. Please wait.

1
A Picture’s Worth a 1000 2 Points: Phodar as an Alternative to LiDAR Peter Gould and Jacob Strunk Washington State Department of Natural Resources

2
3D is the new 2D

3
Phodar (digitial surface models) Computer mimics the human eye (parallax -> distance) Need 2 or more image pairs Lots of software packages (cheap to very expensive) Higher resolution, more pairs should produce a better result Can produce LAS files (same as lidar)
 Computer mimics the human eye (parallax -> distance) Need 2 or more image pairs Lots of software packages (cheap to very expensive) Higher resolution, more pairs should produce a better result Can produce LAS files (same as lidar)")
4
Phodar in Forest Inventory “Drop-in” replacement for lidar 20% of cost of 8 ppm lidar Doesn’t require expensive sensor Doesn’t see the ground (typically need a previous lidar flight)
")
5
Two Experiences with Phodar 1.RS-FRIS Version 1.0 DNR is transitioning to a RS inventory Needs are high and immediate Only about 25% of westside lands had current lidar, but another 50% or so had old lidar Already owned statewide stereo from 2013 NAIP (3 ft pixel).
.")
6
NAIP PHODAR

7
1. RS-FRIS Version 1.0 Fit single models across the westside (several 100 plots) Used climate variables in some cases to try to capture variation in allometric relationships.
 Used climate variables in some cases to try to capture variation in allometric relationships..")
8
Modeling Results

9
Validation Results (3.6 acres)
")
11
Hood Canal Project Can we get more from phodar? What resolution of imagery? Acquisitions Lidar 3” phodar 6” phodar 12” phodar 58 sample plots (randomized grid)
.")
12
Hood Canal Project Is Phodar ready? What resolution of imagery? What are the tradeoffs with lidar? Acquisitions Lidar 3” phodar 6” phodar 12” phodar 58 sample plots (randomized grid)
.")
13
Field Data Acquisition Live and dead trees 1/10 th Acre for trees >= 5.5” DBH 1/40 th acre for trees down to 2” 1/250 th acre for trees down to 1’ ht Canopy cover and closure Moosehorn Spherical densiometer Down wood transects 2 x 50 ft Javad Triumph 2 GPS Android tablets Zip file with SQLite DB, GPS data, photos

14
Hood Canal Project

15
Hood Canal Project Looking down

16
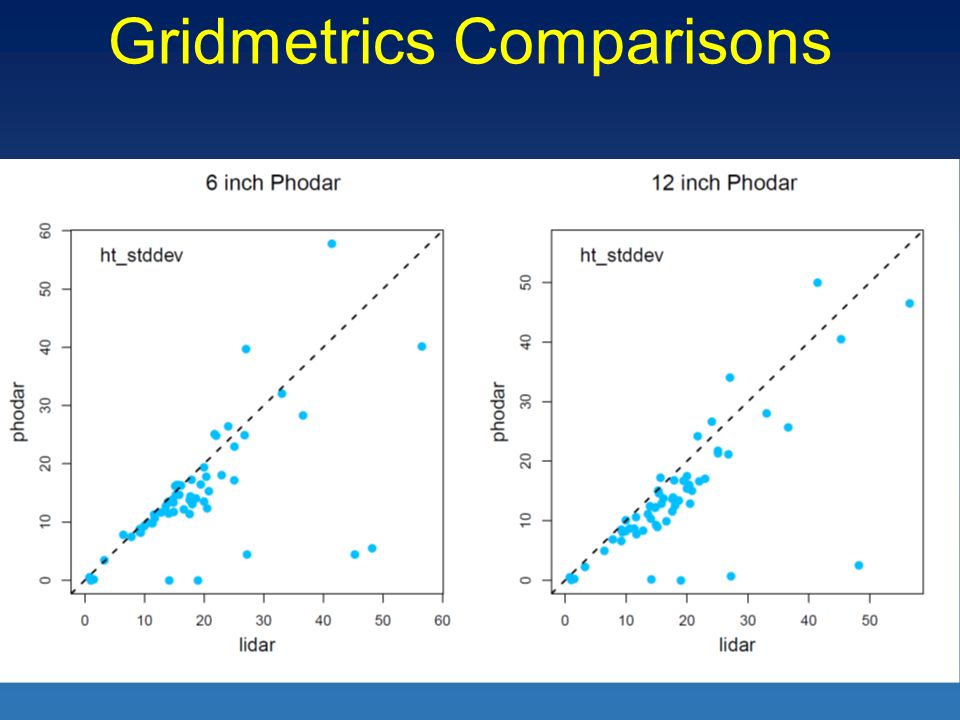
Gridmetrics Comparisons

17
Outlier Plots

19
Gridmetrics Comparisons

21
Modeling Results (best subsets, 3 variables, no interactions) Adjusted R 2 RS DataAll Data (N=58) Minus Outliers (N=53) 12” Phodar83.393.3 6” Phodar74.393.8 Lidar95.895.6 Maximum Height RS DataAll Data (N=58) Minus Outliers (N=53) 12” Phodar80.193.8 6” Phodar75.995.2 Lidar96.196.0 Lorey’s Height
 Adjusted R 2 RS DataAll Data (N=58) Minus Outliers (N=53) 12 Phodar Phodar Lidar Maximum Height RS DataAll Data (N=58) Minus Outliers (N=53) 12 Phodar Phodar Lidar Lorey’s Height")
22
RS DataAll Data (N=58) Minus Outliers (N=53) 12” Phodar78.275.3 6” Phodar63.978.4 Lidar77.579.4 CF Volume RS DataAll Data (N=58) Minus Outliers (N=53) 12” Phodar80.478.9 6” Phodar67.781.9 Lidar77.881.0 BF Volume Modeling Results (best subsets, 3 variables, no interactions) Adjusted R 2
 Minus Outliers (N=53) 12 Phodar Phodar Lidar CF Volume RS DataAll Data (N=58) Minus Outliers (N=53) 12 Phodar Phodar Lidar BF Volume Modeling Results (best subsets, 3 variables, no interactions) Adjusted R 2")
23
RS DataAll Data (N=58) Minus Outliers (N=53) 12” Phodar65.363.1 6” Phodar58.566.2 Lidar72.972.6 Basal Area RS DataAll Data (N=58) Minus Outliers (N=53) 12” Phodar48.341.6 6” Phodar53.853.7 Lidar71.567.6 Curtis’s RD (summation method) Modeling Results (best subsets, 3 variables, no interactions) Adjusted R 2
 Minus Outliers (N=53) 12 Phodar Phodar Lidar Basal Area RS DataAll Data (N=58) Minus Outliers (N=53) 12 Phodar Phodar Lidar Curtis’s RD (summation method) Modeling Results (best subsets, 3 variables, no interactions) Adjusted R 2")
24
RS DataAll Data (N=58) Minus Outliers (N=53) 12” Phodar90.088.9 6” Phodar82.690.3 Lidar95.094.1 Canopy Cover RS DataAll Data (N=58) Minus Outliers (N=53) 12” Phodar93.791.8 6” Phodar82.592.1 Lidar95.093.5 Canopy Closure Modeling Results (best subsets, 3 variables, no interactions) Adjusted R 2
 Minus Outliers (N=53) 12 Phodar Phodar Lidar Canopy Cover RS DataAll Data (N=58) Minus Outliers (N=53) 12 Phodar Phodar Lidar Canopy Closure Modeling Results (best subsets, 3 variables, no interactions) Adjusted R 2")
25
Conclusions Phodar is in the running Not a clear improvement at 6” vs 12” Room for improvement Acquisition spec (more overlap) Processing software makes a difference Can test processing strategies
 Processing software makes a difference Can test processing strategies")
Similar presentations


 data processing and its usage for forest cover and forest stand parameter estimation Géza Király 1, Gábor Brolly 1 1 University.>")

 Tree measurement (diameters and heights) Defect recognition and determination.>")


 as a tool for forest.>")


>")

