Download presentation
Presentation is loading. Please wait.

1
Science Assessment to Support an Illinois Nutrient Reduction Strategy Mark David, George Czapar, Greg McIsaac, Corey Mitchell August 8, 2013 11-08-12

2
Technical Tasks develop a science based technical assessment of: – current conditions in Illinois of nutrient sources and export by rivers in the state from point and non- point sources – methods that could be used to reduce these losses and estimates of their effectiveness throughout Illinois – estimates of the costs of statewide and watershed level application of these methods to reduce nutrient losses to meet TMDL and Gulf of Mexico goals

3
Steps we will take 1.determine current conditions 2.identify critical watersheds 3.estimate potential reductions and costs 4.develop scenarios

4
1. Current Conditions nutrient (nitrate and total P) loads from major river basins of Illinois – estimates of point and non-point sources – compare 1980-1996 with 1997-2011 – determine direction of loads determine current agricultural management practices across the state – nutrient inputs and management (fertilizers and manure) – current cropping practices – N and P loads and yields from water quality data
 loads from major river basins of Illinois – estimates of point and non-point sources – compare with – determine direction of loads determine current agricultural management practices across the state – nutrient inputs and management (fertilizers and manure) – current cropping practices – N and P loads and yields from water quality data.")
5
Point Source P Analysis began with IEPA’s total P analysis – USEPA nutrient loading tool that is linked to the Integrated Compliance Information System (ICIS) – focused on larger point sources in state IEPA focused on 108 sources (used IAWA request for data) 42 facilities responded with P data we added one additional facility (Decatur) also looked at the other majors and all minors – mostly used ICIS concentrations for total P – IEPA knowledge of industrial sources for total P concentrations – some industrial sources have shut down; actual number is currently less
 – focused on larger point sources in state IEPA focused on 108 sources (used IAWA request for data) 42 facilities responded with P data we added one additional facility (Decatur) also looked at the other majors and all minors – mostly used ICIS concentrations for total P – IEPA knowledge of industrial sources for total P concentrations – some industrial sources have shut down; actual number is currently less")
6
Point Source N Analysis solicited total N and nitrate data from operators via IAWA – received useable data from 31 facilities (1.3 to 712 MGD, median 12 MGD) – most provided 5-years of data (2008 to 2012) total N 16.8 mg N/L; nitrate-N 14.9 mg N/L applied to other facilities in ICIS N database – average from typical plants in survey – applied to 392 sources in ICIS – all POTW’s
 – most provided 5-years of data (2008 to 2012) total N 16.8 mg N/L; nitrate-N 14.9 mg N/L applied to other facilities in ICIS N database – average from typical plants in survey – applied to 392 sources in ICIS – all POTW’s")
7
Point Source N Loads Total NNitrate-N 1000 tons N yr -1 (392 sources) State39.634.1 Illinois River 34.129.2 Green River 0.05 0.04 Big Muddy 0.55 0.49 Kaskaskia River 1.00 0.88 Little Wabash 0.22 0.20 Rock River 1.79 1.58 Vermilion River 0.70 0.62 Embarras River 0.27 0.24 All other basins 0.94 0.80 State (David and Gentry, 2000) 39.0 State consumption of N (David et al., 2010) 56.0
 State Illinois River Green River Big Muddy Kaskaskia River Little Wabash Rock River Vermilion River Embarras River All other basins State (David and Gentry, 2000) 39.0 State consumption of N (David et al., 2010) 56.0")
8
Point Source P Loads Total P (1000 tons P yr -1 ) (all, 1660 sources)(majors, 263) * State8.167.54 Illinois River 6.626.25 Green River 0.01 Big Muddy 0.100.08 Kaskaskia River 0.230.18 Little Wabash 0.080.06 Rock River 0.460.41 Vermilion River 0.100.09 Embarras River 0.050.03 All other basins 0.510.43 State (David and Gentry, 2000) 6.67 State consumption of P (Jacobson et al., 2011) 5.92 *this number is from ICIS 2009, some are no longer operational
 (all, 1660 sources)(majors, 263) * State Illinois River Green River 0.01 Big Muddy Kaskaskia River Little Wabash Rock River Vermilion River Embarras River All other basins State (David and Gentry, 2000) 6.67 State consumption of P (Jacobson et al., 2011) 5.92 *this number is from ICIS 2009, some are no longer operational")
9
Riverine fluxes used USGS flow data and IEPA and USGS nutrient data for 1980 through 2011 eight major rivers in state (drain 74% of state) – assumed to represent all of the state used both linear interpolation for total N, nitrate-N, dissolved reactive P (DRP), and total P; USGS WRDTS for nitrate-N, DRP, and total P Rock River contribution by difference in stations or by assuming outlet represents Illinois well
 – assumed to represent all of the state used both linear interpolation for total N, nitrate-N, dissolved reactive P (DRP), and total P; USGS WRDTS for nitrate-N, DRP, and total P Rock River contribution by difference in stations or by assuming outlet represents Illinois well")
10
Load Estimators no standard method, unless you have a concentration every day – much argument about various methods interpolation is simple, and works well for larger rivers and nutrients such as nitrate-N for P, interpolation has limitations at high flows, when most P loss occurs (Royer et al., 2006) – Weighted Regressions on Time, Discharge, and Season is newer USGS approach (Hirsch et al., 2010)
 – Weighted Regressions on Time, Discharge, and Season is newer USGS approach (Hirsch et al., 2010)")
11
Riverine fluxes continued interpolation and WRDTS gave similar results for nitrate-N; for DRP and total P WRDTS gave higher estimates for smaller rivers – Illinois River nearly the same for both nitrate-N and total P with either method – Rock River best estimated by difference between upstream and downstream sites we used interpolation for nitrate-N and total N, WRDTS for DRP and total P for final estimates

12
Riverine N and P Fluxes WaterNitrate-NTotal NDRPTotal P 10 9 m 3 yr -1 1000 tons N or P yr -1 David & Gentry (2000) 4724414.2 1980-1996 48.21832397.015.4 1997-2011 48.81862438.417.0 Point sources 34.1 39.6 8.2 Percent of 1997-2011 load Point sources 18.4 16.348 David & Gentry (2000) 1647
 Point sources Percent of load Point sources David & Gentry (2000) 1647")
13
Flow and Nutrient Loads

14
Trends through time no significant trend for flow using linear regression of annual volume regression model with flow and time – for nitrate, R 2 =0.77, flow p < 0.0001, year not significant – for total P, R 2 =0.97, flow and year both significant at p < 0.0001 – for DRP, R 2 =0.96, flow and year both significant at p < 0.0001

15
Riverine N and P loads (1997-2011) Nitrate-NTotal P 1000 tons N or P yr -1 State18617.0 Illinois River 1048.5 Green River 4.10.2 Big Muddy 9.00.5 Kaskaskia River 4.71.2 Little Wabash 2.51.1 Rock River 130.8 Vermilion River 8.60.4 Embarras River 6.60.5
 Nitrate-NTotal P 1000 tons N or P yr -1 State Illinois River Green River Big Muddy Kaskaskia River Little Wabash Rock River Vermilion River Embarras River")
16
Riverine Loads through Time

17
Illinois Compared with MRB

18
Illinois as % of MRB 20.2 11.3 David and Gentry (2000) 15% for total N, 10% for P
 15% for total N, 10% for P")
19
N and P Yields for State, 1980 to 1997 From David and Gentry (2000)
")
20
N and P Yields for State, 1997 to 2011

21
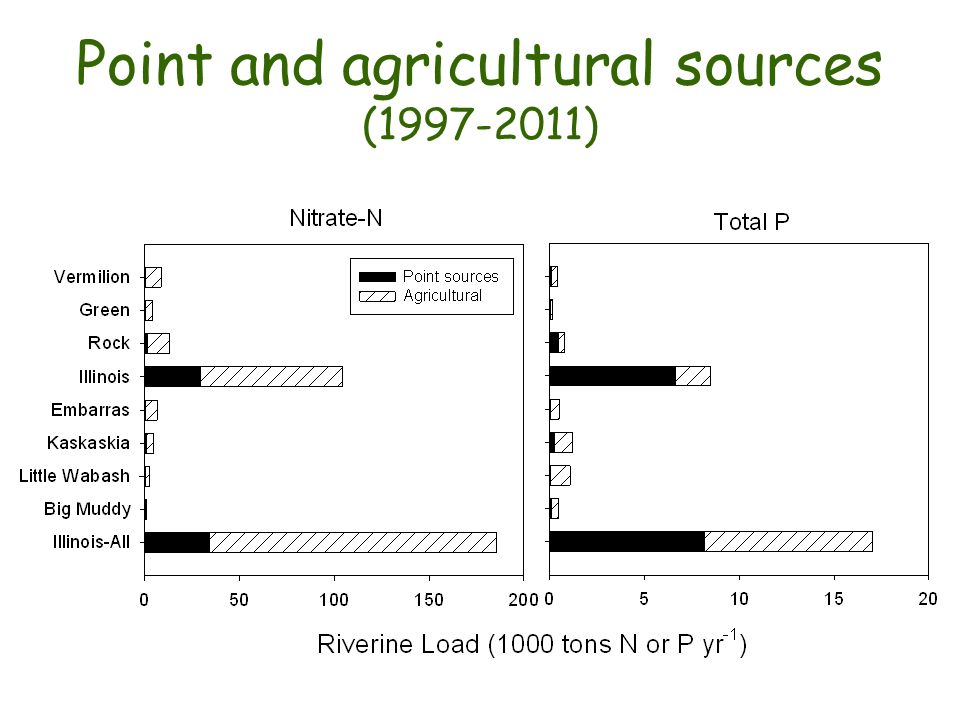
Point and agricultural sources (1997-2011)
")
23
Dissolved Reactive P versus Total P

24
Goal or Target 45% reduction in 1980 to 1996 loads – nitrate-N target of 100,000 tons N yr -1 – total P target of 8,500 tons P yr -1 larger reductions needed from 1997 to 2011 average loads – 186,000/86,000 tons N as nitrate-N needed (46%) – 17,000/8,500 tons total P needed (50%) example reduction for point source P – all majors P reduction to 1 mg P/L limit, 0.7 mg P/L average would give a 4,800 ton P reduction
 – 17,000/8,500 tons total P needed (50%) example reduction for point source P – all majors P reduction to 1 mg P/L limit, 0.7 mg P/L average would give a 4,800 ton P reduction")
25
Point and agricultural sources (1997-2011)
")
26
Nitrate-N and Total P Targets Red line is target, purple is average 1997 to 2011

27
2. Critical Watershed Identification identify 8 digits HUCs with the highest nutrient yields and loads to the Gulf of Mexico identify watersheds with nutrient impaired water bodies (303d list) determine overlap estimate point and non-point sources of N and P within watersheds
 determine overlap estimate point and non-point sources of N and P within watersheds.")
29
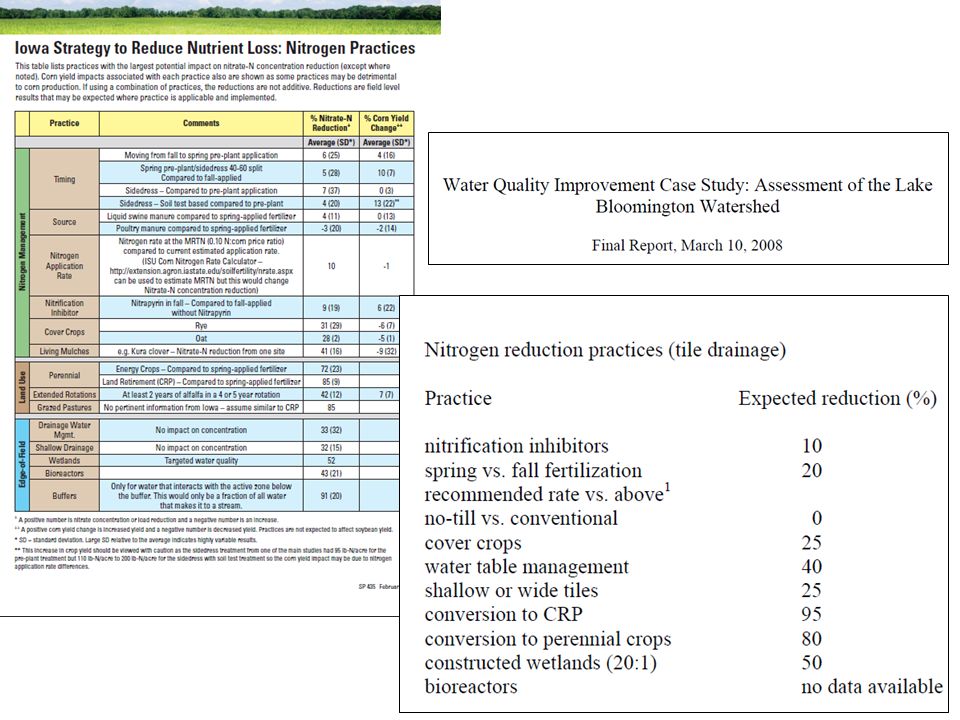
3. Estimate Potential Reductions and Costs estimate field-level effectiveness of various agricultural management practices – utilize SAB, Iowa, and Lake Bloomington Project estimates – knowledge in Illinois determine possible point source reductions estimate costs – Gary Schnitkey (agricultural economist) will lead – initial investments – likely to annualize costs over 25 years
 will lead – initial investments – likely to annualize costs over 25 years.")
30
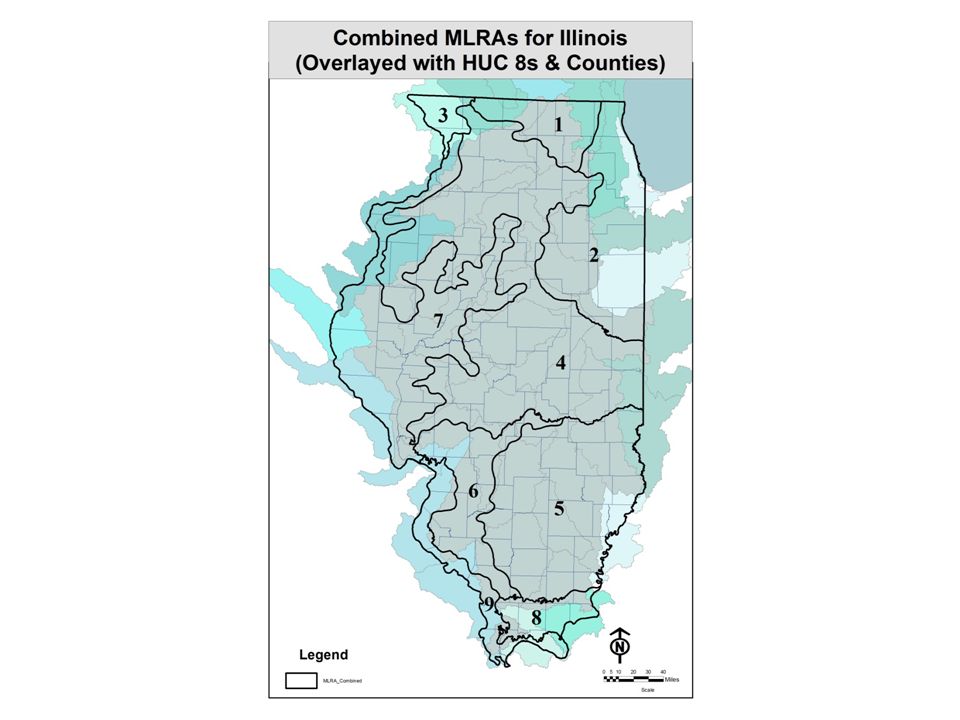
Combined MLRA’s

33
Agricultural Management by MLRA Combined MLRA DescriptionCorn (acres) Soybean (acres) Wheat (acres) Drained acres (% of crop acres) Corn yield (bushels /acre) Soybean yield (bushels /acre) MLRA 1 Northern Illinois drift plain515,905224,18620,192 288,491 (39)16148 MLRA 2 Northeastern Illinois heavy till plain1,532,1001,111,88542,404 2,063,695 (78)15039 MLRA 3 Northern Mississippi Valley163,50752,4321,975 20,942 (10)16050 MLRA 4Deep loess and drift5,579,9803,343,44476,078 5,437,807 (61)16452 MLRA 5Claypan1,609,6331,991,939352,839 310,087 (9)12839 MLRA 6Thin loess and till664,242689,773161,180 226,971 (17)13042 MLRA 7 Central Mississippi Valley, Northern Part2,058,8531,288,68673,884 1,284,588 (38)15549 MLRA 8 Sandstone and shale hills and valleys83,969115,24410,658 49,565 (25)10333 MLRA 9 Central Mississippi Valley, Western Part203,736314,66278,250 23,769 (5)12539 Sum12,411,9259,132,251817,4609,705,916 (43) Average crop acres and yields 2008 through 2012
 Soybean (acres) Wheat (acres) Drained acres (% of crop acres) Corn yield (bushels /acre) Soybean yield (bushels /acre) MLRA 1 Northern Illinois drift plain515,905224,18620, ,491 (39)16148 MLRA 2 Northeastern Illinois heavy till plain1,532,1001,111,88542,404 2,063,695 (78)15039 MLRA 3 Northern Mississippi Valley163,50752,4321,975 20,942 (10)16050 MLRA 4Deep loess and drift5,579,9803,343,44476,078 5,437,807 (61)16452 MLRA 5Claypan1,609,6331,991,939352, ,087 (9)12839 MLRA 6Thin loess and till664,242689,773161, ,971 (17)13042 MLRA 7 Central Mississippi Valley, Northern Part2,058,8531,288,68673,884 1,284,588 (38)15549 MLRA 8 Sandstone and shale hills and valleys83,969115,24410,658 49,565 (25)10333 MLRA 9 Central Mississippi Valley, Western Part203,736314,66278,250 23,769 (5)12539 Sum12,411,9259,132,251817,4609,705,916 (43) Average crop acres and yields 2008 through 2012")
34
Agricultural Management by MLRA Combined MLRA DescriptionEstimated corn fertilizer (lbs N/acre/yr) Estimated corn fertilizer + manure (lbs N/acre/yr) Row crops (acres) Nitrate-N yield per row crop acre (lbs N/acre/yr) MLRA 1 Northern Illinois drift plain152168 760,28320.4 MLRA 2 Northeastern Illinois heavy till plain158164 2,686,38925.0 MLRA 3 Northern Mississippi Valley135158 217,91431.3 MLRA 4Deep loess and drift150159 8,999,50219.6 MLRA 5Claypan180196 3,954,411 6.6 MLRA 6Thin loess and till156170 1,515,195 7.4 MLRA 7 Central Mississippi Valley, Northern Part155169 3,421,42324.5 MLRA 8 Sandstone and shale hills and valleys209219 209,871 3.9 MLRA 9 Central Mississippi Valley, Western Part192204 596,648 4.0 Sum157168 22,361,636
 Estimated corn fertilizer + manure (lbs N/acre/yr) Row crops (acres) Nitrate-N yield per row crop acre (lbs N/acre/yr) MLRA 1 Northern Illinois drift plain , MLRA 2 Northeastern Illinois heavy till plain ,686, MLRA 3 Northern Mississippi Valley , MLRA 4Deep loess and drift ,999, MLRA 5Claypan ,954, MLRA 6Thin loess and till ,515, MLRA 7 Central Mississippi Valley, Northern Part ,421, MLRA 8 Sandstone and shale hills and valleys , MLRA 9 Central Mississippi Valley, Western Part , Sum ,361,636")
35
Agricultural Management by MLRA Combined MLRA DescriptionEstimated Corn fertilizer (lbs N/acre/yr) Estimated Corn fertilizer + manure (lbs N/acre/yr) Row crops (acres) Nitrate-N yield per row crop acre (lbs N/acre/yr) MLRA 1 Northern Illinois drift plain152168 760,28320.4 MLRA 2 Northeastern Illinois heavy till plain158164 2,686,38925.0 MLRA 3 Northern Mississippi Valley135158 217,91431.3 MLRA 4Deep loess and drift150159 8,999,50219.6 MLRA 5Claypan180196 3,954,411 6.6 MLRA 6Thin loess and till156170 1,515,195 7.4 MLRA 7 Central Mississippi Valley, Northern Part155169 3,421,42324.5 MLRA 8 Sandstone and shale hills and valleys209219 209,871 3.9 MLRA 9 Central Mississippi Valley, Western Part192204 596,648 4.0 Sum157168 22,361,636
 Estimated Corn fertilizer + manure (lbs N/acre/yr) Row crops (acres) Nitrate-N yield per row crop acre (lbs N/acre/yr) MLRA 1 Northern Illinois drift plain , MLRA 2 Northeastern Illinois heavy till plain ,686, MLRA 3 Northern Mississippi Valley , MLRA 4Deep loess and drift ,999, MLRA 5Claypan ,954, MLRA 6Thin loess and till ,515, MLRA 7 Central Mississippi Valley, Northern Part ,421, MLRA 8 Sandstone and shale hills and valleys , MLRA 9 Central Mississippi Valley, Western Part , Sum ,361,636")
38
4. Develop Scenarios combine possible point source reductions and field level agricultural reductions – percent reduction by practice – costs of implementation – target 45% reductions in N and P scale-up to critical watersheds and statewide provide a range of scenarios to meet reduction targets – area needed by practice – initial investment and annualized costs

Similar presentations


 LTAR USDA-ARS Columbia Missouri Translating Missouri USDA-ARS Research and Technology into Practice A training session.>")
