Download presentation
Presentation is loading. Please wait.

1
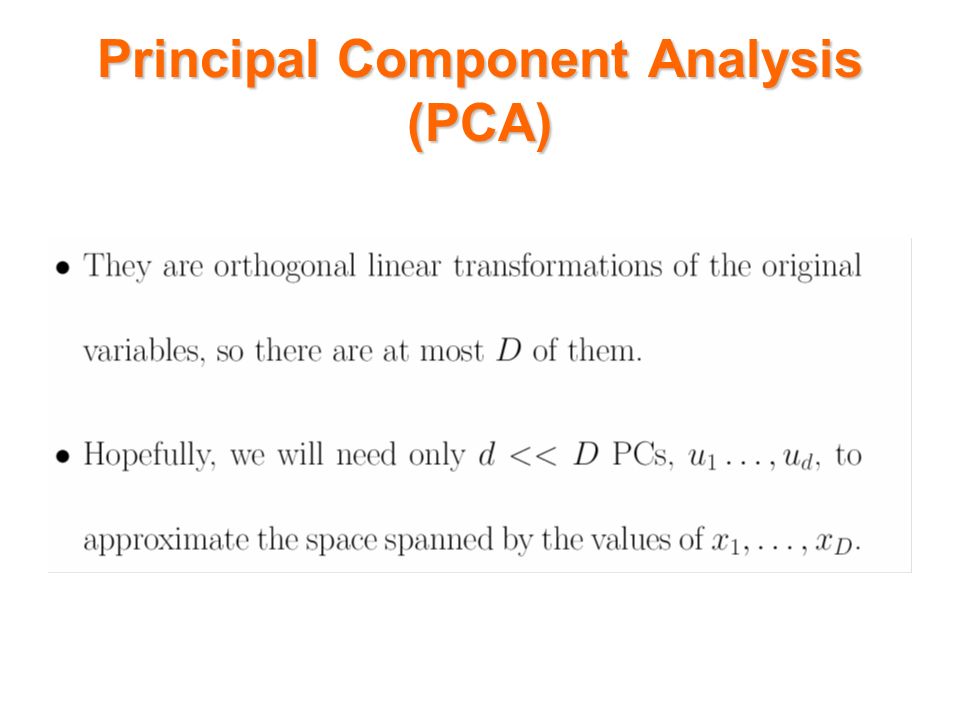
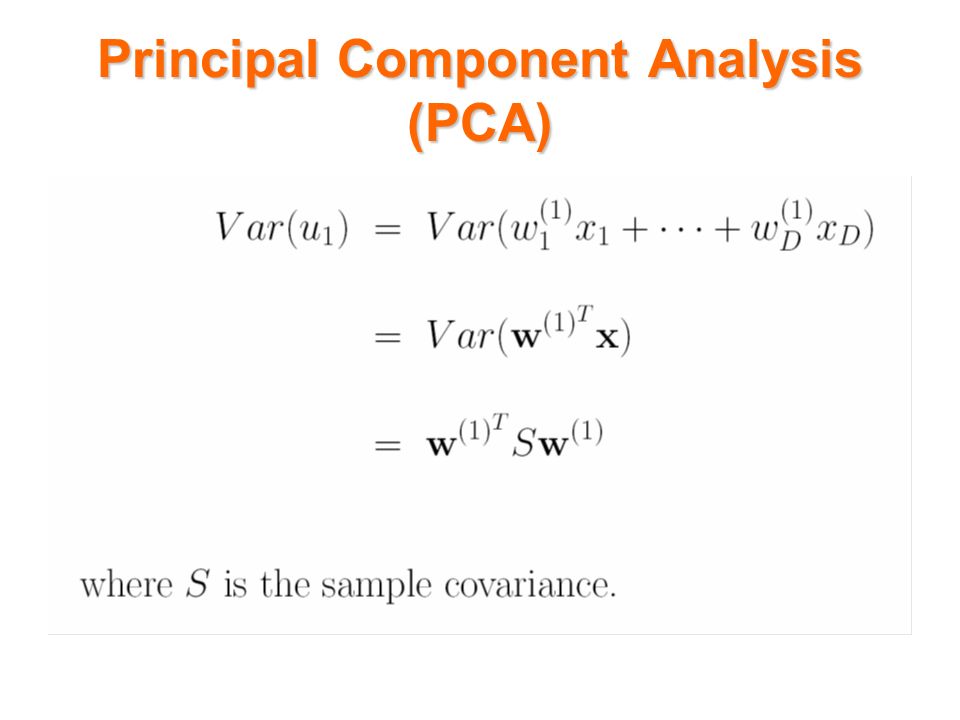
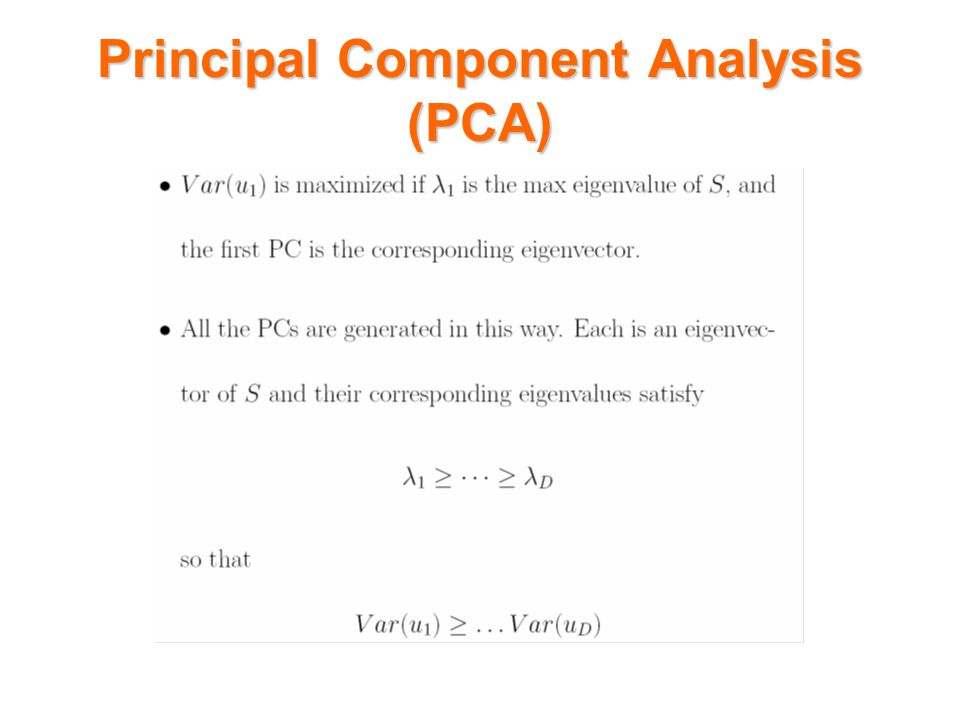
Principal Component Analysis (PCA)
")
11
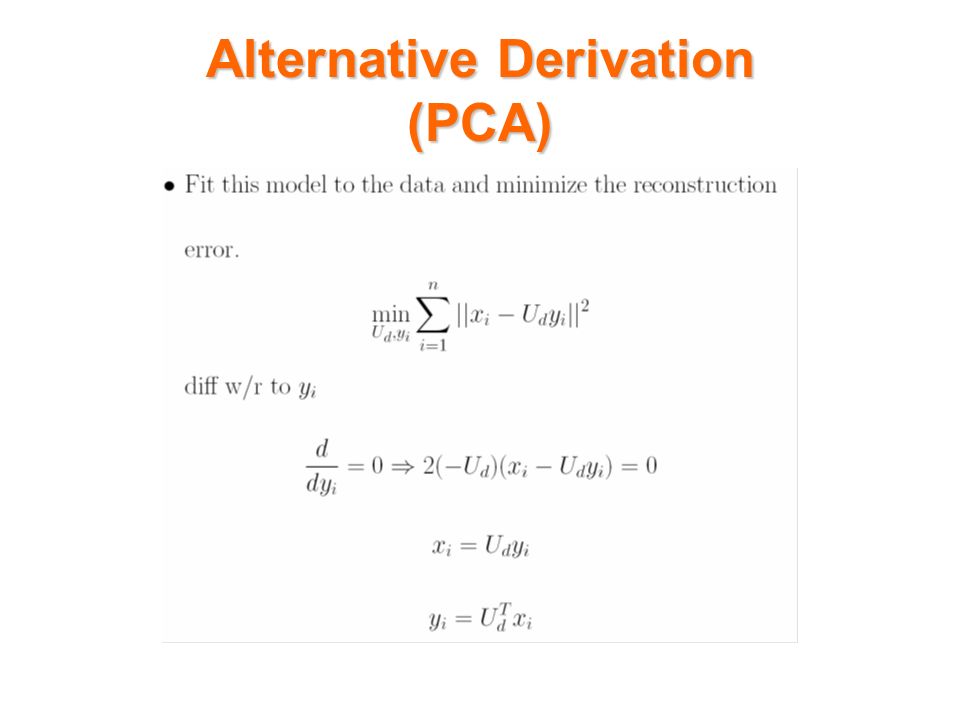
Alternative Derivation (PCA)
")
15
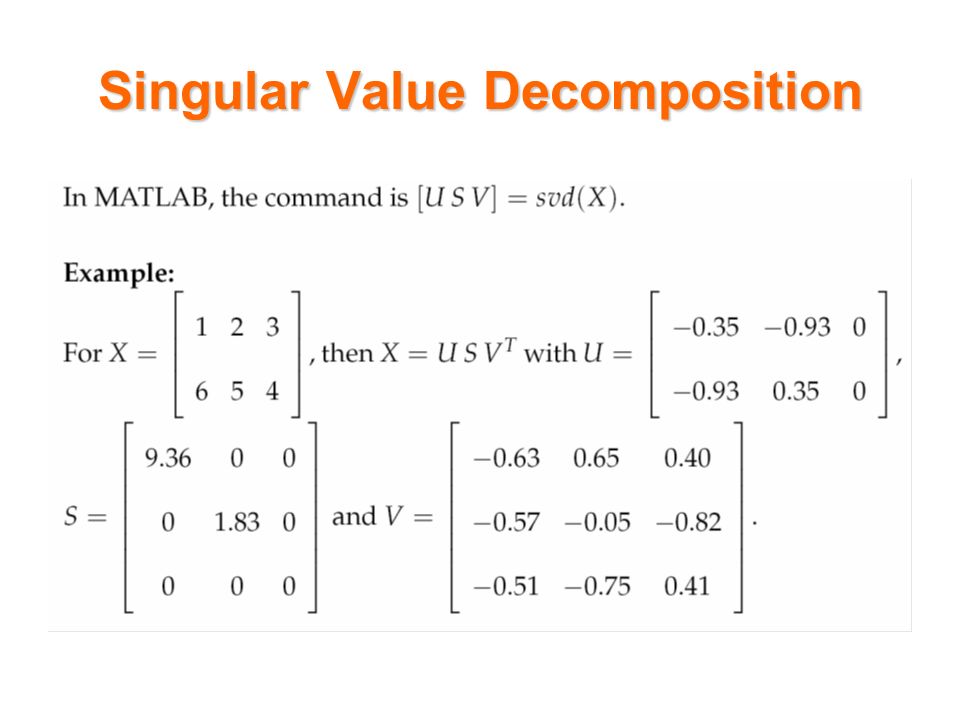
Singular Value Decomposition

18
Example 1 Use the data set "noisy.mat" available on your CD. The data set consists of 1965, 20-pixel-by-28-pixel grey-scale images distorted by adding Gaussian noises to each pixel with s=25.

19
Example 1 Apply PCA to the noisy data. Suppose the intrinsic dimensionality of the data is 10. Compute reconstructed images using the top d = 10 eigenvectors and plot original and reconstructed images

20
Example 1 If original images are stored in matrix X (it is 560 by 1965 matrix) and reconstructed images are in matrix X_hat, you can type in colormap gray and then imagesc(reshape(X(:, 10), 20 28)’) imagesc(reshape(X_hat(:, 10), 20 28)’) to plot the 10th original image and its reconstruction.
 and reconstructed images are in matrix X_hat, you can type in colormap gray and then imagesc(reshape(X(:, 10), 20 28)’) imagesc(reshape(X_hat(:, 10), 20 28)’) to plot the 10th original image and its reconstruction.")
21
Example 2

22
Load the sample data, which includes digits 2 and 3 of 64 measurements on a sample of 400. load 2_3.mat Extract appropriate features by PCA [u s v]=svd(X','econ'); Create data Low_dimensional_data=u(:,1:2); Observe low dimensional data Imagesc(Low_dimensional_data)
; Create data Low_dimensional_data=u(:,1:2); Observe low dimensional data Imagesc(Low_dimensional_data).")
Similar presentations


 Principal Components Analysis Martin Russell.>")
