Download presentation
Presentation is loading. Please wait.

2
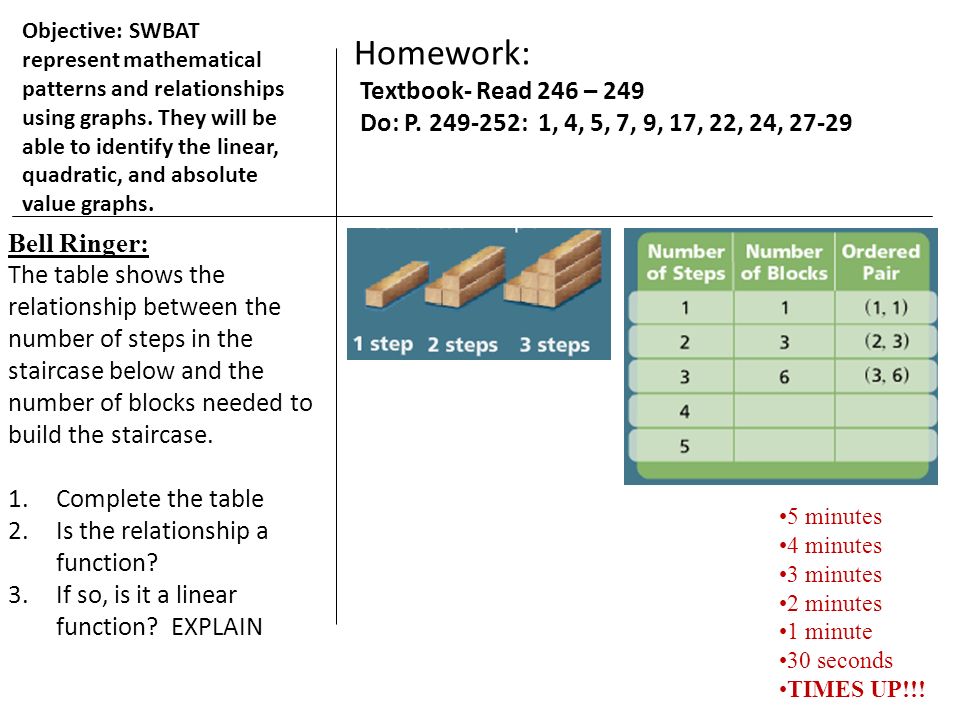
Objective: SWBAT represent mathematical patterns and relationships using graphs. They will be able to identify the linear, quadratic, and absolute value graphs. Bell Ringer: The table shows the relationship between the number of steps in the staircase below and the number of blocks needed to build the staircase. 1.Complete the table 2.Is the relationship a function? 3.If so, is it a linear function? EXPLAIN 5 minutes 4 minutes 3 minutes 2 minutes 1 minute 30 seconds TIMES UP!!! Homework: Textbook- Read 246 – 249 Do: P. 249-252: 1, 4, 5, 7, 9, 17, 22, 24, 27-29

3
Objective: SWBAT represent mathematical patterns and relationships using graphs. They will be able to identify the linear, quadratic, and absolute value graphs. Bell Ringer: The table shows the relationship between the number of steps in the staircase below and the number of blocks needed to build the staircase. The values in the “Number of Steps” column change by 1 each time, a constant change. The values in the “Number of Blocks” column do not show a constant change. Homework: Textbook- Read 246 – 249 Do: P. 249-252: 1, 4, 5, 7, 9, 17, 22, 24, 27-29 The relationship is a function because each input value has only one output value. The relationship is NOT a linear function. Although the change in input values (number of steps) is constant, the change in output values (number of blocks) is not constant.
 is constant, the change in output values (number of blocks) is not constant..")
4
Definitions Linear Function: A linear function is a function whose graph is a non vertical line or part of a non vertical line: Nonlinear Function: Objective: SWBAT represent mathematical patterns and relationships using graphs. They will be able to identify the linear, quadratic, and absolute value graphs. Homework: Textbook- Read 246 – 249 Do: P. 249-252: 1, 4, 5, 7, 9, 17, 22, 24, 27-29 A nonlinear function is a function whose graph is not a line or part of a line:

5
Objective: SWBAT represent mathematical patterns and relationships using graphs. They will be able to identify the linear, quadratic, and absolute value graphs. Homework: Textbook- Read 246 – 249 Do: P. 249-252: 1, 4, 5, 7, 9, 17, 22, 24, 27-29 The area A, in square inches, of a pizza is a function of its radius r, in inches. Graph the function shown by the table. Is the function linear of non linear? 1. What do you KNOW? The relationship shown in the table is a FUNCTION 2. What do you NEED? To classify the function as LINEAR or NONLINEAR 3. What is your PLAN? Use the table to make a GRAPH

6
Objective: SWBAT represent mathematical patterns and relationships using graphs. They will be able to identify the linear, quadratic, and absolute value graphs. Homework: Textbook- Read 246 – 249 Do: P. 249-252: 1, 4, 5, 7, 9, 17, 22, 24, 27-29 The area A, in square inches, of a pizza is a function of its radius r, in inches. Graph the function shown by the table. Is the function linear of non linear? LINEAR or NONLINEAR? WHY??

7
What is the function represented by the ordered pairs: (1, 1), (2, 4), (3, 9), (4, 16), and (5, 25)?c Objective: SWBAT represent mathematical patterns and relationships using graphs. They will be able to identify the linear, quadratic, and absolute value graphs. Homework: Textbook- Read 246 – 249 Do: P. 249-252: 1, 4, 5, 7, 9, 17, 22, 24, 27-29 Hint: make table to organize the x- and y-values. For each row, identify rules that produce the given dependent variable when you substitute the independent variable. Look for a pattern in the dependent variables. Complete with your “elbow” partner:

8
A certain function fits the following description: As the value of x increases by 1 each time, the value of y continually decreases by a smaller amount each time, and never reaches a value as low as 1. 1. Is this function a linear or nonlinear? 2. Explain your reasoning? Reflection Objective: SWBAT represent mathematical patterns and relationships using graphs. They will be able to identify the linear, quadratic, and absolute value graphs. Homework: Textbook- Read 246 – 249 Do: P. 249-252: 1, 4, 5, 7, 9, 17, 22, 24, 27-29

Similar presentations


>")


 Lessons 4-2 and 4-3.>")


